
Business
Gold Hits Record High 2026 as Trump Davos-Greenland Crisis Deepens

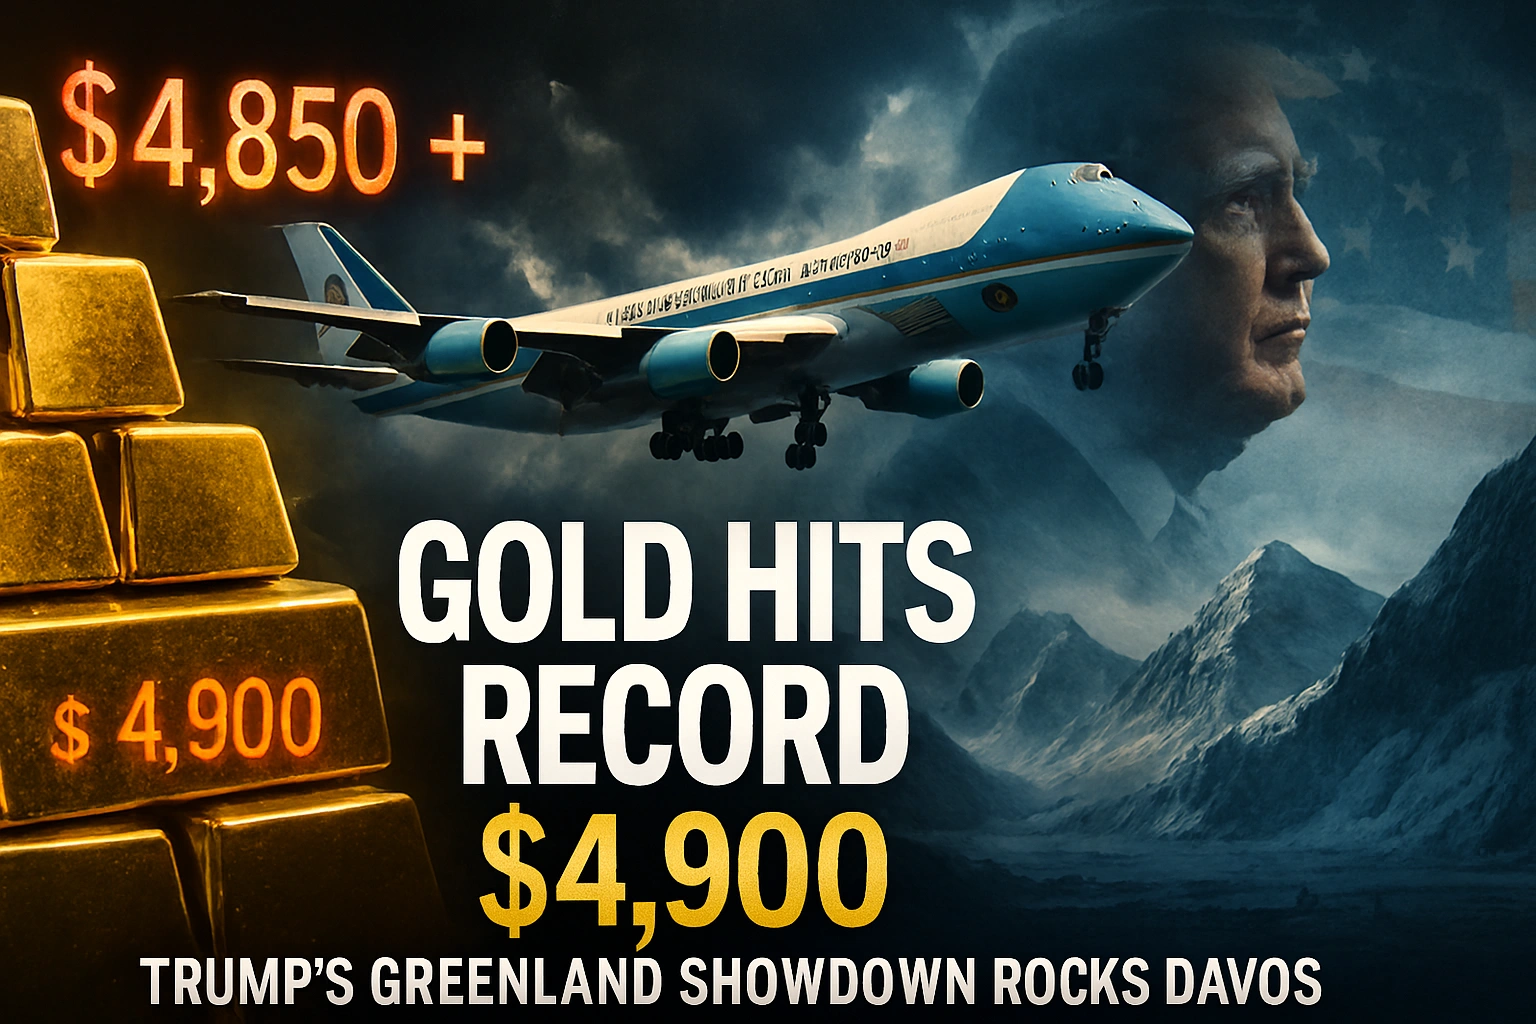
Gold prices soar past $4,800 amid Trump’s Greenland tariff threats and Davos arrival. Analysis of safe-haven demand, geopolitical risks, and market outlook.
The yellow metal has spoken, and its message reverberates from trading floors in London to the Alpine corridors of power. Gold prices shattered all previous records on January 21, 2026, surging past $4,850 per troy ounce as President Donald Trump departed for the World Economic Forum in Davos—a journey briefly interrupted when Air Force One experienced an electrical malfunction, forcing a return to base and a switch to the backup aircraft. The incident, minor in technical terms but symbolically resonant, seemed to mirror the turbulence roiling global markets as investors flee to the ultimate safe haven amid escalating tensions over Greenland.
The timing could scarcely be more charged. Trump’s renewed push to acquire Greenland—dismissed as improbable during his first term—has evolved from rhetorical flourish to concrete policy threat, complete with proposed tariffs on Denmark and the European Union should they resist American overtures. As the president’s plane finally lifted off for Switzerland, gold traders were already pricing in scenarios that would have seemed fantastical mere months ago: a transatlantic trade war triggered by Arctic territorial ambitions, a fracturing of NATO’s unity, and the potential unraveling of the post-1945 consensus on sovereignty and territorial integrity.
This is not merely another spike in precious metals pricing. The gold record high January 2026 represents a profound vote of no confidence in the stability of the international order, a hedge against the unthinkable becoming routine. As Trump prepares to address global elites in Davos—many of whom view his Greenland gambit with alarm bordering on disbelief—the question is no longer whether markets will react, but how far the contagion will spread.
The Gold Rally in Context: Safe Haven Demand Meets Dollar Doubt
To understand why gold prices hit record high January 2026, one must first grasp the convergence of forces that have transformed bullion from a defensive play into a must-own asset. According to data compiled by Bloomberg, spot gold has risen approximately 18% since the start of the year, obliterating the previous all-time high of $4,150 set in late 2025. The surge accelerates a trend that began when Trump’s transition team first floated the Greenland acquisition in December, but the current rally reflects broader anxieties.
The immediate catalyst is clear: Trump’s tariff threats over Greenland have injected extraordinary uncertainty into transatlantic trade relations. The president has suggested levies as high as 200% on select Danish and European goods should Copenhagen refuse to negotiate Greenland’s status—a position that The Financial Times describes as “without precedent in modern diplomatic history.” European Commission President Ursula von der Leyen has called the proposal “an assault on the principles that have governed relations between democracies for eight decades,” setting the stage for confrontation rather than compromise.
But the Trump Greenland tariffs represent only one dimension of gold’s safe haven appeal. The dollar, traditionally an alternative refuge during geopolitical stress, has weakened against a basket of currencies as investors question whether the United States can simultaneously pursue aggressive unilateral policies and maintain the reserve currency’s privileged status. The dollar index has declined nearly 4% since early January, a significant move that makes gold more attractive to holders of other currencies while also reflecting doubts about American policy coherence.
Historical parallels abound, though none align perfectly. The 1970s stagflation era saw gold surge from $35 per ounce to over $800 as the Bretton Woods system collapsed and geopolitical shocks—oil embargoes, Cold War tensions—eroded confidence in fiat currencies. More recently, Trump’s first-term trade war with China in 2019 drove gold above $1,500 as investors hedged against tariff escalation and growth slowdowns. Yet the current rally differs in velocity and breadth: central banks from China to Poland are reportedly accelerating gold purchases, while retail demand in Asia has surged despite record prices—a sign that even price-sensitive buyers view current risks as extraordinary.
“Gold is doing what it’s supposed to do,” noted a commodities strategist at a major investment bank in a Reuters interview, “but the speed and magnitude suggest markets are pricing in tail risks that we normally associate with wartime or financial crisis. The Greenland situation has become a focal point for broader anxieties about American reliability and the rules-based order.”
The Federal Reserve’s policy stance adds another layer of complexity. With inflation still above target but growth showing signs of deceleration, the Fed faces an impossible trilemma: maintain credibility through continued restraint, support growth through easing, or absorb the inflationary shock of potential tariffs. Gold, which pays no interest and thus competes with bonds when rates rise, has historically thrived in environments where real yields—nominal rates minus inflation—turn negative or uncertainty renders yield calculations irrelevant. Current market pricing suggests investors believe the Fed will ultimately prioritize growth over inflation control, a calculation that favors hard assets.
Greenland Becomes the Fault Line: Arctic Ambitions and Atlantic Fractures
The question of how Greenland transformed from a peripheral issue to the potential trigger for a transatlantic rupture deserves careful examination. The autonomous Danish territory, home to approximately 57,000 people and vast deposits of rare earth minerals critical for modern technology, has long attracted interest from great powers. Yet Trump’s renewed campaign—characterized by public statements describing Greenland’s acquisition as essential for national security and economic competitiveness—represents a sharp departure from diplomatic norms.
As The New York Times reported, Trump’s advisers have framed Greenland through the lens of strategic competition with China, which has sought Arctic access and rare earth dominance for over a decade. Greenland’s mineral wealth includes neodymium, praseodymium, and dysprosium—elements essential for electric vehicle motors, wind turbines, and advanced military systems. China currently controls approximately 70% of global rare earth processing, a monopoly that American policymakers view as an unacceptable vulnerability.
Beyond minerals, Greenland occupies critical geography as Arctic ice melt opens new shipping routes and resource extraction opportunities. The Northwest Passage, increasingly navigable due to climate change, could reduce shipping times between Asia and Europe by roughly 40% compared to traditional routes through the Suez or Panama canals. Military strategists note that Thule Air Base, already operated by the United States in northwestern Greenland, would become even more valuable in any scenario involving Russian or Chinese Arctic expansion.
Denmark’s position, however, remains unambiguous. Prime Minister Mette Frederiksen has stated repeatedly that “Greenland is not for sale,” a position supported unanimously by the Danish parliament. Greenland’s own government, led by Premier Múte Bourup Egede, has emphasized the territory’s right to self-determination while noting its constitution does not permit unilateral secession from the Kingdom of Denmark without Danish consent—a legal complexity that makes any transfer of sovereignty extraordinarily difficult even if Greenlanders desired it.
The escalation to tariff threats marks a dangerous inflection point. The Economist notes that using trade policy to coerce territorial concessions from an ally violates both World Trade Organization principles and the spirit of NATO, potentially setting precedents that could undermine the entire framework of Western economic and security cooperation. European officials have responded with unusual unity, warning that American tariffs would trigger immediate retaliation and could force a fundamental reassessment of the transatlantic relationship.
NATO complications add further volatility. Both the United States and Denmark are founding members of the alliance, which operates on principles of collective defense and mutual respect for sovereignty. Article 5—the collective defense clause—has been invoked only once, following the September 11 attacks, when European allies rallied to America’s defense. The prospect of the alliance’s most powerful member threatening economic warfare against a small fellow member over territorial acquisition raises existential questions about NATO’s purpose and viability.
Geopolitical analysts suggest several factors explain the timing of Trump’s push. The Ukraine war has demonstrated the strategic value of resource security and territorial control. China’s Belt and Road Initiative continues expanding into the Arctic through partnerships with Russia. And domestic American politics increasingly reward bold nationalist postures over traditional diplomatic caution. Yet the gap between Trump’s stated objectives and feasible outcomes remains vast—a disconnect that markets are pricing into safe haven assets like gold.
Davos Under Strain: Global Elites Confront American Unilateralism
The World Economic Forum’s annual gathering in Davos typically serves as a venue for consensus-building among political and business elites, a place where disagreements are aired but common ground is sought. Trump’s arrival this week, however, has transformed the event into something approaching a reckoning with American power and its limits.
According to reports from The Wall Street Journal, European leaders have coordinated their messaging in advance of Trump’s expected address, preparing to confront the Greenland issue directly while seeking to preserve broader economic ties. French President Emmanuel Macron, German Chancellor Friedrich Merz, and European Commission officials plan to emphasize that territorial sovereignty is non-negotiable regardless of economic inducements or threats—a message intended for domestic audiences as much as for Trump.
The president’s Davos speech, scheduled for the forum’s main stage, will be scrutinized for signals about how far he intends to push the Greenland confrontation. Trump’s advisers have suggested he will frame the issue in terms of “American renewal” and “correcting historic mistakes,” language that could either provide face-saving ambiguity or double down on maximalist demands. Markets appear positioned for the latter, with gold’s continued strength suggesting traders expect escalation rather than de-escalation.
Business leaders attending Davos face their own dilemmas. American companies with significant European operations—a category that includes most Fortune 500 firms—would suffer severe disruption from any transatlantic trade war. Yet corporate executives have limited leverage over Trump’s foreign policy and risk domestic political backlash if they appear to prioritize foreign relationships over American interests as the administration defines them.
The International Monetary Fund’s managing director is expected to warn during the forum that a trade conflict between the United States and Europe could shave up to 1.5% from global GDP growth, a shock comparable to the initial impact of COVID-19 lockdowns. The IMF’s analysis, as covered by the Financial Times, suggests that even if tariffs are implemented briefly before negotiation, the uncertainty costs alone would trigger capital flight, supply chain disruptions, and investment delays that could take years to reverse.
China’s absence from high-profile Davos discussions is notable, as Beijing has carefully avoided entanglement in the Greenland dispute while quietly positioning itself to benefit from transatlantic discord. Chinese officials have signaled willingness to deepen economic ties with Europe should American relationships fray, offering a strategic alternative that European leaders find simultaneously attractive and concerning given their own worries about Chinese influence.
Potential outcomes range widely. Optimistic scenarios envision Trump using tariff threats as negotiating leverage to extract concessions on other issues—Arctic cooperation agreements, rare earth supply chains, defense burden-sharing—before declaring victory and stepping back. Pessimistic scenarios involve actual tariff implementation, European retaliation, and a downward spiral that fragments Western economic integration. Markets currently price probabilities somewhere between these extremes, with gold’s rally suggesting greater weight on downside risks.
Broader Implications and Outlook: When Safe Havens Become the Trade
The gold record high 2026 extends far beyond precious metals markets, sending ripples through currencies, sovereign debt, equities, and commodities. The dollar’s decline, already mentioned, accelerates as foreign central banks reportedly diversify reserves away from U.S. Treasury securities—not yet at panic levels, but sufficient to pressure yields higher and complicate Federal Reserve policy. The euro has strengthened despite Europe’s own economic challenges, reflecting a relative assessment that European institutions, whatever their flaws, present less immediate risk than American policy volatility.
Equity markets have responded with characteristic schizophrenia: technology stocks decline on fears that rare earth supply disruptions could raise input costs, while defense contractors rally on expectations of increased military spending. European indices underperform American counterparts as investors price in recession risk from potential tariffs, yet both lag the relentless upward march of gold and other hard assets.
Cryptocurrency advocates have sought to position Bitcoin and other digital assets as alternative safe havens, noting Bitcoin’s own surge above $105,000 this month. Yet analysis from Bloomberg suggests crypto’s rally reflects different dynamics—liquidity flows and speculative positioning—rather than the genuine flight-to-safety driving gold demand. When markets price genuine systemic risk, the argument goes, five thousand years of precedent favor the metal over the algorithm.
Commodity markets more broadly reveal growing concern about supply chain fragmentation. Industrial metals have rallied alongside gold as traders position for a world where geopolitical barriers replace just-in-time efficiency. Oil prices remain subdued, reflecting demand concerns, but natural gas has spiked on European fears about energy security should broader conflicts emerge. Agricultural commodities show increased volatility as weather uncertainties compound with trade policy unpredictability.
The question now dominating trading desk conversations: can gold breach $5,000 per ounce, and if so, when? Technical analysts point to chart patterns suggesting momentum remains strong, with limited resistance levels until $5,200. Fundamental analysts note that if Trump’s Greenland push triggers even a moderate trade conflict, safe haven demand could easily propel prices higher. Central bank buying—particularly from China, Russia, and emerging markets seeking to reduce dollar exposure—provides a steady bid that wasn’t present during previous gold rallies.
Yet risks to the gold thesis exist. Any genuine de-escalation in Davos or afterward would likely trigger profit-taking, potentially sharp given how rapidly positions have built. If the Federal Reserve signals greater tolerance for market volatility or commits to maintaining high rates regardless of growth concerns, real yields could rise enough to make interest-bearing assets competitive again. And gold’s rally itself could prove self-limiting: at current prices, mine supply increases while jewelry demand—particularly from price-sensitive Asian consumers—softens.
Policy risks extend beyond trade. The European Union faces internal challenges as member states debate how firmly to confront American demands, with some Eastern European nations prioritizing security ties over economic principles. NATO’s credibility hangs in the balance, with unclear implications for defense spending, strategic planning, and alliance cohesion. And the precedent of using economic coercion to pursue territorial claims, should it succeed, would fundamentally alter the post-1945 international system in ways that extend far beyond the Arctic.
Conclusion: The Price of Disruption
Gold’s ascent to record highs amid Trump’s Davos arrival and the Greenland standoff crystallizes a moment of profound uncertainty about the architecture of global order. The electrical issue that briefly grounded Air Force One—a minor technical glitch resolved within hours—serves as an unintended metaphor for the larger questions now confronting markets and policymakers. When established systems encounter unexpected turbulence, do they adapt and continue, or do cascade failures follow?
The answer matters enormously. Gold prices, for all their drama, are merely symptoms of deeper anxieties about reliability, predictability, and the rules that govern interaction between nations. If the United States can threaten tariffs to coerce territorial concessions from allies, what other norms might be negotiable? If Europe cannot defend the sovereignty of its own members without risking economic catastrophe, what does collective security mean? If markets must price the previously unthinkable as merely improbable, what risk-free rate truly exists?
These are not questions with easy answers, which is precisely why gold—that most ancient of safe havens—trades at prices that would have seemed fantastical even a year ago. Davos will provide some clarity in coming days, though perhaps not the reassurance that markets crave. Until then, the yellow metal’s message remains clear: in an age of disruption, the ultimate hedge is the asset that predates the disruption itself.
The world watches Switzerland this week, waiting to learn whether American ambition and European principle can find accommodation, or whether the fractures now visible will deepen into chasms. Gold traders, characteristically, are not waiting for the answer—they’re betting that asking the question is reason enough to buy.
Discover more from The Economy
Subscribe to get the latest posts sent to your email.


Markets & Finance
Presidential Stock Market Performance: How Trump’s Second Term Compares to History
Executive Summary: Since the November 5, 2024, presidential election, the U.S. stock market has navigated trade policy shifts, fluctuating tariff structures, and shifting interest rate expectations. Despite a sharp ~20% drawdown in early 2025, the S&P 500 generated a total return of 36.0% through September 2026, according to performance tracking from U.S. Bank Wealth Management.
While headline figures show strong market resilience, understanding how this performance ranks against modern predecessors—including Joe Biden, Barack Obama, Bill Clinton, and Ronald Reagan—requires examining underlying corporate earnings, market breadth, and Federal Reserve policy dynamics.
Historical Benchmark: S&P 500 Returns Across Modern Administrations
To accurately compare presidential stock market records, performance must be evaluated across full 4-year terms alongside cumulative mid-term benchmarks. Historical index data compiled by S&P Dow Jones Indices and analyzed by Schroders Investment Management shows that markets have historically trended upward regardless of party affiliation, averaging an annual total return of over 12% since 1946.
| Administration & Term | Period | S&P 500 Total Return (4-Year) | Cumulative 22-Mo. Benchmark | Primary Market Driver / Context |
|---|---|---|---|---|
| Ronald Reagan (Term 2) | 1985–1988 | +91.8% | +32.4% | Post-inflation recovery & 1980s tax restructuring |
| Bill Clinton (Term 1) | 1993–1996 | +88.6% | +21.2% | Early tech adoption & productivity boom |
| Bill Clinton (Term 2) | 1997–2000 | +88.6% | +48.1% | Dot-com expansion |
| Barack Obama (Term 1) | 2009–2012 | +85.1% | +41.5% | Post-Global Financial Crisis market rebound |
| Donald Trump (Term 1) | 2017–2020 | +81.3% | +24.8% | Tax Cuts and Jobs Act of 2017 & deregulation |
| Joe Biden | 2021–2024 | +66.3% | +18.4% | Post-pandemic stimulus & Tech/AI mega-cap surge |
| Barack Obama (Term 2) | 2013–2016 | +52.9% | +28.6% | Steady economic expansion & low interest rates |
| Donald Trump (Term 2) | 2025–2026 (In Progress) | N/A | +36.0% | Corporate earnings growth, domestic energy, & tech resilience |
Core Drivers of the 2025–2026 Equity Rally
1. Fundamental Earnings Growth Beat Expectations
Unlike market cycles driven purely by price-to-earnings (P/E) valuation expansion, the equity gains during 2025 and 2026 have been anchored in corporate earnings execution. S&P 500 second-quarter revenue grew over 16% year-over-year, while quarterly earnings surged 53%, more than doubling initial Wall Street forecasts. Third-quarter projections compiled by research teams at Bloomberg indicate sustained top-line revenue growth near 12% and earnings growth of 28%.
2. Market Rotation and Small-Cap Expansion
A notable divergence in Trump’s second term compared to earlier cycles is the broadening of market participation beyond mega-cap technology companies (“The Magnificent Seven”):
- Small-Cap Performance: The Russell 2000 and broader small-cap indices surged 60%+ from their April 2025 lows through September 2026.
- Sector Diversification: Financials, domestic industrials, and energy sectors saw accelerated inflows following regulatory easing and domestic energy development policies.
3. Institutional Volatility and Unprecedented Portfolio Activity
The market landscape in 2025 and 2026 has been marked by high policy-driven volatility. Disclosures analyzed by CBS News Financial Analysis and reporting from Reuters revealed unprecedented trading volume within executive investment accounts, executing thousands of transactions across defense, technology, real estate, and energy sectors during key legislative shifts.
Stay Ahead of the Markets
Subscribe to our free daily newsletter for institutional-grade analysis on how macroeconomic policies impact your portfolio.
Macro Economic Headwinds: Rates, Debt, and Inflation
While stock indices sit near historic highs, structural macroeconomic challenges remain. Here is a snapshot of the current macroeconomic realities:
- Elevated Federal Debt Costs: Data from the Federal Reserve Bank of St. Louis (FRED) highlights that the average interest rate on marketable U.S. Treasury debt climbed to 3.44%, compared to 1.42% in 2022. This elevation increases federal debt service obligations as maturing Treasury notes are refinanced at higher prevailing yields.
- Consumer Spending Shifts: Retail sales grew 5.0% year-over-year, though monthly momentum slowed. Wage growth at 3.2% provides ongoing income expansion but remains closely balanced against cumulative consumer price levels.
Analytical Summary: Wall Street vs. White House Context
Historical market analysis published by Morgan Stanley demonstrates that political leadership is only one of many variables driving long-term equity returns. Key takeaways for investors include:
- Policy vs. Fundamentals: Short-term market swings frequently respond to trade declarations, tariffs, and executive actions, but multi-year equity performance remains dictated by corporate earnings, cash flows, and monetary policy.
- Divided Government Advantages: Historically, markets under both Democratic and Republican presidents have posted above-average gains during periods of divided congressional control, which tends to limit radical fiscal shifts.
- Portfolio Discipline: Rebalancing asset allocations and maintaining broad sector diversification remains the primary protection against political and geopolitical market cycles.
What are your thoughts on the market’s response to recent trade policies? Share your perspective in the comments below, or check out our detailed breakdown of sector-by-sector performance in 2026.
Discover more from The Economy
Subscribe to get the latest posts sent to your email.
When the benchmark 10-year U.S. Treasury yield crosses the 5.0% threshold, financial markets undergo a structural paradigm shift. Far beyond a routine spike in borrowing costs, a 5% yield alters the hurdle rate for global capital, re-prices risk across every asset class, and exposes systemic sovereign debt fragilities.
1. The 5.0% Benchmark: Why the “Risk-Free” Rate Reshapes Equities
The 10-year U.S. Treasury note is the foundational anchor of global finance. Its yield represents the risk-free rate ($R_f$) utilized in the Capital Asset Pricing Model (CAPM) and Discounted Cash Flow (DCF) models worldwide.
When $R_f$ rises from 2%–3% to over 5%, the present value of future corporate earnings contracts exponentially.
$$\text{Present Value} = \sum_{t=1}^{n} \frac{CF_t}{(1 + WACC)^t}$$
As the Weighted Average Cost of Capital ($WACC$) climbs alongside Treasury yields:
- Growth Stocks & Big Tech: Long-duration growth equities—where the majority of projected cash flows sit far in the future—suffer the sharpest valuation multiple compressions.
- Equity Risk Premium (ERP) Squeeze: With risk-free Treasury bills yielding 5%, the additional premium required to hold volatile equities shrinks dramatically, prompting institutional capital to migrate from stocks to bonds.
- Corporate Liquidity Crunch: Corporate debt refinancing costs double or triple compared to pre-2022 issuance levels, directly eroding net profit margins reported to the U.S. Securities and Exchange Commission.
2. Macroeconomic Catalysts: What Is Driving the Bond Sell-Off?
The surge to 5%+ yields is driven by three primary structural forces rather than a single economic data point:
┌─────────────────────────────────────────────────────────────────────────┐
│                      DRIVER 1: FISCAL EXPANSION                         │
│  U.S. national debt interest + mandatory entitlement outlays now absorb │
│  ~98% of federal tax revenues (Source: U.S. Treasury Department).       │
└────────────────────────────────────┬────────────────────────────────────┘
                                     │
                                     ▼
┌─────────────────────────────────────────────────────────────────────────┐
│                     DRIVER 2: ISSUANCE MISMATCH                         │
│  84% of 12-month Treasury debt issuance concentrated in short-term T-   │
│  Bills, creating severe rollover sensitivity to rate hikes.             │
└────────────────────────────────────┬────────────────────────────────────┘
                                     │
                                     ▼
┌─────────────────────────────────────────────────────────────────────────┐
│                     DRIVER 3: CAPITAL COMPETITION                       │
│  Corporate AI CAPEX spending (~$700B–$900B/yr) competes with sovereign  │
│  bond issuance for global institutional capital reserves.               │
└─────────────────────────────────────────────────────────────────────────┘
Sovereign Debt & Supply Shock
As documented by the U.S. Department of the Treasury, massive fiscal deficit spending has accelerated net bond issuance. Because traditional central bank buyers engaged in quantitative tightening (QT) while foreign sovereign buyers reduced purchases, price discovery has shifted to price-sensitive private institutional investors who demand higher yields (term premium) to absorb debt supply.
Global Central Bank Tightening Synchronicity
Monetary policy decisions from the Federal Reserve System and global partners—such as the Bank of Japan raising interest rates—have reinforced elevated global rate floors. Official global debt perspectives from the International Monetary Fund highlight how high real yields strain emerging market borrowing capacity.
3. Sector Impact Analysis & Asset Class Vulnerabilities
| Asset Class / Sector | Impact Level | Primary Vulnerability / Opportunity |
| Mega-Cap Big Tech | Moderate to High | CAPEX borrowing costs rise; DCF discount rate expansion reduces forward P/E multiples. |
| Commercial & Residential Real Estate | Severe Headwind | Mortgage rates track 10-year yields; refinancing resets create valuation pressure. |
| Short-Term T-Bills & Money Market | Highly Favorable | Yields above 5% offer competitive risk-adjusted real returns without duration risk. |
| Hard Assets (Gold / Precious Metals) | Strategic Hedge | Fiscal deficit concerns and dollar devaluation risks enhance gold’s monetary status. |
| Asian & Emerging Market Equities | Selective Upside | Valuations in South Korea, Japan, and India trade at significant discounts relative to U.S. multiples. |
4. Tactical Asset Allocation Framework
Navigating a 5%+ Treasury yield environment requires balancing yield capture, capital preservation, and equity growth.
Core Portfolio Takeaways
- The Cash-Equivalent Shield: Allocating 35% to short-dated T-Bills mimics Warren Buffett’s liquidity strategy at Berkshire Hathaway, locking in 5%+ yields while preserving optionality for market corrections as reported by CNBC Markets.
- Selective Equity Quality: Focus equity exposure on companies with pristine balance sheets, low debt-to-equity ratios, and pricing power capable of outrunning inflation.
- Monetary Hedges: Gold and hard assets provide downside protection against potential currency weakness if central banks step in to cap bond yields through yield curve intervention. Further macroeconomic debt analysis is regularly updated by Bloomberg Markets and Reuters Financial News.
Discover more from The Economy
Subscribe to get the latest posts sent to your email.

Key Takeaways
- Rolex’s secondary market rose approximately 7.9% year-over-year as of 2026 (per WatchCharts data) — trailing Patek Philippe (+16.2%) and Tudor (+11.4%) but still outperforming Audemars Piguet (+3.4%).
- Rolex raised U.S. retail prices 4–9% in January 2026 (steel models ~5.6%, gold models ~8.7%), narrowing the historical gap between retail and pre-owned pricing.
- Not every model appreciates: steel sports references (Submariner, GMT-Master II, Daytona) have held value far better than two-tone or widely available dress references like the standard Datejust.
- The Lady-Datejust posted the sharpest 2026 gain among tracked collections — up 22.73%, from roughly $9,269 to $11,376 — driven by demand for smaller, “everyday luxury” watches.
- Gold’s rise past $2,400/oz has directly lifted the investment case for Rolex’s precious-metal references (Day-Date, Sky-Dweller, Yacht-Master).
The Model-by-Model Picture
| Category | 2026 Trend |
|---|---|
| Lady-Datejust | +22.73% (strongest performer among tracked collections) |
| Steel sports models (Submariner, GMT-Master II) | Held value well; corrected from 2022 peak but stabilized above retail |
| Daytona | Corrected from highs above $50,000 to the mid-$30,000s; still among the most sought-after references |
| Two-tone/widely available Datejust | Flat to negative — “holds value” is an overstatement for this category |
| Gold references (Day-Date, Sky-Dweller) | Lifted by gold’s rise above $2,400/oz |
Why the “Rolex Always Appreciates” Myth Is Fading
The pandemic-era boom pushed some references — the Daytona above all — to speculative highs disconnected from historical norms. Since the March 2022 peak, steel sports models have compressed meaningfully, and dealers who bought inventory near the top have in some cases faced 20–40% markdowns on liquidation. The lesson for 2026 buyers: Rolex as a category is not a monolith. Value retention depends heavily on specific reference, condition, and whether the piece comes with box and papers (“full set”).
What’s Actually Driving 2026 Strength
- Retail price increases raise the floor. When a new Submariner retails at $10,050 (up from $9,500), a pre-owned example at $11,000–$12,000 suddenly represents a smaller premium — narrowing the gap without secondary prices actually moving.
- Supply discipline remains Rolex’s core lever. The brand has never confirmed production numbers, and secondary-market premiums remain entirely a function of Rolex’s own manufacturing decisions — a risk factor as much as a support.
- Certified Pre-Owned rollout. Rolex’s now fully rolled-out CPO program has changed how buyers transact in the used market, adding a layer of brand-verified legitimacy that supports pricing.
The Case for Rolex as a Portfolio Diversifier
Financial advisors increasingly frame luxury watches not as a replacement for equities or bonds, but as a tangible, historically low-correlation diversifier — one that carries its own risks (illiquidity, condition-dependent pricing, no yield) but has demonstrated multi-decade resilience for specific references.
Is Rolex a good investment in 2026?
It depends heavily on the specific reference. Steel sports models like the Submariner and Daytona have held or grown in value; two-tone and widely available dress models generally have not. Overall, Rolex’s secondary market rose about 7.9% year-over-year in 2026, trailing Patek Philippe but ahead of Audemars Piguet.
Discover more from The Economy
Subscribe to get the latest posts sent to your email.

China Stocks vs. Japan Stocks: Where Should You Invest in Late 2026?

VIX Index Explained: How to Trade Wall Street’s Fear Gauge Today

Commercial vs Residential Real Estate: Which Wins in 2026?

Presidential Stock Market Performance: How Trump’s Second Term Compares to History

2026 Real Estate Market News: Are We Heading for a Correction?

Bitcoin Price Forecast 2026–2027: Will the 4-Year Cycle Hold?

Fidelity Crypto vs. Traditional Brokerages: A Guide for Modern Investors

The 2026 Global Smartphone Market: AI Integration and Competitor Analysis

SpaceX IPO: How Aerospace Is Reshaping Tech Startup News

Fidelity Investments Review: Maximizing Returns in a Volatile Stock Market

How Crypto Transformed the Trump Fortune: A $1.4 Billion Financial Breakdown

Global Pension Systems Ranked: The World’s Best and Worst Retirement Frameworks

Global Supply Chain Vulnerabilities: From Eurasian Trade Corridors to Food Consumer Recalls

Why 5% U.S. Treasury Yields Signal a Global Market Regime Shift.

US-China Relations in Q3 2026: Trade Tariffs and Supply Chain Risks

Top 30 Stocks for Investment in PSX for Massive ROI in 2026

SpaceX Starship Flight 14: First Orbital Attempt & Starlink V3 Launch Explained

The 2026 Crypto Regulatory Shift: What It Means for Institutional Investors

AI Chip Stocks 2026: The Best Semiconductor Investments Beyond Marvell

Tween Back-to-School Trends 2026: What’s Driving the $85B Season

AI-Powered Training: The Next Multi-Billion Dollar Ecosystem in Fitness

Oil Prices Break $100 in 2026: Middle East Conflict & Energy Markets

10-Year Treasury Yield Hits 4.80%: What It Means for Rates & Portfolios

Fidelity Investments Review 2026: SPAXX Yields & Zero-Fee Funds

BRICS+ Cross-Border Payments 2026: Interoperability Explained

Shein Clothes Quality & Safety in 2026: What Lab Tests Show

MRVL Earnings 2026: Why Marvell Sank Despite Beating Estimates

China’s US$10.8 Billion Trade Shortcut: Why the Pinglu Canal Matters
-

 Markets & Finance9 months ago
Top 15 Stocks for Investment in 2026 in PSX: Your Complete Guide to Pakistan’s Best Investment Opportunities
-

 Analysis7 months ago
Johor’s Investment Boom: The Hidden Costs Behind Malaysia’s Most Ambitious Economic Surge
-

 Analysis7 months ago
Top 10 Stocks for Investment in PSX for Quick Returns in 2026
-

 Analysis8 months ago
Brazil’s Rare Earth Race: US, EU, and China Compete for Critical Minerals as Tensions Rise
-

 Banks8 months ago
Best Investments in Pakistan 2026: Top 10 Low-Price Shares and Long-Term Picks for the PSX
-

 Investment8 months ago
Top 10 Mutual Fund Managers in Pakistan for Investment in 2026: A Comprehensive Guide for Optimal Returns
-

 Global Economy9 months ago
15 Most Lucrative Sectors for Investment in Pakistan: A 2025 Data-Driven Analysis
-

 Global Economy9 months ago
Pakistan’s Export Goldmine: 10 Game-Changing Markets Where Pakistani Businesses Are Winning Big in 2025