
Global Economy
15 Most Lucrative Sectors for Investment in Pakistan: A 2025 Data-Driven Analysis


While global investors chase saturated markets in established economies, Pakistan’s 240.49 million population presents a transformation that Goldman Sachs has quietly termed “the emerging market story of the decade”—yet 87% of international portfolios remain critically underexposed to this $350 billion economy poised at an inflection point.
The numbers tell a compelling story that contradicts mainstream narratives. Pakistan attracted $1.9 billion in FDI during fiscal year 2024, marking a 17% increase from the previous year, while the first seven months of FY25 saw FDI surge by 56% compared to the same period in FY24. But here’s what makes this moment historic: the convergence of demographic momentum, infrastructure maturity, and policy reforms is creating investment opportunities that won’t remain hidden much longer.
This analysis draws on institutional data from Pakistan’s Planning Commission, Ministry of Finance, State Bank of Pakistan, the IMF, World Bank, and Asian Development Bank to identify the 15 sectors where capital deployment offers the most attractive risk-adjusted returns through 2030.
Pakistan’s Economic Inflection Point: Understanding the 2025 Investment Landscape
The IMF projects Pakistan’s GDP growth at 2.7% for 2025 and 3.6% for 2026, but these headline figures mask profound sectoral dynamics. Inflation is expected to moderate to 4.5% in 2025, creating the most favorable monetary environment in five years for capital deployment.
Pakistan’s demographic dividend is perhaps its most underappreciated asset. With 65% of the population under 30 years old and agriculture employing half the labor force while contributing 24% to GDP, the economy is transitioning toward services and high-value manufacturing. The China-Pakistan Economic Corridor (CPEC) has already delivered $25 billion in infrastructure investments, with Phase II focusing on special economic zones and digital infrastructure that will unlock regional connectivity advantages.
The World Bank announced a $20 billion Country Partnership Framework with Pakistan, emphasizing clean energy and climate resilience projects, while the International Finance Corporation plans to invest up to $2 billion annually over the next decade. These institutional commitments signal a recalibration of Pakistan’s risk profile.
The Extended Fund Facility program with the IMF has driven critical reforms: currency stabilization, energy sector restructuring, and tax base expansion. For investors, this translates to improved repatriation conditions, reduced policy uncertainty, and a government increasingly aligned with market-oriented growth strategies.
Pakistan’s strategic geography positions it as the gateway between South Asia, Central Asia, and the Middle East. Gwadar Port’s operationalization creates a maritime trade corridor that reduces shipping costs for Central Asian republics by 40%, while road and rail networks connecting to China’s western provinces are transforming regional logistics economics.
THE 15 SECTORS: Where Smart Capital Finds Asymmetric Returns
1. Technology & IT Services: The $15 Billion Export Trajectory
Investment Thesis: Pakistan’s IT sector is experiencing explosive growth that few international investors have fully priced in.
Market Size & Growth: Pakistan’s IT and IT-enabled Services exports reached a record high of $3.8 billion in FY2024-25, while total IT, ITeS, and freelancers’ exports hit $4.6 billion for FY 2024-25, reflecting 26.4% growth. The government has set an ambitious but achievable target of $25 billion in IT exports by 2028.
Key Drivers: Zero income tax on IT exports until June 2025, 100% foreign ownership permitted, complete profit repatriation, and cost advantages where Pakistani developers charge 60-70% less than Western counterparts while delivering comparable quality. The United States accounts for 54.5% of Pakistan’s IT exports, but diversification into Gulf markets is accelerating rapidly.
Statistical Evidence: Monthly IT exports reached a historic high of $348 million in December 2024, up 28% year-over-year. Software services exports surpassed $1 billion for the first time in an 11-month period, showing 27.4% growth. The talent pipeline is robust, with over 300,000 IT graduates entering the workforce annually.
Opportunity Highlights: Software-as-a-Service (SaaS) startups, fintech platforms, blockchain development, artificial intelligence services, gaming development, and business process outsourcing. Pakistan hosted the first-ever Digital Foreign Direct Investment Forum, securing over $700 million in investment commitments. The upcoming Islamabad IT Park will provide state-of-the-art infrastructure for 10,000+ technology workers.
Risk Considerations: Internet reliability concerns and occasional policy uncertainty around VPN regulations require monitoring, though the government recognizes IT as a strategic growth sector.
Investment Entry Points: Direct stakes in Pakistani software houses, venture capital funds focused on Pakistani startups, partnerships with established firms like Systems Limited or TRG Pakistan, or real estate in technology parks.
2. Renewable Energy: The Solar Revolution Transforming Power Economics
Investment Thesis: Pakistan is experiencing the world’s fastest solar adoption rate, fundamentally restructuring energy economics.
Market Size & Growth: Pakistan imported 17GW of solar panel capacity in 2024, double the previous year’s imports, making it the world’s largest solar panel importer. The solar energy market is expected to grow from 6.75 gigawatts in 2025 to 15.5 gigawatts by 2030, representing an 18.09% compound annual growth rate.
Key Drivers: Electricity tariffs have doubled since 2021, creating powerful economic incentives for distributed solar. Between 2019 and 2025, cumulative solar panel imports surpassed Pakistan’s total installed power plant capacity by 2 gigawatts. Government targets call for 20% of electricity from renewables by 2025 and 30% by 2030.
Statistical Evidence: Net-metered rooftop solar reached 5.3 GW (5,300 MW) by end-April 2025, up from 2,500 MW a year earlier. Pakistan also imported an estimated 1.25 gigawatt-hours of lithium-ion battery packs in 2024, signaling the evolution toward solar-plus-storage solutions. Solar’s share of total electricity generation is expected to reach 1.6% in 2025, up from 0.7% in 2024.
Opportunity Highlights: Solar panel manufacturing and assembly (currently 90% imported from China), energy storage systems, solar farm development, agricultural solar pumps (with estimates that half of 1.5-2 million tube wells will switch to solar, adding 5.6-7.5 GW of capacity), and engineering, procurement, and construction (EPC) services. Wind energy presents complementary opportunities, with wind generation projected to reach 5,946 GWh in 2025.
Risk Considerations: Policy changes on net-metering tariffs could affect residential payback periods, though the economic fundamentals remain compelling given high grid electricity costs.
Investment Entry Points: Joint ventures with Chinese manufacturers for local assembly, solar farm development through PPIB, EPC contracting, or financing vehicles for commercial solar installations.

3. Agriculture & Agritech: Modernizing a $80 Billion Backbone
Investment Thesis: Agriculture contributes 24% to GDP and employs half the labor force, yet operates far below potential productivity due to outdated practices—creating massive modernization opportunities.
Market Size & Growth: The agriculture sector achieved 6.25% growth in FY2024, the highest in 19 years, driven by record wheat, rice, and cotton production. With 37.4% of employment in agriculture, productivity improvements translate directly to national GDP growth.
Key Drivers: State Bank of Pakistan allocated Rs 2,250 billion for agriculture lending in FY2024, 26.7% higher than the previous year. Climate-adaptive practices are essential following devastating 2022 floods that caused $12.9 billion in agricultural damages. Government focus on increasing oilseed and cotton production to reduce import dependence creates clear policy support.
Statistical Evidence: Wheat production reached 31.4 million tonnes in FY2024, up 11.6%, while cotton production surged 108.2% to 10.2 million bales after flood recovery. Livestock contributed 60.8% of agricultural value and grew 4.72% in FY2025, reflecting strong demand for dairy and meat products.
Opportunity Highlights: Precision agriculture technologies, drip irrigation systems, cold chain logistics, agricultural biotechnology, organic farming, livestock genetics improvement, dairy processing, and agricultural commodity trading platforms. CPEC agricultural cooperation includes technology transfer for disease-free zones, mechanization, and processing facilities.
Risk Considerations: Climate volatility remains a factor, with erratic rainfall patterns affecting crop yields. Land ownership disputes can complicate large-scale operations.
Investment Entry Points: Joint ventures in food processing, partnerships with agricultural universities for technology commercialization, or investment in agricultural finance institutions serving the unbanked rural population.
4. Textile & Apparel: Reclaiming the $25 Billion Export Vision
Investment Thesis: Textile exports rose 9.67% to $9.084 billion in the first half of FY25, with value-added segments driving growth as Pakistan capitalizes on Bangladesh’s manufacturing challenges.
Market Size & Growth: Pakistan’s textile exports reached $17.88 billion in FY2025, up 7.39%, with the sector representing 55.4% of total exports. Industry projections suggest $25 billion in annual textile exports is achievable with proper policy support.
Key Drivers: Political unrest in Bangladesh redirected export orders to Pakistan between December 2024 and March 2025, providing a window for Pakistani manufacturers to capture market share. Knitwear exports increased 15.47% and ready-made garments rose 17.52%, reflecting a strategic shift toward higher-value products.
Statistical Evidence: Textile exports in July-August FY2025 reached $2.92 billion, up 5.37% year-over-year. In 2024, textile exports increased by $1.3 billion compared to the previous year. The U.S. market accounts for $5 billion annually, representing 92% of Pakistan’s exports to America.
Opportunity Highlights: Vertical integration from spinning to garment manufacturing, technical textiles for automotive and industrial applications, sustainable fashion brands, and man-made fiber production. Cotton yarn faces challenges, but finished garments show strong momentum.
Risk Considerations: U.S. tariff policies could impact competitiveness, with President Trump’s tariffs potentially reducing exports by 20-25%. Energy costs and removal of zero-rating for local inputs pose cost pressures.
Investment Entry Points: Partnerships with established textile groups, investments in specialized segments like denim or home textiles, or development of export-oriented manufacturing facilities in special economic zones.
5. Construction & Real Estate: Urbanization’s $40 Billion Opportunity
Investment Thesis: With 65% of the population under 30 and rapid urbanization, Pakistan faces a housing shortage of 10 million units, creating sustained demand for decades.
Market Size & Growth: The construction sector contributes approximately 2.5% to GDP directly, with multiplier effects across 40+ allied industries. Government low-cost housing initiatives aim to deliver 500,000 units annually, while commercial real estate in Karachi, Lahore, and Islamabad shows 12-15% annual appreciation.
Key Drivers: State Bank of Pakistan’s construction financing schemes offer subsidized mortgages. Special Economic Zones under CPEC require industrial parks, warehousing, and worker housing. Tax incentives for construction materials and documented property transactions are improving sector transparency.
Statistical Evidence: Cement dispatches—a leading indicator—grew 8% in FY2024, reaching 52 million tonnes. Mortgage financing increased 35% year-over-year, though penetration remains below 0.3% of GDP, suggesting massive growth potential.
Opportunity Highlights: Affordable housing projects targeting middle-income families, commercial office spaces in metropolitan areas, hospitality infrastructure for tourism, logistics parks near CPEC routes, and Build-Operate-Transfer (BOT) infrastructure projects.
Risk Considerations: Property registration complexities and uneven documentation standards require thorough legal due diligence. Currency volatility affects imported construction materials.
Investment Entry Points: Real Estate Investment Trusts (REITs) are emerging, joint ventures with established developers, or direct land banking in areas designated for future development.
6. Healthcare & Pharmaceuticals: Serving 240 Million Lives
Investment Thesis: Pakistan’s healthcare expenditure is only 2.8% of GDP—far below the World Health Organization’s 5% recommendation—creating structural growth as incomes rise and health awareness increases.
Market Size & Growth: The pharmaceutical market is valued at $4.2 billion, growing 12-15% annually. With a doctor-to-patient ratio of 1:1,300 (WHO recommends 1:1,000), healthcare infrastructure expansion is inevitable.
Key Drivers: Rising middle class with health insurance coverage expanding, government’s push for Universal Health Coverage, COVID-19’s lasting impact on health consciousness, and pharmaceutical export potential to Africa and Central Asia.
Statistical Evidence: Pharmaceutical production increased 6.8% in FY2024, with local manufacturers meeting 70% of domestic demand. Medical device imports grew 15% annually, indicating market expansion. Private hospital chains are expanding bed capacity by 20% year-over-year in major cities.
Opportunity Highlights: Diagnostic laboratories, specialty hospitals (cardiac, orthopedic, oncology), telemedicine platforms, pharmaceutical manufacturing under licensing agreements, medical tourism targeting diaspora and regional patients, and health insurance platforms.
Risk Considerations: Price controls on essential medicines can compress margins. Regulatory approval processes require navigation with experienced local partners.
Investment Entry Points: Partnerships with hospital chains like Shaukat Khanum or Aga Khan University Hospital, pharmaceutical contract manufacturing, or diagnostic center franchises.
7. Financial Services: Banking the Unbanked Majority
Investment Thesis: Only 21% of Pakistani adults have bank accounts, while 53% have mobile phone connections—creating a massive fintech opportunity to leapfrog traditional banking.
Market Size & Growth: The banking sector holds assets of $180 billion, with Islamic banking growing at 20% annually and now comprising 22% of total banking assets. Digital payments grew 47% in FY2024.
Key Drivers: State Bank of Pakistan’s Digital Pakistan initiative, mandatory digital payments for government transactions, and branchless banking regulations. Remittances—$29.4 billion in fiscal year 2021—create demand for efficient money transfer solutions.
Statistical Evidence: Mobile wallet accounts surged to 120 million, with transaction values increasing 65% year-over-year. Credit card penetration remains below 2%, indicating massive potential. Microfinance institutions serve only 9 million borrowers against a target market of 40 million.
Opportunity Highlights: Digital payment gateways, peer-to-peer lending platforms, microfinance banks, Islamic finance products, insurance technology (insurtech), credit scoring using alternative data, and embedded finance solutions for e-commerce.
Risk Considerations: Cybersecurity infrastructure is developing but requires investment. Regulatory compliance for fintech startups demands careful attention.
Investment Entry Points: Equity stakes in fintech startups, partnerships with commercial banks for digital transformation, or microfinance bank investments serving underbanked segments.
8. Mining & Minerals: Unlocking $6 Trillion in Untapped Resources
Investment Thesis: Pakistan possesses world-class mineral deposits—including the Reko Diq copper-gold project valued at over $60 billion—that remain largely unexploited due to historical policy constraints now being resolved.
Market Size & Growth: Estimated mineral reserves total $6 trillion, yet mining contributes only 2.8% to GDP. Reko Diq alone will produce 200,000 tonnes of copper and 250,000 ounces of gold annually at full capacity.
Key Drivers: Saudi Arabia is considering acquiring a 10-20% stake in the Reko Diq project, validating the sector’s potential. New mining policies offer tax holidays, streamlined approvals, and guaranteed repatriation. Global energy transition increases demand for copper, lithium, and rare earth elements found in Pakistan.
Statistical Evidence: Coal reserves exceed 185 billion tonnes, primarily in Thar, where mining has commenced with power generation capacity of 1,320 MW operational. Cement industry consumes 45 million tonnes of limestone annually, supporting sustainable extraction. Gemstone exports (emeralds, rubies) reached $15 million in FY2024 with informal sector much larger.
Opportunity Highlights: Reko Diq copper-gold complex (Balochistan), Thar coal integrated mining and power projects, marble and granite extraction for export, rare earth element exploration, and mineral processing facilities near extraction sites.
Risk Considerations: Balochistan’s security situation requires robust risk management. Infrastructure connectivity to mines needs investment. Environmental permits demand comprehensive compliance.
Investment Entry Points: Joint ventures with government entities like Balochistan Minerals, equipment leasing to mining operators, or downstream mineral processing facilities.
9. Logistics & Transportation: Moving Goods Across Trade Corridors
Investment Thesis: Pakistan’s location at the intersection of $3 trillion in annual trade routes creates logistics demand that current infrastructure cannot meet, with e-commerce growth adding urgent capacity needs.
Market Size & Growth: Logistics costs represent 18-20% of GDP (versus 10-12% in developed economies), indicating massive efficiency gains possible. E-commerce penetration below 2% is growing at 40% annually, requiring supporting logistics.
Key Drivers: Gwadar Port operationalization, CPEC transport corridors, government’s push to increase railway freight share from 4% to 20% by 2030, and cold chain requirements for agricultural exports.
Statistical Evidence: Container traffic at Karachi Port grew 7% in FY2024, reaching 2.6 million TEUs. Road freight dominates 96% of cargo movement, but railway infrastructure investments of $8 billion are underway. Warehousing space in major cities commands 15-20% annual rental yields.
Opportunity Highlights: Cold chain facilities for agricultural products, last-mile delivery solutions for e-commerce, third-party logistics (3PL) providers, inter-city freight services, warehousing near ports and borders, and technology platforms for load optimization.
Risk Considerations: Road infrastructure quality varies significantly by region. Regulatory differences between provinces complicate inter-provincial operations.
Investment Entry Points: Partnerships with logistics companies like TCS or Leopard Courier, warehouse development in industrial estates, or specialized cold storage facilities.
10. Tourism & Hospitality: Rediscovering the ‘Switzerland of Asia’
Investment Thesis: Northern Pakistan’s mountain landscapes rival Switzerland’s beauty at 10% of the cost, while religious tourism (especially to Sikh and Sufi sites) creates year-round demand—yet hospitality infrastructure is severely underdeveloped.
Market Size & Growth: Tourism contributes only 5.9% to GDP (versus 10.4% in comparable economies), with 1.1 million international arrivals in 2024 (pre-pandemic levels were 1.9 million). Domestic tourism is booming, with 60 million domestic tourists annually.
Key Drivers: Government’s visa-on-arrival for 50 countries, marketing campaigns showcasing Pakistan’s beauty, improved security perceptions, and UNESCO World Heritage sites (6 total) gaining recognition. K2 base camp treks command $5,000+ per tourist, while Hunza and Skardu are becoming Instagram-famous destinations.
Statistical Evidence: Hotel occupancy in Gilgit-Baltistan reached 85% during summer 2024, with rates increasing 30% year-over-year. Religious tourism to Kartarpur Corridor (for Sikhs) exceeded 3 million visitors since opening. Adventure tourism revenue in northern areas grew 45% in FY2024.
Opportunity Highlights: Boutique hotels in scenic locations, adventure tourism operators (trekking, mountaineering, rafting), religious tourism facilities, eco-lodges, heritage site restoration with commercial operations, and travel technology platforms connecting tourists with verified services.
Risk Considerations: Seasonal demand concentration in summer months (May-October) requires business model adaptations. International perceptions of security, though improving, require proactive management.
Investment Entry Points: Hotel development in underserved tourist areas, partnerships with provincial tourism departments, or acquisition of heritage properties for restoration and operation.
11. Education Technology: Bridging the Skills Gap
Investment Thesis: With 26 million children out of school and a youth bulge requiring vocational training, education technology offers scalable solutions to Pakistan’s human capital challenge.
Market Size & Growth: The education sector is valued at $9 billion, growing 8% annually. Online education penetration accelerated during COVID-19 but remains below 5% of the market, suggesting massive headroom.
Key Drivers: Government partnerships for digital classrooms, corporate demand for skilled workers in IT and manufacturing, and parental willingness to invest in children’s education even in low-income segments. 4G coverage reaching 80% of population enables mobile-first learning.
Statistical Evidence: EdTech startups raised $28 million in venture funding in 2024, with platform enrollments growing 120% year-over-year. Vocational training market is valued at $600 million, with government allocating $100 million for skills development programs. Test preparation market (for MDCAT, ECAT, CSS, etc.) exceeds $200 million annually.
Opportunity Highlights: Online K-12 education platforms, vocational training in high-demand skills (coding, digital marketing, design), test preparation services, corporate training solutions, learning management systems for schools, and AI-powered personalized learning apps.
Risk Considerations: Payment collection from consumer segments requires robust systems. Content localization in Urdu and regional languages is essential for mass market penetration.
Investment Entry Points: Venture capital investments in promising EdTech startups, partnerships with educational institutions for technology deployment, or franchise models for test preparation centers.
12. Automotive & Electric Vehicle Manufacturing: Electrifying Mobility
Investment Thesis: Pakistan assembles 250,000 vehicles annually in a market dominated by three players, while EV adoption is emerging with government incentives—creating disruption opportunities for new entrants.
Market Size & Growth: Automotive sector contributes 4% to GDP and employs 3.5 million people directly and indirectly. Local assembly saves 30-40% versus full imports through tariff structures designed to encourage localization.
Key Drivers: Government’s EV policy offers 5-year tax holidays, lower duties on EV imports, and mandates for charging infrastructure. Rickshaws and motorcycles (5 million units annually) are prime electrification targets. Rising fuel costs (petrol at PKR 280/liter) make EVs economically attractive.
Statistical Evidence: Two-wheeler production reached 2.3 million units in FY2024, while car production was 190,000 units. Chinese brands (MG, Chery, BYD) are entering with competitive EVs. Motorcycle electrification pilot programs in Lahore and Karachi show 65% cost savings versus gasoline.
Opportunity Highlights: EV assembly plants through joint ventures, charging infrastructure networks, battery manufacturing and recycling, auto parts localization (currently 60% imported), and conversion kits for existing vehicles to electric/CNG.
Risk Considerations: Currency volatility affects CKD (completely knocked down) import costs. Consumer preference for established Japanese brands requires brand-building investment.
Investment Entry Points: Joint ventures with Chinese EV manufacturers, dealership networks for new brands, or specialized EV components manufacturing.
13. Food Processing & FMCG: Feeding a Nation of 240 Million
Investment Thesis: Post-harvest losses exceed 30% of agricultural production due to inadequate processing and storage, while packaged food penetration remains low—creating a $15 billion processing opportunity.
Market Size & Growth: FMCG market valued at $22 billion, growing 10% annually as urbanization and modern retail expand. Food processing contributes 2% to GDP versus 8-10% in comparable economies, indicating structural growth potential.
Key Drivers: Rising disposable incomes, nuclear family structures preferring convenience foods, halal certification providing export access to 1.8 billion Muslim consumers globally, and cold chain development enabling perishables handling.
Statistical Evidence: Packaged milk penetration reached 52% (from 3% in 2000), proving scalability of organized processing. Dairy exports to Afghanistan and Central Asia grew 18% in FY2024. Snack foods market expanded 15%, with local players like Kolson and Ismail Industries competing effectively.
Opportunity Highlights: Dairy processing for domestic and export markets, meat processing with halal certification, fruit and vegetable processing for export, snack foods for growing middle class, and organic food products targeting premium segments.
Risk Considerations: Raw material price volatility affects margins. Working capital requirements for agricultural sourcing need careful management.
Investment Entry Points: Partnerships with agricultural cooperatives for reliable sourcing, acquisition of existing brands, or greenfield processing facilities near production areas.
14. Telecommunications & 5G Infrastructure: Connecting Digital Pakistan
Investment Thesis: Mobile penetration exceeds 90%, but data usage is exploding as Pakistan transitions from 3G/4G to 5G, requiring infrastructure investments of $8 billion through 2030.
Market Size & Growth: Telecom sector generates $3.8 billion in annual revenue, with cellular companies investing $800 million annually in network expansion. Data revenue now represents 45% of operator revenue, up from 25% five years ago.
Key Drivers: 5G spectrum auctions scheduled for 2025, government’s smart city initiatives requiring connectivity, IoT applications for agriculture and logistics, and content streaming demand. Average data consumption per user doubled to 12GB/month in 2024.
Statistical Evidence: Pakistan has 196 million cellular subscribers with 122 million using mobile broadband. Fiber-to-the-home coverage reached 2.8 million connections, growing 40% year-over-year. Telecom sector contributed $4.5 billion to national exchequer in FY2024.
Opportunity Highlights: Tower infrastructure sharing models, 5G equipment deployment, fiber optic network expansion, data center facilities, content delivery networks, and telecom tower real estate investment trusts.
Risk Considerations: Regulatory environment includes high taxation on telecom services. License fee structures require monitoring.
Investment Entry Points: Infrastructure-sharing partnerships with operators, data center development for cloud services, or specialized 5G applications for industrial clients.
15. Chemical & Petrochemical Industry: Building Industrial Foundation
Investment Thesis: Pakistan imports $4 billion in chemicals annually while possessing feedstock advantages in natural gas—creating import substitution opportunities worth billions.
Market Size & Growth: Chemical sector contributes 1.2% to GDP, valued at $4.2 billion, with fertilizer production being largest segment. Plastics and polymer demand grows at 8% annually, driven by packaging and construction.
Key Drivers: Government’s policy to encourage downstream industries under CPEC special economic zones, guaranteed gas supply to priority industries, and rising agricultural demand for fertilizers and crop protection chemicals.
Statistical Evidence: Urea production reached 6.2 million tonnes in FY2024, with Pakistan largely self-sufficient. Phosphate fertilizer (DAP) production is expanding with new plants adding 1.2 million tonnes capacity. Plastics consumption per capita is only 11 kg (versus 45 kg in India), indicating growth runway.
Opportunity Highlights: Specialty chemicals for agriculture, plastics and polymer production, fertilizer manufacturing with gas-based feedstock, pharmaceutical intermediates, and petrochemical refining with value addition.
Risk Considerations: Natural gas pricing policies can impact feedstock economics. Environmental regulations on chemical manufacturing are tightening.
Investment Entry Points: Joint ventures in special economic zones with gas supply guarantees, partnerships with engineering firms for plant setup, or distribution networks for imported specialty chemicals.
Navigating Pakistan’s Investment Frontier: Strategic Takeaways
Pakistan’s investment narrative in 2025 is fundamentally different from the crisis-dominated years that preceded it. The convergence of structural reforms, demographic momentum, and strategic geography creates a rare alignment of factors that sophisticated investors recognize.
Seven Strategic Recommendations for Investors:
- Start with Sectors Showing Demonstrated Momentum: IT services, solar energy, and textile value-addition are already delivering returns and provide lower-risk entry points before moving to emerging opportunities.
- Leverage Government Policy Alignment: Sectors receiving explicit government support through Special Investment Facilitation Council—including IT, agriculture, mining, and EVs—benefit from bureaucratic streamlining.
- Partner with Established Local Players: Pakistan’s business ecosystem rewards relationships. Joint ventures with respected groups provide market access, regulatory navigation, and operational expertise.
- Build Repatriation Strategies from Day One: While regulations permit 100% profit repatriation, practical implementation requires banking relationships and documentation. Structure this proactively.
- Diversify Geographic Exposure: Punjab dominates economic activity, but opportunities in Sindh’s ports, Khyber Pakhtunkhwa’s minerals and tourism, and Balochistan’s natural resources offer higher-risk, higher-return profiles.
- Plan for Long-Term Capital Deployment: Pakistan rewards patient capital. Three-to-five-year horizons capture market development cycles better than short-term trading approaches.
- Monitor Political Economy Closely: IMF program compliance, U.S.-Pakistan trade relations, and China’s CPEC commitments significantly impact investment climate. Maintain scenario planning for policy shifts.
Risk Mitigation Framework:
Currency hedging through natural hedging (export-linked revenues), political risk insurance from multilateral agencies, diversified stakeholder engagement, and robust governance structures minimize downside exposure while capturing upside potential.
Three-Year Outlook: By 2028, successful investors will have established market positions in sectors transitioning from fragmented to organized. IT sector could realistically reach $12-15 billion in exports, solar installations could exceed 25 GW total capacity, and textile exports could approach the $25 billion target if tariff negotiations succeed.
Ten-Year Outlook: Pakistan’s economy could reasonably reach $500 billion by 2035 if current reform trajectories persist. Population exceeding 260 million, with median age of 25, creates consumer demand comparable to Indonesia’s growth in the 2000s. Infrastructure investments under CPEC Phase II unlock connectivity premiums in logistics, manufacturing, and services.
The question for institutional investors is not whether Pakistan presents opportunities—the data confirms it does—but rather which sectors align with their risk appetite, time horizons, and operational capabilities. The early movers who establish positions now, while valuations remain attractive and competition is manageable, will capture asymmetric returns as Pakistan’s economy matures over the coming decade.
For investor inquiries and detailed sector analysis reports, contact the Pakistan Board of Investment at invest.gov.pk or explore opportunities through the Special Investment Facilitation Council (SIFC).
Data Sources: Planning Commission of Pakistan (pc.gov.pk), Ministry of Finance (finance.gov.pk), Board of Investment Pakistan
Disclaimer: This analysis is for informational purposes only and does not constitute investment advice. Prospective investors should conduct thorough due diligence and consult with financial advisors before making investment decisions.
Discover more from The Economy
Subscribe to get the latest posts sent to your email.


7-Eleven, Circle K, and Casey’s lead US convenience retail by store count. See how EV charging is spreading across the top chains and where fuel sales stand.
Key Takeaways
- The US had 151,975 convenience stores at the end of 2025, down 280 from the year before, according to NACS and NIQ TDLinx.
- 7-Eleven is the largest chain by store count, with about 12,700 US locations on CSP’s January 2026 ranking. Circle K, Casey’s, and Murphy USA follow.
- Fuel is still the core. Convenience stores sell about 80% of the gasoline bought in the US, and 122,620 stores now sell fuel, the highest number in eight years.
- EV charging remains thin. Wawa and Sheetz have chargers at 11% to 30% of their sites in a Consumer Reports sample, while the two largest chains have added chargers to less than 1% of their stores.
- Most chains are partnering with charging networks rather than building their own, and that model is shifting as 7-Eleven, Circle K, and Wawa take on more ownership.
Search Intent Summary
Readers searching this topic want to know which convenience chains are biggest, how they compare, and whether they’re investing in EV charging. This guide ranks the top chains by store count, explains the EV strategies, and covers the sales and fuel context.
How Market Share Is Measured
Market share in convenience retail can be measured several ways: by store count, by fuel gallons, or by in-store sales dollars. Public data is strongest on store counts, so this ranking uses store counts. Dollar-share estimates are sold by market research firms, and I did not verify figures that would support a revenue-based ranking.
Different sources also count stores differently. CSP’s Top 202 uses stores owned, operated, or franchised as of January 1, 2026. The NACS/NIQ TDLinx count is a separate industry tally. For Circle K, CSP lists 7,308 stores, while the NACS count lists 6,038 locations, so the figures should not be combined or compared directly across sources.
The Largest Chains by Store Count
On CSP’s 2026 Top 202, the leaders are:
- 7-Eleven: about 12,700 stores, the largest chain in the industry
- Alimentation Couche-Tard (Circle K): 7,308 stores under CSP’s count, the second-largest
- Casey’s General Stores: 2,921 stores, concentrated in the Midwest
- Murphy USA: 1,800 stores, a major fuel-focused operator
- bp America: 1,708 stores
- EG America: 1,464 stores
- QuikTrip: 1,196 stores, a Southern and Midwestern chain
- Wawa: 1,189 stores, a Mid-Atlantic favorite
- ExtraMile: 1,174 stores
- GPM Investments: 1,118 stores
Kwik Trip (919), Maverik (818), Sheetz (815), Love’s Travel Stops (668), and Pilot (658) round out the next tier. The threshold for the top 100 in 2025 was 67 stores, which shows how concentrated the market is at the top.
Store counts shifted in 2025 mostly through acquisitions. Circle K’s gain came largely from finishing its purchase of GetGo Café and Market, formerly owned by Giant Eagle. Sunoco’s $9.1 billion acquisition of Parkland Corp. also reshaped the rankings.
Fuel Sales Remain the Core Business
Convenience stores are, first and foremost, fuel retailers. NACS estimates that the industry sells about 80% of the gasoline purchased by consumers in the US, and the number of stores selling fuel rose by 768 in 2025 to 122,620, the highest count in eight years. Overall, 80.7% of convenience stores sell fuel.
That mix matters for margins and for the strategy of the largest chains. Fuel brings traffic, and inside sales, especially food service and tobacco, bring profit. NACS reported the industry generated $837.4 billion in sales in 2024, driven largely by foodservice. Industry-wide 2025 sales were scheduled for release at the NACS summit in April 2026, and readers should check the NACS site for the latest figure.
Gasoline price swings affect this business directly. National average prices reached $4.41 on October 1, 2026, according to AAA, which means fuel margins and foot traffic move with crude oil headlines.
EV Charging: Who Is Investing and How
Convenience stores have become a major location for public charging, but coverage is still limited. A Consumer Reports study of 75 major retailers, covering 11 convenience-store companies, found that Wawa and Sheetz had EV chargers at between 11% and 30% of their locations, averaging six to ten fast chargers per site. Royal Farms was similar. The remaining chains averaged between two and five chargers per site.
Across the sample, only 1.4% of convenience stores offered EV charging. The study noted that c-stores are the only retail category where nearly all chargers are fast chargers, which is a good fit for a quick stop but expensive to install.
The two largest chains are taking a different approach. 7-Eleven launched its own 7Charge network and app, with a stated goal of building one of the largest fast-charging networks of any retailer in North America. Circle K has partnered with IONNA, an EV charging company backed by eight automakers, to add chargers at 350 US stores, including converting about 85 existing charging sites. Neither 7-Eleven nor Circle K had chargers at more than 1% of their stores in the Consumer Reports sample.
Other chains are moving in similar directions. Casey’s is installing IONNA chargers at several locations in six states, with plans to expand the partnership. Sheetz and Wawa also partner with IONNA. Wawa announced in September 2026 that it would install eight branded DC fast chargers in Pennsylvania through a partnership with Electrify America, its first move into owning and operating its own charging equipment rather than hosting third-party chargers. Wawa has operated EV charging at more than 280 locations since 2017.
The model matters for shoppers. Partnerships usually mean the charging company runs the equipment and handles payment, while the store provides the site and drives traffic. Chains that own their chargers get more control over pricing and reliability, but they also take on the cost and risk.
Customer Satisfaction Rankings
Store counts and charging networks are only part of the picture. The American Customer Satisfaction Index’s 2026 convenience store study, released October 6, ranked Meijer first, followed by QuikTrip in second and a tie for third between Wawa and Sheetz. The survey asked 9,465 consumers to score chains on factors including store hours, coffee freshness, bathroom cleanliness, food quality, wait times, and app usability.
Overall satisfaction fell 1% to 75 points, and store layout and cleanliness dropped 3%. Wawa led in the South and Northeast regions in the survey. The findings suggest that growth in food service and digital offerings is not yet translating into higher satisfaction across the industry.
Practical Guidance for Shoppers and Investors
For drivers choosing a chain, the EV question depends on where you travel. If you drive an electric vehicle, check the chain’s charging network and app before a long trip. Many chargers are partnership sites with different payment systems, so confirm the plug type and fees in advance.
For fuel shoppers, the fuel-selling store count is a good sign of supply, but prices vary by brand and region. Compare the station’s posted price with the AAA state average before you fill up.
For investors and industry watchers, the key questions are whether chains can grow charging in high-traffic locations without pressuring margins, and whether the largest chains will move from partnership models to owned networks.
Future Outlook
Store counts are roughly flat, with growth coming from acquisitions and new formats rather than from a rapid expansion of the total store base. EV charging is growing from a small base, and the chains that build dependable fast-charging networks may gain traffic from drivers who need a quick stop. Fuel price volatility will continue to shape the economics of the whole sector.
Frequently Asked Questions
Which convenience store chain is the largest in the US?
7-Eleven is the largest by store count, with about 12,700 US stores on CSP’s January 2026 ranking. Circle K is second, although counts differ by data source.
Which convenience stores have the most EV chargers?
Wawa and Sheetz had chargers at 11% to 30% of their locations in the Consumer Reports sample, with six to ten fast chargers per site on average. 7-Eleven and Circle K have expanded their charging networks but had chargers at less than 1% of their stores in that sample.
How many convenience stores are there in the US?
The NACS/NIQ TDLinx count put the total at 151,975 at the end of 2025, down 280 stores from the year before. About 63% of stores are owned by companies with ten or fewer locations.
Do convenience stores sell most of the gas in the US?
NACS estimates convenience stores sell about 80% of the gasoline purchased by consumers in the US. Fuel is the core product for most chains, even as inside sales and food service grow.
Discover more from The Economy
Subscribe to get the latest posts sent to your email.
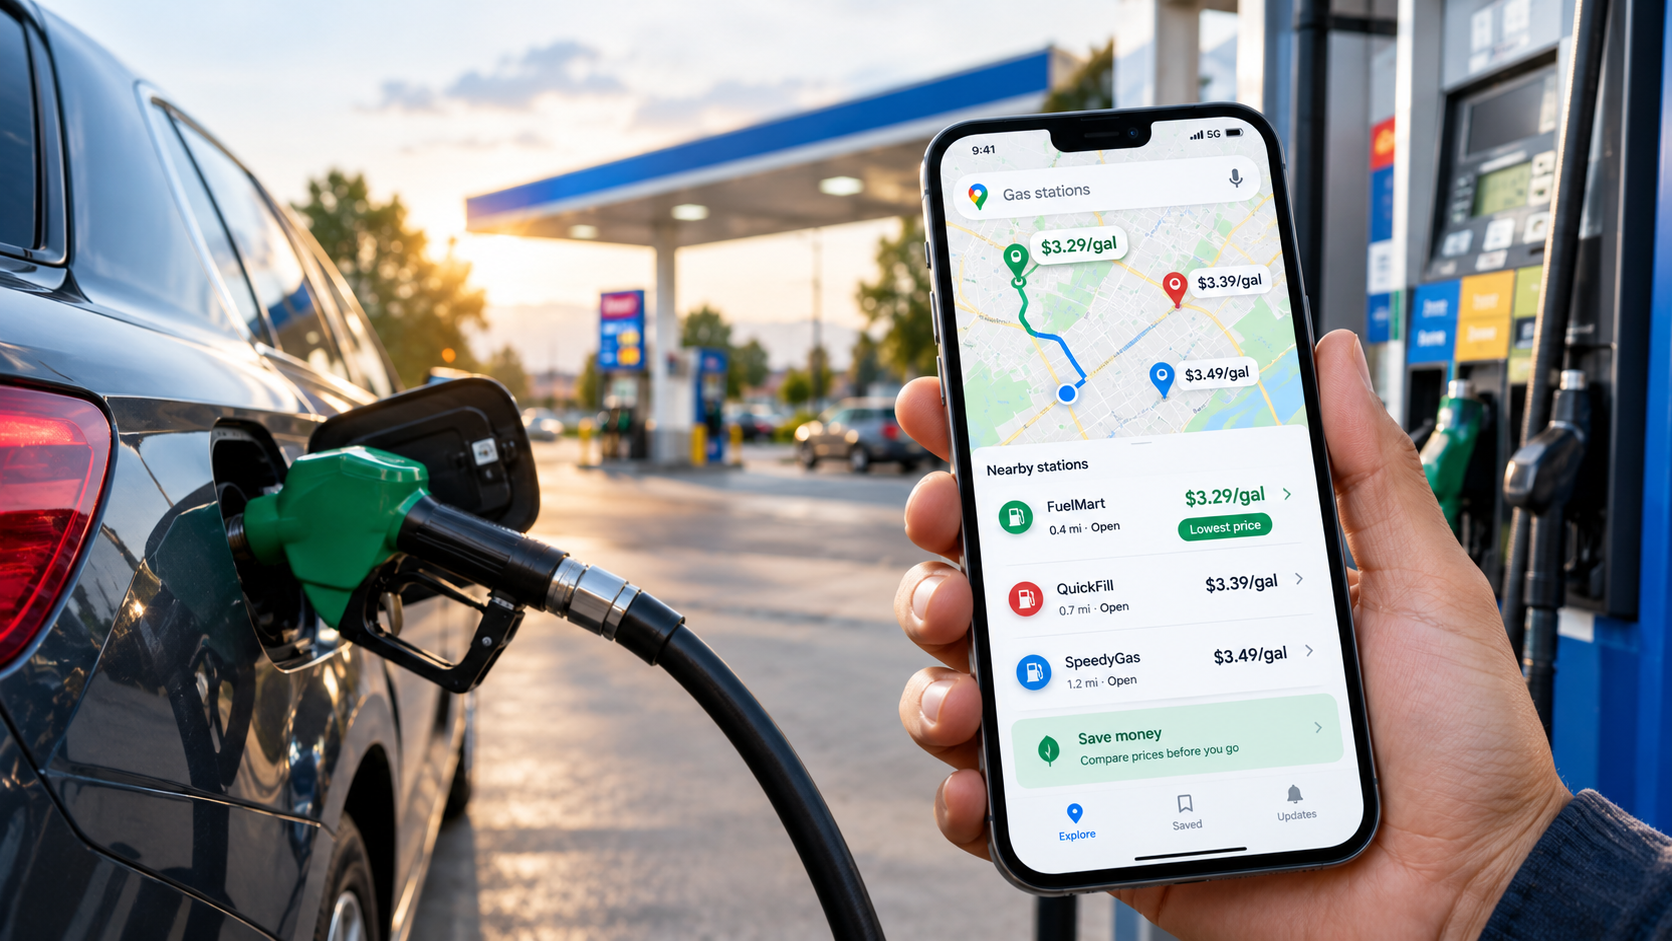
Google Maps shows gas prices at nearby stations, but its data isn’t truly real-time. Here’s how to use the feature, check accuracy, and cut fuel costs.
Key Takeaways
- Google Maps lists gas prices for nearby stations on Android, iOS, and desktop. Tap the gas option, or search “gas” in the search bar.
- Prices come from Google, not from drivers. Users cannot edit them, so accuracy depends on how quickly stations’ prices reach Google.
- Google says its fuel data is updated every 24 hours, so it cannot show the price at a pump at this moment.
- The US national average was $4.41 a gallon on October 1, 2026, according to AAA, up from $3.16 a year earlier. Savings matter more now than they did a year ago.
- Combine the map with AAA’s price tracker and the eco-friendly route setting to find cheaper fill-ups and trips.
Search Intent Summary
People searching this topic want to find the cheapest gas nearby and to know whether the prices they see are trustworthy. This guide shows how the feature works, where its data comes from, and how to use it alongside other sources.
A Note on “Real-Time” Fuel Prices
The phrase “real-time” overstates what Google Maps offers. Google’s Maps prices are shown by Google and are not user-editable. A reviewer testing the feature in 2025 found that major brands such as BP, Shell, and Speedway matched GasBuddy and the stations’ own prices, but some stations updated slowly, especially for grades other than regular, and some stations showed no prices at all.
A Google spokesperson also told a local TV station that the app’s data is updated every 24 hours. Prices can therefore lag behind what a station posts on its sign, and a price shown in the morning may be out of date by afternoon. Treat the map as a comparison tool for finding the cheaper area, then confirm the price at the pump.
How to Find Gas Prices on Your Phone
On Android and iOS, open Google Maps and tap the gas tile under the search bar. The app will show stations near you. Tap a station to see its details, including the listed price.
To look farther away, move the map to a new area and tap “Search this area.” Not every station displays a price, so you may need to scroll through the list. Tapping “View list” lets you compare several stations at once, which is faster than checking pins one by one.
If you already know which station you want, search for its name and tap its listing. The price appears in the station’s details, and you can see how far it is from your location.
How to Find Gas Prices on Desktop
On desktop, search for “gas” or “gas stations near me.” The station icons appear on the map, but prices are not always displayed next to the pins. Click a station to open its information panel, where the price is shown.
Desktop is useful for planning. If you are leaving for a trip, search the destination town or your route’s stops before you leave, so you can decide where to fill up.
Comparing Prices Without Getting Fooled
A cheap-looking price can still cost you more if the station is out of your way. Before choosing a station, check three things.
Distance matters. A five-cent saving on a station two miles away may not be worth the detour. Work out the difference on your tank size: a $0.20 gap on a 15-gallon fill-up is $3.00, which may or may not cover the extra driving.
Grade matters. Some stations show prices for regular only. Premium or diesel prices may be missing or slower to update.
Timing matters. Prices often change through the day, and stations may raise prices after a wholesale increase. Check the map in the morning, then confirm at the pump.
Cross-Check With Trusted Sources
For a reliable benchmark, check the AAA gas price tracker, which publishes daily national and state averages. On October 1, 2026, AAA reported a national average of $4.41 for regular unleaded, down about 7 cents from the previous week. September’s monthly average of $4.33 was the highest September figure on record. AAA attributed the easing to crude oil prices dipping back into the $90 range.
The Energy Information Administration publishes weekly retail gasoline prices, which are useful for tracking longer trends. A station’s price is best confirmed at the station itself, but these sources tell you whether the price you are seeing is high or low for your area.
Crowd-sourced apps such as GasBuddy can add station-level detail, but their data is user-submitted, so compare it against Google Maps and the station’s sign.
Use the Eco Route to Cut Fuel Use
Fuel costs depend on how much you burn, not just what you pay per gallon. Google Maps offers an eco-friendly route option that favors more fuel-efficient driving. The eco option is on by default for many users, so check that it is still enabled before you plan a trip.
Google has said that a fuel-efficient route typically adds one to two minutes to a trip and can save five to ten percent on gas. The savings depend on traffic, road type, and the vehicle, so treat the figure as an estimate.
A simple example shows the scale. Suppose a 300-mile trip in a car that gets 25 miles per gallon. That uses 12 gallons, or about $53 at $4.41 a gallon. A 5 to 10 percent saving is roughly $2.65 to $5.30. Those are hypothetical numbers, but they show that a short detour and a route change can add up across a year of driving.
Practical Strategy for Saving on Gas
Start with the map to find the cheapest station in your area. Confirm the price with the station’s sign before filling up, since the map can lag behind changes.
Compare prices in clusters rather than single stations. If several stations near a highway interchange charge less than the rest, that is a stronger signal than one outlier.
Use the eco route on longer trips, and avoid detours that cost more in fuel than they save at the pump. For a regular commute, the cheapest station on your route is often the best choice.
Keep an eye on the AAA and EIA averages. If your local price is well above the national average, you may be able to save by filling up at a station in a different city or zone.
Future Outlook
Gas prices are tied to crude oil, and crude is tied to the conflict affecting shipping routes in the Middle East. Prices have risen sharply this year, and they have also eased at times. The most useful habit is checking prices regularly rather than waiting for a spike to appear, since station prices can move quickly in both directions.
Frequently Asked Questions
Is Google Maps gas price data real-time?
No. Google says its fuel data is updated every 24 hours, and some stations’ prices update more slowly than others. Use the map to compare nearby options, then confirm the price at the station.
Why do some gas stations not show prices on Google Maps?
Not every station displays a price. Stations may not share prices with Google, or the data may be missing for certain fuel grades. Check the station directly or use a second source.
Can I edit a gas station’s price on Google Maps?
No. Prices on Google Maps are controlled by Google and cannot be edited by users. If a price looks wrong, the station’s posted price at the pump is the most reliable source.
Does the eco route really save gas?
Google says an eco route can save five to ten percent on fuel with a small extra travel time. Actual savings depend on traffic, road conditions, and your vehicle. It is a useful default, but it is not a guarantee.
Discover more from The Economy
Subscribe to get the latest posts sent to your email.
Fintech & Global Finance
Global Market Outlook: Navigating Interest Rates, Inflation, and Commodity Spikes
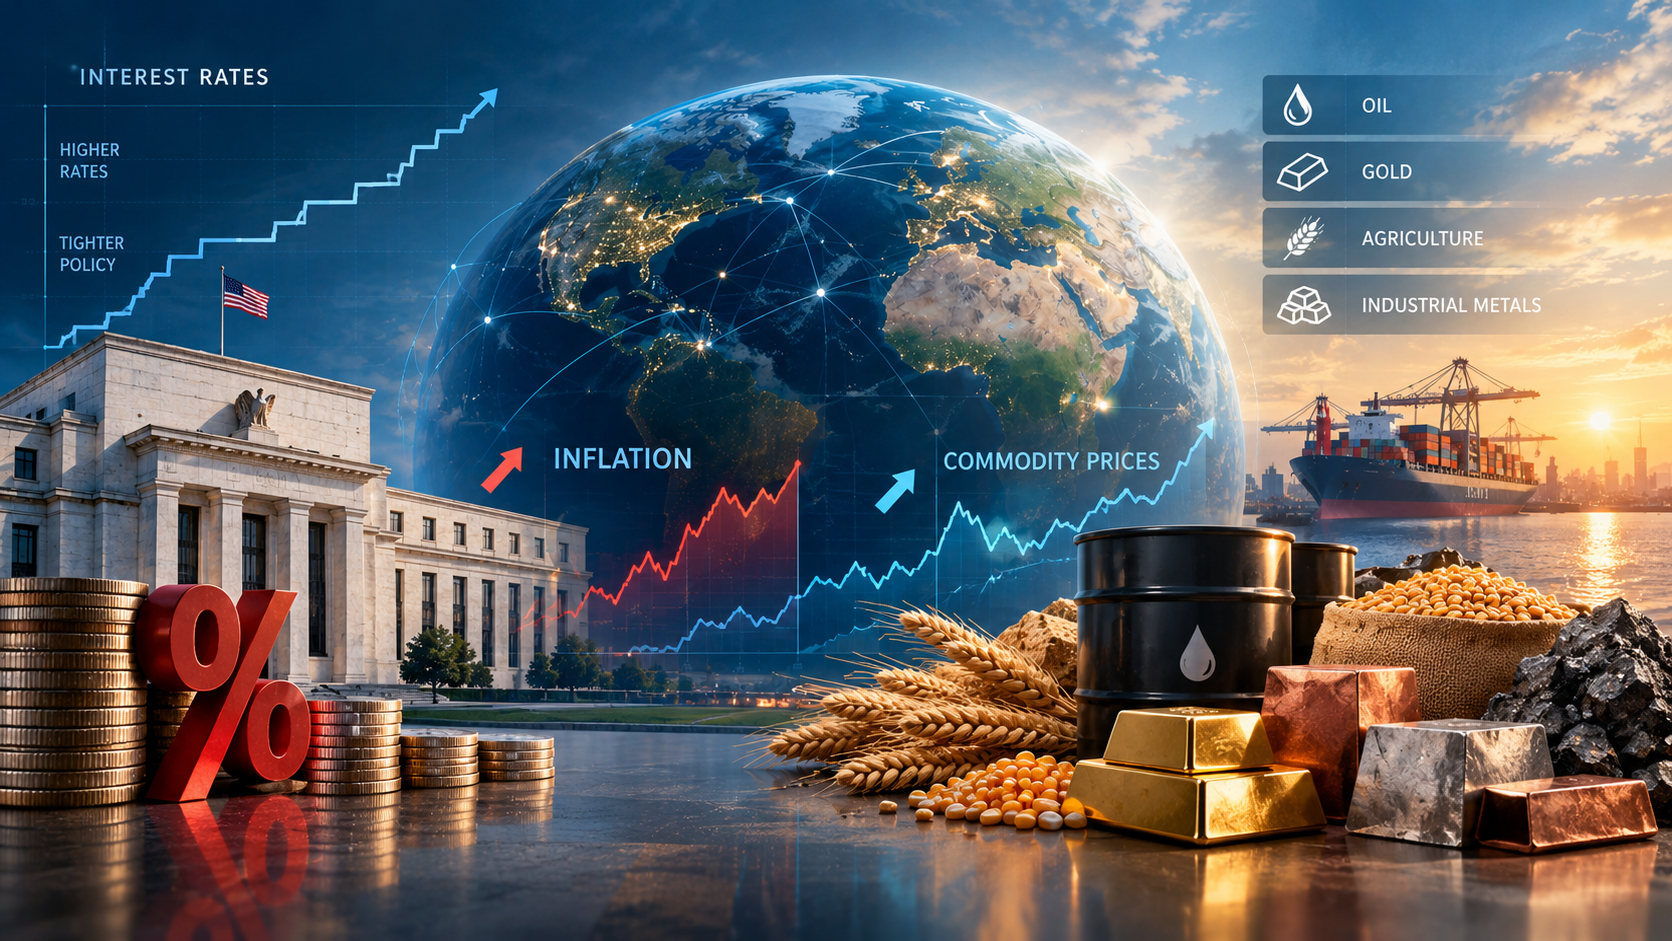
Central banks are now raising rates, not cutting them, as oil tops $100. Here’s where the Fed, ECB, inflation, and crude stand, and what to watch next.
Key Takeaways
- The Federal Reserve raised its target range by 0.25 percentage points on September 16, 2026, to 3.75% to 4.00%. It was the first US hike in several years.
- The European Central Bank has raised rates twice this year, most recently on September 10, bringing its deposit rate to 2.50%.
- US headline inflation was 3.4% year over year in August 2026, with core inflation at 2.4%. The energy component is the main reason headline inflation is above core.
- Brent crude traded above $100 a barrel in early September and was at $100.53 on October 6, after rising more than 30% from early-August lows.
- The main driver is a supply shock tied to the conflict involving Iran, which has disrupted shipping and energy infrastructure. Monetary policy is responding to that shock, not to weak growth.
Search Intent Summary
Readers searching for a global market outlook want to know three things: where interest rates are heading, whether inflation is coming back, and what commodity prices mean for their money. This article covers the current policy settings, the inflation data behind them, and the oil shock driving both.
The Policy Shift: From Cuts to Hikes
Through much of 2025, the Fed was cutting rates. It delivered three consecutive cuts in the second half of that year and then paused. Through the first eight months of 2026, the Fed held at 3.50% to 3.75%, with at least one official dissenting in favor of a hike at the July meeting.
The Fed’s September 15 to 16 meeting changed the picture. The committee raised the target range by 25 basis points, to 3.75% to 4.00%, and the Federal Reserve’s published calendar and statements confirm the meeting schedule. The updated projections point to roughly one more quarter-point increase before year-end, according to secondary analysis of the Fed’s September summary of economic projections. Readers should check the Fed’s own projections table rather than relying on summaries.
Europe moved first. The ECB raised its deposit rate in June, its first hike since September 2023, and again on September 10, to 2.50%. Its main refinancing rate is now 2.65%, and the marginal lending rate is 2.90%. The ECB said it is not committing to a fixed path and will decide meeting by meeting.
The message from both central banks is consistent. Inflation has moved above target because of energy, and the risk is that it becomes entrenched. Cutting rates into an energy shock would be the opposite of what policymakers want to do.
The Inflation Picture
US consumer prices rose 3.4% over the year to August 2026, unchanged from July. The peak this year was 3.8% in April. Monthly headline CPI rose 0.4% in August, with energy up 2.1%.
Core inflation, which excludes food and energy, eased to 2.4% year over year, the lowest reading since March 2021. Core CPI rose 0.3% in August alone, above the 0.2% consensus, which is why markets read the report as hawkish. Real average hourly earnings fell 0.3% over the year, meaning wages are losing ground to prices.
The eurozone shows a similar pattern. Euro-area inflation reached 3.3% in August, its highest since 2023, with energy the main driver. Excluding energy, inflation was about 2.2%. The ECB’s own projections put headline inflation averaging 3.0% in 2026, falling toward 2.5% in 2027 and 2.1% in 2028.
That split matters. When energy drives inflation and core stays contained, central banks face a dilemma. Hiking rates does little to lower oil prices, but it can slow growth and tighten financial conditions.
The Oil Shock
Brent crude is the single biggest variable in this outlook. Brent rose above $100 on September 9, touched $106.60 on September 10 during a 5% one-day jump, and was trading at $100.53 on October 6. Reporting from Khaleej Times attributed the spike to the biggest wave of attacks on shipping since the conflict began, along with the failure of hopes for a lasting ceasefire.
The conflict is now around six months old. The International Energy Agency’s August forecast projected global oil supply falling by about 4.3 million barrels a day in 2026, roughly 4%. OPEC, by contrast, has cut its forecast for world oil demand growth for a fifth straight month, which shows the market is pricing supply risk more than demand strength.
The supply and demand picture is tight. Analysts quoted in September described a “prolonged new normal” in which disruption risk is persistent rather than occasional, and noted limited spare production capacity. The Strait of Hormuz is the key chokepoint in that analysis.
Bond Markets and the Dollar
Rates have moved beyond the policy decisions themselves. Ten-year US Treasury yields reached their highest level since 2023 in early September, and Germany’s ten-year Bund yield hit its highest since 2011 after the ECB decision. That means borrowing costs are rising for governments and households alike, including mortgages.
For the currency picture, the dollar’s direction depends on how the Fed and ECB diverge. The ECB’s deposit rate now sits about 1.00 to 1.25 percentage points below the US range, a gap that generally favors the dollar. If the ECB hikes further than the Fed, that gap narrows. Watch the rate differential, not just the level of rates.
Scenarios for the Next Six Months
Rather than a single forecast, consider three paths. These are analytical scenarios, not predictions.
Base case: elevated energy, gradual hikes. Oil stays above $90 with periodic spikes, inflation hovers around 3%, and the Fed and ECB make one or two more moves before pausing. Bond yields stay high, and rate-sensitive sectors such as housing remain under pressure.
Escalation: oil moves higher and sticks. A sustained disruption pushes Brent well above $100, headline inflation rises again, and central banks face a choice between tightening further and accepting above-target inflation. This is the scenario that most threatens growth.
De-escalation: a durable ceasefire. Oil falls back, headline inflation eases through the rest of the year, and markets start pricing rate cuts again. Earlier in 2026, the Fed’s own projections showed cuts were possible, and a credible ceasefire could revive that path.
The swing factor is the conflict, not the data. Monthly inflation prints matter, but energy prices can overwhelm any single report.
Practical Strategy: What to Watch
For investors, the immediate indicators are the monthly CPI release, weekly oil inventory data, and any shipping disruption news from the Strait of Hormuz. Watch the 10-year Treasury yield as a gauge of financing costs across the economy.
For households and businesses, the practical takeaways are straightforward. Fixed-rate borrowing costs have risen and may stay high. Energy budgets need a buffer. Variable-rate debt is more exposed to further hikes than fixed-rate debt.
For policy watchers, the ECB’s next scheduled decision falls on October 29, and the Fed’s next meeting date is listed on its calendar. Each decision will reflect the most recent inflation and energy data.
This article offers general market context and is not investment advice. Consider speaking with a licensed financial adviser before making decisions based on these trends.
Future Outlook
The regime has changed. Two years ago, the debate was about how fast central banks would cut. Today it is about how far they will hike, and whether energy inflation spreads into wages and services. Core inflation is currently contained, which gives policymakers room to wait. That room shrinks if oil stays above $100 for months.
Frequently Asked Questions
Why are central banks raising rates instead of cutting them?
Inflation is above target in both the US and eurozone, and energy prices are the main driver. Raising rates is intended to keep higher energy costs from spreading into wages and prices across the economy. Both central banks have said decisions will depend on incoming data.
Is inflation falling?
Headline US inflation has eased from a 3.8% peak in April to 3.4% in August, and core inflation is at its lowest level since 2021. However, headline inflation is still well above the Fed’s 2% target, and eurozone inflation rose in August. Whether the trend continues depends largely on energy prices.
How high is oil right now?
Brent traded at $100.53 on October 6, 2026. Oil prices move daily, so check a current quote before relying on any figure. Prices have been volatile since the conflict escalated in early September.
Will interest rates fall in 2026?
The Fed’s September projections point to roughly one more increase by year-end rather than cuts. Market expectations change with each data release and each development in the conflict. Check the Fed’s latest statement and projections for the current outlook.
Discover more from The Economy
Subscribe to get the latest posts sent to your email.

Anthropic Draws the Line: Why Claude’s New Usage Policy Explicitly Bans ‘Cruel Behavior’ Toward AI

Ynon Kreiz & Mattel’s Digital Transformation: Franchise Strategy and Financial Growth

Crude Oil & Petroleum Market Analysis: OPEC+ Decisions and Price Forecasts

Top US Convenience Store Chains: Store Counts, EV Charging, and Sales Trends

Publix Store Closures Tracker: Locations, Rebuild Status, and What’s Changing

How to Find Google Maps Fuel Prices and Save on Every Fill-Up

Global Market Outlook: Navigating Interest Rates, Inflation, and Commodity Spikes

PEP Stock Analysis: PepsiCo Financials, Dividend Yield, and Sector Volatility

Social Security $90 Payment Claims: What’s Real, What’s a Scam, and What Your 2027 COLA Could Be

EU vs UK Electric Vehicle Tariffs: Impact on Automotive Supply Chains & Consumer Prices

Complete Guide to Home Loan Refinancing: Interest Rate Trends & Loan Calculation Strategies

Algorithmic Dogfights: Why the U.S. and China Must Establish Rules of Engagement for Autonomous Air Power

Stock Market Today: Dow, S&P 500, and Nasdaq Retreat as Treasury Yields

Global Economic Outlook 2026: 7 Forces Reshaping Markets, Trade and Business

Oil Prices Break $100 in 2026: Middle East Conflict & Energy Markets

China Stocks Today: Are Big Economies in Asia Nearing a Market Bottom?

Middle East War Economics 2026: Oil Prices & Energy Markets

PSX Forecast 2026: KSE-100, IMF Reviews & Geopolitics

Crypto Daily Outlook: Bitcoin, Altcoins, and the Future of Decentralized Finance

Global Pension Systems Ranked: The World’s Best and Worst Retirement Frameworks

Enterprise AI Platforms Disrupting B2B SaaS in 2026: Full Analysis

World’s Largest Economies: Ranking the Top Global Powers

Elon Musk’s Next Moves: Disrupting the 2026 Global Economy

Pakistan Economy 2026: Inside the SBP’s Balancing Act

GasBuddy Market Insights: How Crude Price Shifts Impact Local Fuel Cost Averages

World Bank & IMF Reports 2026: Why the “3% Growth” Consensus Is Actually a Debate

Global Equity Market Divergence: US Tech vs. European Dividend Stocks vs. Asian Growth

Stock Market Today: Dow Climbs 500 Points as Markets Shake Off Inflation Jitters
-

 Markets & Finance9 months ago
Top 15 Stocks for Investment in 2026 in PSX: Your Complete Guide to Pakistan’s Best Investment Opportunities
-

 Analysis8 months ago
Johor’s Investment Boom: The Hidden Costs Behind Malaysia’s Most Ambitious Economic Surge
-

 Analysis8 months ago
Top 10 Stocks for Investment in PSX for Quick Returns in 2026
-

 Banks9 months ago
Best Investments in Pakistan 2026: Top 10 Low-Price Shares and Long-Term Picks for the PSX
-

 Analysis8 months ago
Brazil’s Rare Earth Race: US, EU, and China Compete for Critical Minerals as Tensions Rise
-

 Investment9 months ago
Top 10 Mutual Fund Managers in Pakistan for Investment in 2026: A Comprehensive Guide for Optimal Returns
-

 Global Economy10 months ago
Pakistan’s Export Goldmine: 10 Game-Changing Markets Where Pakistani Businesses Are Winning Big in 2025
-

 Analysis7 months ago
Top 10 Countries with the World’s Strongest Currencies in 2026 — Ranked & Analysed