
Markets & Finance
Crude Oil Price Rally June 2026: OPEC+ Extends Cuts, Targets $100

Brent crude oil futures surged past $95 a barrel in late June 2026, touching $97.40 intraday, after OPEC+ announced a surprise extension of its production curbs through the end of September. The alliance, led by Saudi Arabia and Russia, had been expected to begin a gradual unwinding of the additional 800,000 barrels per day (bpd) of “voluntary adjustments” from July. Instead, it doubled down, citing “fragile demand sentiment, monetary uncertainty, and the need to ensure a stable and predictable supply environment” (OPEC Press Release, 26 June 2026). The decision has reignited the crude oil price rally June 2026, propelling the market toward the psychologically critical $100 threshold and reviving fears of energy‑driven inflation.
OPEC+ Quota Extension: The Mechanics
The current production restraint is layered. The baseline production targets, agreed in November 2024, collectively curb output by 2 million bpd relative to October 2022 baselines. On top of this, the “voluntary adjustments” of 1.6 million bpd, announced by Saudi Arabia, Russia, Iraq, UAE, Kuwait, Kazakhstan, Algeria, and Oman, were extended multiple times and were scheduled to taper starting July 2026. The June decision defers that taper to October, with a caveat that the unwinding will be gradual and “data dependent.” In practice, the group is keeping 3.6 million bpd—roughly 3.5% of global supply—off the market.
Saudi Arabia’s energy minister, Prince Abdulaziz bin Salman, framed the move as preemptive. “We see demand growth projections that are solid, but we also see inventory builds in some products. We do not want to risk a repeat of the 2025 mini‑glut that punished prices. Discipline is the watchword,” he said at the press conference (Saudi Press Agency, June 2026). Behind the scenes, Riyadh needs an average oil price above $85 to fund its Vision 2030 megaprojects, and Moscow requires revenue to sustain its military operations. Both have a clear incentive to err on the side of tightness.
Global Demand: Jet Fuel and Petrochemicals Drive Growth
The International Energy Agency’s June Oil Market Report projects global oil demand will rise by 1.8 million bpd in 2026 to a record 105.2 million bpd (IEA OMR, June 2026). The main engines are jet fuel and petrochemicals. Air travel has now fully recovered to above 2019 levels, with Asia‑Pacific passenger numbers 12% higher. The summer travel season in the Northern Hemisphere is proving exceptionally strong, with US airlines reporting record bookings and European airports setting new daily traffic records. Petrochemical demand, driven by new crackers in China and India, is absorbing more naphtha and LPG.
On the supply side, non‑OPEC+ growth is led by the United States, Brazil, Guyana, and Canada, adding a combined 1.4 million bpd. US production reached a new high of 14.2 million bpd in May, but the growth rate has halved from 2024’s blistering pace as the most productive Permian Basin acreage matures and consolidation reduces the number of active rigs (EIA Short‑Term Energy Outlook, June 2026). Brazil’s pre‑salt fields and Guyana’s Stabroek block continue to ramp up, but they cannot fully offset the OPEC+ cuts. The net global supply‑demand balance is in a deficit of approximately 500,000 bpd in Q3, drawing down global inventories.
The Energy Inflation Outlook
The oil price rally is already feeding into consumer prices. US regular gasoline has averaged $3.92 per gallon in June, up 15% from a year ago, and is on track to breach the politically sensitive $4 mark before the July 4th holiday. The euro area harmonized index of consumer prices for energy rose 4.1% year‑on‑year in May, erasing some of the disinflation progress of 2025. Central banks, which had been hoping for a benign energy backdrop to allow rate cuts, now face a renewed headache. The Fed’s June Summary of Economic Projections showed that several participants revised their inflation forecasts up by 0.2 percentage points, explicitly citing “higher‑than‑assumed energy prices” (Federal Reserve, June 2026 SEP).
For businesses, transportation and raw‑material costs are rising again. Airlines, which hedged fuel heavily when prices were lower in early 2025, are seeing those hedges roll off, exposing them to spot prices. Shipping companies are imposing emergency fuel surcharges, adding to the cost of goods in transit. The FAO food price index (see Article 17) is also elevated, creating a compound inflation shock that hits low‑ and middle‑income consumers hardest.
Geopolitical Dimensions and SPR Depletion
The Biden administration, facing mid‑term elections in November 2026, has limited options. The Strategic Petroleum Reserve, drained by a record 180 million‑barrel release in 2022 and subsequent smaller releases, now holds just 340 million barrels, near a 40‑year low. Refilling it has been slow due to price‑sensitivity triggers and Congressional appropriations. White House Press Secretary Karine Jean‑Pierre reiterated that “all options are on the table,” but another massive SPR release would deplete it to levels that compromise emergency readiness. Diplomatically, the US has urged OPEC+ to increase supply, but the administration’s strained relationship with Saudi Arabia, particularly after the EV tariff dispute and the Kingdom’s BRICS engagement, has blunted US leverage (Reuters, June 2026).
Investment Implications
The energy sector is the standout trade of 2026. The S&P 500 Energy Index has returned 28% year‑to‑date, outperforming tech. Upstream companies with low decline rates and strong shareholder‑return programs—ExxonMobil, Chevron, ConocoPhillips, and EOG Resources—are attracting value and momentum flows. Oilfield services firms are also benefitting from a belated increase in global upstream capital expenditure, which the IEA estimates will reach $600 billion this year. However, long‑term investors remain cautious: the cyclical nature of oil, the accelerating energy transition, and the risk of an economic slowdown that craters demand create a volatile path. The consensus price target for Brent in Q4 is $100, but a break above $105 could trigger demand destruction and a policy response that caps the upside. For now, the balance of risks points to a tight market and elevated energy inflation through the summer.
Discover more from The Economy
Subscribe to get the latest posts sent to your email.


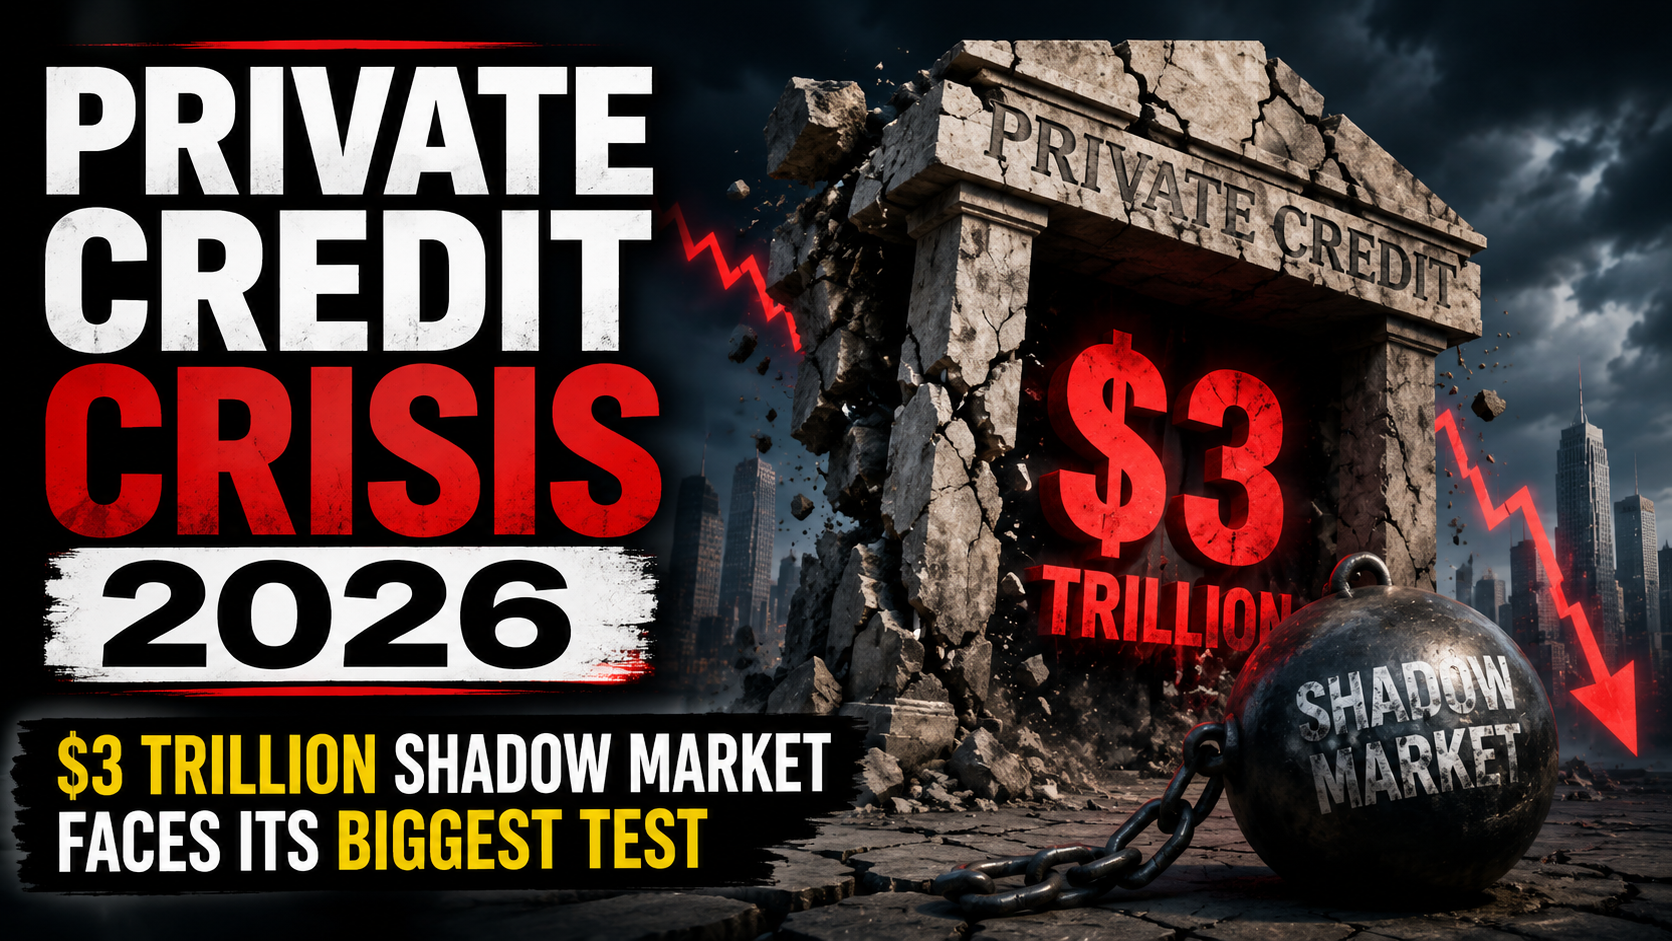
From Blue Owl’s fund freeze to FSB warnings and Jamie Dimon’s alarm, private credit is facing its first downturn stress test. We map the risks, the defaults, and what comes next.For more than a decade, private credit expanded in the gaps that post-2008 bank regulation created, growing from roughly $2 trillion in assets in 2020 to over $3 trillion by the end of 2025. Pension funds, insurance companies, and increasingly retail investors poured capital into what appeared to be a superior alternative to public bond markets — higher yields, lower volatility, and steady returns uncorrelated to listed equity swings. In 2026, the reckoning has begun.
A series of defaults, fund freezes, and fraud allegations in late 2025 and early 2026 has raised serious questions about how transparent, liquid, and stable this market really is. Blue Owl, one of the largest private credit managers, froze withdrawals from one of its retail funds in February 2026. Tricolor Holdings, a subprime auto lender, ran into funding difficulties in late 2024. First Brands, an auto parts supplier, allegedly pledged identical assets as collateral to multiple lenders simultaneously — a fraud that surfaced in early 2025. Each episode, individually containable; collectively, they outline a market entering its first genuine stress test.
The Scale and the Opacity
The Financial Stability Board, the G20’s global financial watchdog, published a landmark report in May 2026 warning that private credit’s complexity, leverage, and interconnectedness could amplify stress in adverse scenarios. The FSB estimated total private credit assets at $1.5 to $2 trillion — though industry survey-based estimates, incorporating broader definitions, place the market closer to $3.5 trillion according to the Alternative Credit Council.
The discrepancy between these figures is itself telling. Private credit lacks standardized, transparent data and is characterised by opaque valuation practices — a problem the FSB explicitly flagged, calling on national regulators to close data gaps and harmonise definitions. Unlike public bonds, private credit pricing is never continuously tested by live market transactions. It is instead set by fund managers through models that may not reflect true market clearing levels.
The FSB’s statistics showed $220 billion of drawn and undrawn credit lines from banks to private credit funds — but noted that commercial data suggested the actual figure could be twice as large. European banks alone reported significant direct exposures: Barclays disclosed $20 billion; Deutsche Bank approximately $30 billion, or 2% of its total loan book; BNP Paribas $25 billion, or 3% of its book.
The Structural Vulnerabilities
Several interconnected pressures are building simultaneously. First, the “true” default rate. While headline default rates in private credit have remained below 2%, once selective defaults and liability management exercises are included, the effective rate approaches 5%. This gap between reported and actual impairment is a function of private credit’s structural discretion: fund managers can renegotiate terms, extend maturities, and avoid triggering formal defaults in ways that public bond markets cannot accommodate.
Second, payment-in-kind interest usage has risen notably in recent years, with public Business Development Companies now receiving an average of 8% of investment income via PIK — meaning borrowers are paying interest not in cash but by issuing additional debt, compounding their principal while preserving short-term liquidity. This signals cash flow stress without formal default recognition.
Third, the retail investor experiment is untested. After extensive lobbying, US regulators gave private credit managers approval to sell to the roughly $13 trillion defined contribution market — exposing a new class of investors to an illiquid asset class that lacks the daily pricing and redemption mechanisms they are accustomed to. The combination of redemption promises and illiquid underlying assets is precisely what caused structural problems in real estate investment trusts during the 2022 rate shock.
The Dimon Warning and Senate Scrutiny
JPMorgan CEO Jamie Dimon’s April letter to shareholders was unusually blunt. Credit standards have been “modestly weakening pretty much across the board”, Dimon wrote, with increasingly aggressive assumptions about future performance underlying loan underwriting. Senator Jack Reed of Rhode Island wrote to Treasury Secretary Scott Bessent in March urging a prompt review of whether risks building in credit markets could become systemic.
The National Association of Insurance Commissioners adopted new reporting requirements in March, specifically targeting the estimated $1 trillion in private credit assets held in insurance pools. Increasing transparency around how insurers manage these portfolios was identified as a key regulatory priority for state-level oversight.
Is This 2008 in Slow Motion?
The comparison to the pre-crisis structured credit market is irresistible and imperfect. Both expanded rapidly, operated with limited transparency, and became increasingly interconnected. But private credit is generally less leveraged and less complex than the CDO-squared structures of 2007. Its investor base relies predominantly on long-term capital rather than short-term funding markets. And the formal banking system, while exposed through revolving credit facilities and strategic partnerships, has larger capital buffers than it did eighteen years ago.
The more likely outcome is not a sudden collapse but a prolonged credit tightening — what some analysts describe as a quiet suppression of business lending that could constrain investment and economic growth for years without triggering a dramatic market event. Less cinematic than a financial crisis. Potentially just as damaging.
Discover more from The Economy
Subscribe to get the latest posts sent to your email.

After surging 64% in 2025, gold has broken above $5,000/oz in 2026. J.P. Morgan targets $6,000 by year-end. Here’s why structural forces — not just crisis hedging — are driving the rally.Gold’s 2025 rally was remarkable. What has happened since is harder to categorise with traditional tools.
After surging roughly 64% in calendar year 2025 — one of the strongest annual performances in the metal’s modern trading history — gold entered 2026 at record highs above $5,100 per ounce. It reached an intraday peak of $5,595 on January 29 before pulling back, and has since been trading in a range that tests the patience of investors accustomed to its traditional role as a passive crisis hedge.
What is different in 2026 is that gold’s role has expanded. It is no longer merely a fear trade. It is increasingly a structural reserve asset, held deliberately by central banks, sovereign wealth funds, and institutional investors as a hedge against monetary system fragility rather than individual geopolitical shocks.
J.P. Morgan’s $6,000 Call
J.P. Morgan’s Global Research team has set a fourth-quarter 2026 average price target of $6,000 per ounce, with $6,300 per ounce possible by end-2027. The thesis rests on three pillars: sustained central bank accumulation, renewed Western ETF inflows, and the inflationary pressure generated by the US-Iran conflict, which is driving energy prices and complicating the Federal Reserve’s rate path.
Greg Shearer, head of base and precious metals at J.P. Morgan, acknowledges the near-term complication: “Gold is stuck in a bit of a technical no-man’s land, trudging above the 200-day moving average around $4,340/oz and capped for now below the 50-day moving average at $4,730/oz.” The hawkish surprise from Kevin Warsh’s Federal Reserve debut — with nine officials signalling potential rate hikes — created a headwind. Gold fell more than 2% on the day of the June 17 FOMC decision, as the dollar strengthened and real rate expectations shifted.
The bearish scenario, Shearer noted, would involve a macro environment where US growth and employment remain buoyant while inflation continues to accelerate, “solidifying a Fed hiking cycle this year.” A determined hiking cycle would likely trigger Western ETF outflows — one of the primary channels through which financial demand has been flowing into gold — and could put sustained pressure on prices. He characterised this as “a high bar.”
The Structural Drivers That Do Not Reverse Easily
VanEck’s analysis identifies five structural forces that are unlikely to reverse in 2026 regardless of near-term volatility. First: the global debt debasement trade. Global sectoral debt reached $340 trillion in mid-2025, with governments accounting for a record 30% share. At three to four times global GDP, sovereign debt levels make gold increasingly attractive as a hedge against currency debasement — a dynamic that is currency-agnostic and therefore persistent.
Second: elevated stock-bond correlations. The post-pandemic inflation spike pushed US stock-bond correlations to 30-year highs. While they have moderated, the breakdown of the traditional 60/40 portfolio hedge function has structurally increased gold’s diversification value for institutional investors.
Third: central bank demand. Emerging market central banks — led by China, India, and several Gulf sovereign wealth funds — have been net buyers of gold continuously since 2022. China launched a pilot programme in early 2025 allowing 10 insurers to allocate up to 1% of their assets to gold, and has separately positioned itself as a potential custodian for foreign sovereign gold reserves — a move designed to accelerate de-dollarisation.
In India, gold ETF assets under management have reached $10.9 billion — up 15.5 times since 2020, outpacing global AUM growth as rising incomes and inflation hedging drive retail demand alongside longstanding cultural preferences.
Gold as Recession Insurance
Historical data reinforces gold’s performance during economic contractions. During the 2008 global financial crisis, equities suffered severe losses while gold prices rose as investors sought protection from financial instability. During the 2020 pandemic-driven recession, gold surged to record levels before monetary stimulus eventually shifted the allocation calculus. The pattern is consistent: when confidence in financial systems weakens, demand for physical gold increases.
The current environment carries characteristics of both the inflationary 1970s and the institutional stress of 2008. The Iran war is driving energy prices higher, complicating monetary policy. The debt overhang in advanced economies is structurally inflationary. And the AI investment cycle — while deflationary in its eventual productivity effects — is generating massive near-term debt issuance that increases systemic financial risk.
CBS News noted the complexity in 2026: gold does not necessarily rise in a straight line with inflation because rising rates increase the opportunity cost of holding a non-yielding asset. The relationship between gold and inflation is real but non-linear — and the current environment, where energy-driven inflation is pushing toward rate hikes rather than rate cuts, tests the standard model.
The De-Dollarisation Premium
One dimension of gold’s 2026 story that receives less coverage than it deserves is its role in the global monetary transition. The World Gold Council attributes roughly 8–12% of gold’s 2025 return to geopolitical risk and de-dollarisation allocations — not crisis hedging in the traditional sense, but deliberate strategic diversification by central banks and sovereign institutions seeking to reduce dependence on US dollar-denominated reserves.
VanEck‘s emerging markets bond team calculated a theoretical gold price that would be required if the dollar lost reserve currency status: approximately $39,000 per ounce under central bank M0 frameworks, and $184,000 under M2. These figures are scenario analysis, not forecasts — but they illustrate the optionality that gold provides to investors concerned about long-run dollar hegemony.
Discover more from The Economy
Subscribe to get the latest posts sent to your email.

SpaceX priced at $135 per share on June 12, 2026, raising $75 billion and briefly surpassing $2 trillion in market cap. Here’s what the S-1 reveals — and what it conceals.The company priced its shares at $135 each the previous evening, raising approximately $75 billion and giving SpaceX a valuation approaching $1.8 trillion at the IPO price. On the first day of trading, investor demand drove the stock above $150, pushing the market capitalisation past $2 trillion and briefly making Elon Musk the world’s first trillionaire on record. It was the largest initial public offering in history by capital raised — surpassing even the 2019 listing of Saudi Aramco, which held the previous record.
The Business Behind the Spectacle
Strip away the narrative and the financials tell a specific story. Starlink accounted for approximately 61% of total company revenue in 2025, generating $11.4 billion — up roughly 50% from $7.6 billion in 2024. The satellite internet division had surpassed 10.3 million active customers across 160 countries as of March 31, 2026, more than doubling from 4.6 million at end-2024. Total company revenue reached $18.7 billion in 2025, up 33% year-on-year.
The profitability picture is more complicated. SpaceX reported a GAAP net loss of nearly $5 billion in 2025, reflecting capital-intensive investment in the Starship programme, Starlink satellite deployment, and — critically — the xAI data centre buildout. The company’s S-1 disclosed that $12.7 billion of its approximately $21 billion in capital expenditure last year went to building data centres for xAI — more than was spent on rockets or satellites. That integration deepens the operational complexity that investors must price.
The xAI Merger and What It Changes
In February 2026, Elon Musk announced the merger of xAI with SpaceX at a combined valuation of $1.25 trillion, with xAI valued at approximately $80 billion in the transaction. The rationale was vertical integration — SpaceX needed AI infrastructure for Starlink’s autonomous systems, and xAI needed to stop burning cash as a standalone entity. The combined company now comprises three major segments: launch services, satellite communications, and artificial intelligence, with an option to acquire Cursor (the AI coding platform) for up to $60 billion.
The scope of the ambition is matched by the scale of the uncertainty. Morningstar published a pre-IPO analysis placing fair value at approximately $780 billion — roughly 55% below the IPO price — citing a tiny initial float, index-inclusion mechanics inflating near-term demand, and SpaceX‘s unproven profitability. Morningstar’s analysts found xAI’s economic moat “indeterminate” and characterised it as posing a “material threat of value destruction.”
Valuation Arithmetic That Tests Credulity
The numbers at the IPO price require investors to accept some unusual premises. At $135 per share, SpaceX priced at roughly 94 times its 2025 revenue — a multiple with no precedent among the world’s most valuable companies. The S-1’s total addressable market analysis assumed that SpaceX’s revenues could one day approach $22.7 trillion from enterprise applications alone — 30 times the size of the entire existing enterprise software market — and that every household globally would adopt Starlink for broadband.
The governance structure adds another layer of complexity. Musk holds 85% of total voting rights, meaning he effectively cannot be removed without his own consent. The float at IPO was deliberately small, concentrating pricing power among the initial buyers.
Historical patterns are sobering. Analysis of the 15 largest U.S. IPOs since 2006 showed that the average stock declined 50% from its IPO price at some point during the first year and finished that year approximately 33% below the offering price. With the stock trading around $153 in late June — below its intraday peak of $225.64 on June 16 — the post-IPO trajectory is already reflecting some of that historical gravity.
Retail Access and the Meme-Stock Question
One of the defining structural features of the SpaceX offering was its retail allocation. Most mega-cap IPOs direct between 5% and 10% of shares to individual investors. SpaceX allocated as much as 30% to retail participants through Robinhood, Charles Schwab, Fidelity, SoFi, and E*TRADE. The strategic logic is straightforward: Tesla’s retail following helped sustain elevated valuations through multiple cycles, and Musk is replicating that playbook with SpaceX.
SpaceX was the most-bought stock by retail traders on a net basis during its first trading day, and among the most discussed on Reddit’s WallStreetBets in the days preceding the listing. The IPO is expected to mint thousands of new millionaires from early employees and investors, and multiple new billionaires, including several dozen Musk allies who accumulated positions during private tender offers.
The Space Economy Redistribution Effect
The listing had immediate consequences for adjacent names. Redwire and Rocket Lab each fell more than 10% on SpaceX’s debut day as investors rotated out of smaller space names and into the newly public market leader. The Procure Space ETF (UFO) dropped 7%. Goldman Sachs, the lead-left bookrunner, climbed more than 2% — one of the largest gainers in the Invesco KBW Bank ETF.
The comparison Bloomberg drew to the Standard Oil breakup is not accidental: the capital markets impact of SpaceX’s listing — on price discovery, on sector weighting, on pension fund allocations — is expected to reverberate for years. The question is whether the underlying business can grow into a valuation that currently requires perfection.
Discover more from The Economy
Subscribe to get the latest posts sent to your email.

EU Greenwashing Enforcement Hits New Peak with €1.2 Billion Fast‑Fashion Fine

India Economic Rise 2026: How the Subcontinent Toppled Japan

Sovereign Debt Crisis 2026: The ‘Lost Decade’ Is Already Here for 40 Nations

Crude Oil Price Rally June 2026: OPEC+ Extends Cuts, Targets $100

China Housing Market Turnaround: White‑List Model Stabilises Prices

US Sovereign Debt Risk 2026: CBO Projects $50 Trillion, Fitch Warns

BRICS De‑Dollarization Strategy Takes Shape with $15 Billion Local‑Currency Push

Digital Euro Cross‑Border Pilot Goes Live: What It Means for Banks

AI Impact on Wages 2026: Productivity Soars, Paychecks Stagnate

Global Economic Outlook June 2026: Trade Fragmentation Bites

SpaceX IPO 2026: Inside the $2 Trillion Valuation That Remade Wall Street

Kevin Warsh’s Regime Change: The Federal Reserve in the Age of War, Inflation, and Political Pressure

Private Credit Crisis 2026: $3 Trillion Shadow Market Faces Its Biggest Test

US-Iran War Economic Impact 2026: Hormuz Shock, Stagflation Risk, and the Global Recession Threat

PwC China Partner Payouts Cut Amid Evergrande Audit Fraud

Broadcom Market Value Loss: Revenue Forecast Disappoints

Investors Pile Into Bullish Dollar Bets as ‘US Exceptionalism’ Trade Returns

Here’s How Much It’ll Cost You to Be Part of SpaceX’s Record-Breaking $75 Billion IPO

Nasdaq Tumbles 4% as Chip and Memory Stocks Sink: A $1.2 Trillion Wipeout

How to Fix Pakistan’s Debt Economy: A Structural Blueprint

Smash Capital Leads $200M Funding for Allen Control Systems

Japan’s Nikkei Scales Record Peak as AI Shares Track US Chip Rally

Grinding the Already Ground: Pakistan’s Inflation Crisis

Democrats Draw a Red Line Around Military AI — And the Pentagon Is Already Pushing Back

New Investment Super-Cycle: AI, Green Energy & Re-Shoring

Xponential Fitness Franchise Lawsuit: The $3.97M Judgment

Middle East Conflict Oil Prices: The $4 Surge Explained

The End of the Chatbot: Why OpenAI is Tearing Up Its Most Successful Product
-

 Markets & Finance6 months ago
Top 15 Stocks for Investment in 2026 in PSX: Your Complete Guide to Pakistan’s Best Investment Opportunities
-

 Analysis4 months ago
Top 10 Stocks for Investment in PSX for Quick Returns in 2026
-

 Analysis5 months ago
Brazil’s Rare Earth Race: US, EU, and China Compete for Critical Minerals as Tensions Rise
-

 Analysis4 months ago
Johor’s Investment Boom: The Hidden Costs Behind Malaysia’s Most Ambitious Economic Surge
-

 Banks5 months ago
Best Investments in Pakistan 2026: Top 10 Low-Price Shares and Long-Term Picks for the PSX
-

 Investment6 months ago
Top 10 Mutual Fund Managers in Pakistan for Investment in 2026: A Comprehensive Guide for Optimal Returns
-

 Global Economy6 months ago
15 Most Lucrative Sectors for Investment in Pakistan: A 2025 Data-Driven Analysis
-

 Global Economy6 months ago
Pakistan’s Export Goldmine: 10 Game-Changing Markets Where Pakistani Businesses Are Winning Big in 2025