
Global Economy
Global Economic Outlook June 2026: Trade Fragmentation Bites

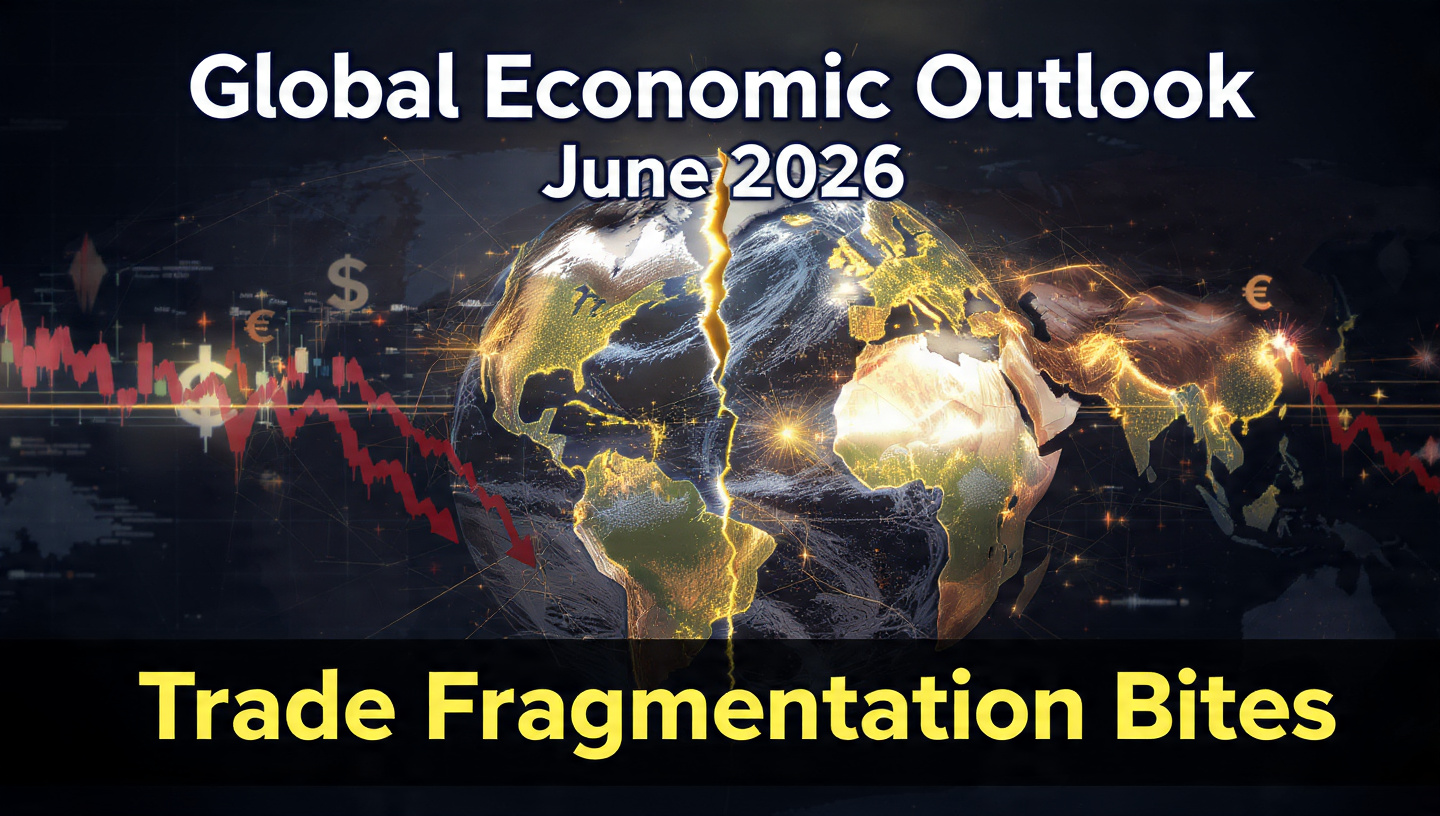
The global economy has entered a choppy, multi-speed phase. On June 27, 2026, the International Monetary Fund slashed its world growth forecast to just 2.7%—the slowest pace since the 2001 dot‑com bust if the pandemic collapse of 2020 is excluded. In its World Economic Outlook Update, the Fund painted a picture of an international trading system that is fragmenting along geopolitical lines, central banks that remain stuck in a “higher‑for‑even‑longer” posture, and a consumer whose post‑pandemic spending spree is finally exhausting itself (IMF WEO Update, June 2026). For investors, the report is not merely academic; it is a roadmap of where the next risks and opportunities will materialize.
The Fragmentation Dynamic
Trade fragmentation—once a risk scenario—has become the baseline. The IMF estimates that the cumulative number of new trade restrictions imposed since 2023 has surpassed 4,000, covering nearly 12% of global goods trade. The most recent escalation came in May 2026 when the United States raised tariffs on a broad basket of Chinese‑made consumer electronics, and the European Union followed with a carbon‑border levy extension that hit Asian steel and aluminium. In response, China restricted exports of rare‑earth processing technology, and India slapped a 25% surcharge on select American and European luxury goods. The result: goods trade growth has fallen to 1.2% this year, well below the historical trend of 2.5% (World Trade Organization, June 2026).
Supply chains are not just re‑routing; they are duplicating. Multinational corporations, burned by pandemic shortages and now tariff uncertainty, are building parallel production lines in “friend‑shoring” hubs. A survey by the Bank for International Settlements shows that the share of manufacturing capacity located in politically aligned countries has risen from 62% in 2019 to 75% in 2026 (BIS Annual Economic Report 2026). While this de‑risks individual firm exposure, it comes at a macroeconomic cost: duplication erodes the efficiency gains that have driven decades of disinflationary global growth. The IMF estimates that extreme fragmentation could permanently reduce global GDP by 7% over the long run.
The Inflation‑Growth Trade‑Off
Stubborn core inflation is the second pillar of the downgrade. In advanced economies, services inflation is running at 4.1%, driven by wages in hospitality, healthcare, and professional services where labor markets remain exceptionally tight. The Federal Reserve’s preferred measure, the core PCE deflator, has been oscillating between 2.8% and 3.2% all year, preventing the pivot that bond markets had priced in. The European Central Bank, despite having cut its deposit rate to 3.25%, is warning that a renewed spike in energy costs—crude oil is at $95—could force it to pause. In the June 2026 Financial Stability Report, the ECB noted that “premature celebration of disinflation is the single largest policy risk” (ECB Financial Stability Review, June 2026).
Consequently, real interest rates are staying restrictive. The global neutral rate may have risen due to higher public debt and investment needs related to defense and climate, but the precise level is uncertain. Markets are now pricing only one quarter‑point cut by the Fed in the fourth quarter, and the Bank of England is expected to hold at 4.5% for the rest of the year. This monetary stance is squeezing emerging markets, where dollar‑denominated debt servicing costs have jumped 18% since 2024 (Institute of International Finance, June 2026).
Regional Divergences
The growth downgrade is not uniform. The United States is still projected to expand by 1.8% in 2026, supported by AI‑driven investment in data centers and a drawdown of excess savings by wealthier households. The euro area is the sick man of the developed world, growing just 0.7%, as Germany’s industrial model struggles with high energy costs and Chinese competition. China’s economy is expected to grow 4.6%, a respectable figure that nonetheless masks a deep property crisis and consumer caution; the IMF’s China Article IV consultation in May highlighted that without a decisive restructuring of local government debt, the medium‑term growth trajectory could slip below 3.5% (IMF Article IV China, May 2026). India stands out with a 7.2% expansion, while sub‑Saharan Africa, dragged down by debt distress in Ethiopia, Ghana, and Zambia, is barely growing at 2.9%—a per‑capita contraction.
Investment Strategy in a Fragmented World
Portfolio managers are adapting to a “world of blocs.” The traditional 60‑40 equity‑bond portfolio is being augmented with real assets and currencies that benefit from deglobalisation. Goldman Sachs’ strategy team recommends overweighting gold, which has benefited from central bank purchases by the People’s Bank of China and the Saudi Arabian Monetary Authority, and infrastructure stocks tied to electrification and re‑industrialization (Goldman Sachs Global Strategy Paper, June 2026). Fixed‑income investors are focusing on short‑duration, high‑quality corporate bonds and inflation‑protected securities. The yen and the Swiss franc, traditional safe havens, have outperformed as the carry trade unwinds.
Equity markets are being sliced by the trade war dynamic. Sectors exposed to cross‑border friction—automobiles, semiconductors, and capital goods—are seeing wider dispersion in analyst estimates. The rise of “national champion” stocks that benefit from protectionist policies is a new theme: defense contractors, domestic semiconductor foundries, and rare‑earth miners are commanding premium valuations. Conversely, global luxury goods firms that rely on frictionless movement of goods and aspirational Chinese consumers are being repriced.
The Policy Wildcard
The IMF’s chief economist, in the press briefing accompanying the forecast, issued a pointed warning: “We are one shock away from a global recession.” That shock could be a financial accident, a geopolitical conflagration, or a disorderly adjustment in sovereign bond markets. The Fund urged G20 nations to use fiscal policy cautiously, rebuild buffers, and accelerate structural reforms that boost productivity without relying solely on AI. The June 2026 meeting of finance ministers in Rio de Janeiro pledged to avoid a subsidy war, but the communiqué was notably vague on enforcement (G20 Communiqué, June 2026).
For the retail investor, the message is to stay diversified, stress‑test portfolios for 1970s‑style stagflation, and recognize that geopolitical alignment is now a fundamental factor alongside price‑to‑earnings ratios. The IMF’s downgrade is not a death sentence, but it marks the end of the post‑Cold War globalization era that shaped asset returns for a generation.
Discover more from The Economy
Subscribe to get the latest posts sent to your email.


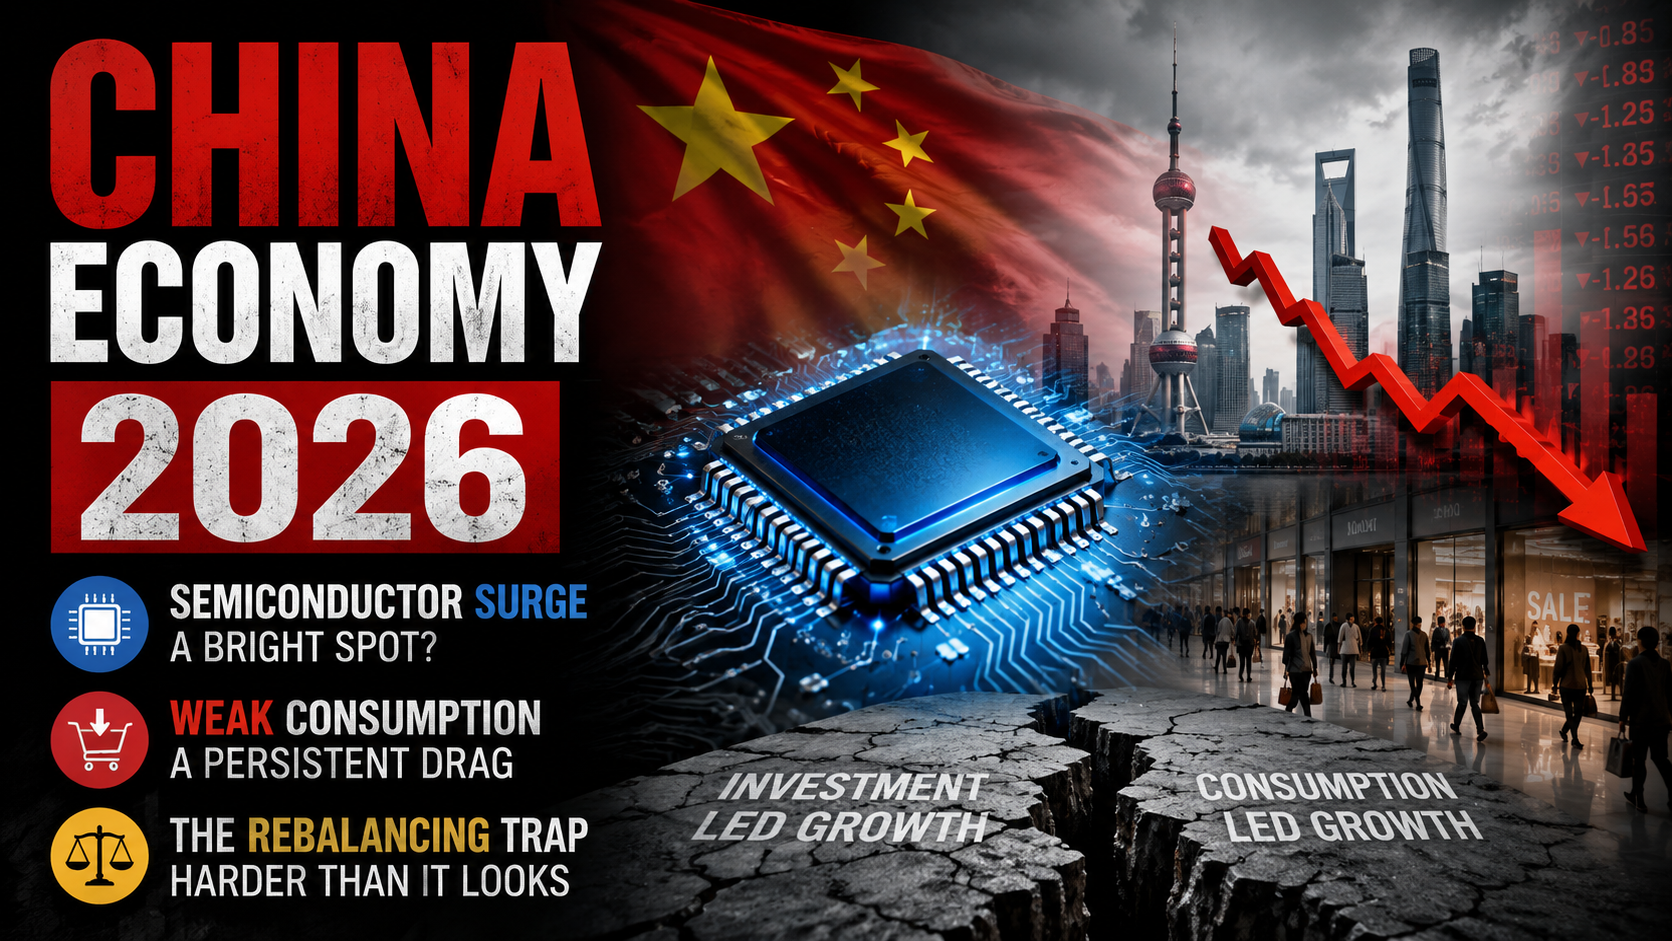
China’s semiconductor exports surged 87% in May 2026 even as retail sales stagnated and property investment fell 16%. Inside the structural divergence threatening Beijing’s growth model.A single statistic from China’s May 2026 industrial output report captures the country’s economic condition better than any official growth headline: semiconductor production surged 87% year-on-year, even as retail sales remained muted and property investment fell at its steepest rate since the pandemic. The gap between China’s industrial machine and its domestic consumption economy has never been wider. And unlike earlier cycles, there is no obvious policy lever that closes it quickly.
China officially reported 5.0% GDP growth in Q1 2026, but the US-China Economic and Security Review Commission and independent economists identified three reasons for scepticism: ongoing downward revisions to prior-year numbers, a statistical rebound effect, and the absence of genuine domestic demand recovery. The government’s own fiscal deficit target of 4% of GDP — the highest since 1991 and set in the 15th Five-Year Plan passed at the March “Two Sessions” — implies that official growth is being propped by state investment rather than organic household consumption.
The Export Machine: Strength Built on Structural Weakness
China’s trade surplus in 2025 crossed $1.2 trillion — a record — and the export surge has continued in 2026. In May, exports denominated in US dollars rose 19.6% year-on-year, the second-largest increase since early 2022. Semiconductor exports rose 110%. Mobile phone exports rose 44%. Auto parts and computing hardware rose 66%.
The IMF estimated in early 2026 that the renminbi was undervalued by 16%, and pressed Beijing to allow revaluation to reduce the trade imbalance. China demurred, pledging only that the currency would remain “generally stable.” Meanwhile, China’s passenger car exports rose 60.6% year-on-year in Q1 — many of them cheaper models subsidised into foreign markets after Beijing’s “anti-involution” policy created domestic oversupply. Developing markets bore the brunt: the US-China Economic and Security Review Commission documented a 14% surge in “China Shock 2.0” export pressure on emerging economies.
But the export machine’s strength is inseparable from the domestic market’s weakness. When local demand softens, manufacturers redirect capacity toward international markets. The result is not a virtuous cycle of industrial upgrading; it is a pressure valve that delays, but does not resolve, the underlying consumption deficit.
The Consumption Deficit: Property, Wealth, and Japanification
Roughly two-thirds of Chinese household wealth is held in the form of property. The ongoing correction in that market is therefore not merely a sectoral issue — it is a household balance sheet crisis that suppresses the propensity to consume across the entire economy. Fixed-asset investment fell 4.1% in the first five months of 2026 year-on-year — the steepest decline since May 2020. Property investment dropped 16.2%. Government stimulation efforts — trade-in subsidies for EVs and appliances, value-added tax rebates — have produced modest and temporary retail bounces without addressing the underlying confidence deficit.
Mao Zhenhua, a professor at the University of Hong Kong, put it plainly: “Apart from high-tech and export sectors, the Chinese economy is very cold.” The producer price index has fallen for 41 consecutive months since October 2022 — a textbook sign of deflationary overcapacity. Some economists describe this as “Japanification”: prolonged deflation, declining investment returns, and a debt overhang — except that China’s greater dependence on real estate, local government financing vehicles, and exports makes the structural comparison more severe than Japan’s experience from the 1990s.
The Semiconductor Bet: Strategic Necessity and Competitive Exposure
Beijing’s response to the consumption deficit is to accelerate investment in industries deemed strategically vital: semiconductors, AI, electric vehicles, batteries, and green energy. The 15th Five-Year Plan explicitly frames this as building “New Quality Production Forces” — a move away from cheap manufactured goods toward technological self-sufficiency.
Progress is real but uneven. SMIC and Hua Hong are advancing at mature-node chip production, used in vehicles and industrial equipment. Equipment vendors Naura and AMEC are gaining global market share in manufacturing tools. Tungsten — a chipmaking input China controls at 79% of global mine production — has seen export controls imposed, pushing tungsten prices up 557% in just over a year.
Yet China imported a record $135 billion in semiconductors in a single quarter, driven by surging AI investment. Dependency on advanced foreign chips — particularly Nvidia’s H200 GPUs — remains acute. The path to true semiconductor self-sufficiency runs through advanced lithography technology that China has not yet replicated, and through memory chip manufacturing where domestic producer CXMT is still racing to achieve viable high-bandwidth memory yields.
The Rebalancing Trap
The structural paradox Beijing faces is that the industries it is investing in to generate new growth — semiconductors, AI, renewable energy — are highly capital-intensive and relatively employment-light. They generate industrial output and export revenue. They do not, by themselves, create the mass consumer purchasing power needed to rebalance toward domestic demand. As the Asia Society Policy Institute has documented, China’s capital-intensive industrial push could widen income inequality even as it advances national technological capacity, leaving the rural and lower-income population increasingly detached from the growth being generated.
Until Chinese households recover confidence in property as a store of value, until youth unemployment — officially 17% but widely estimated closer to 40% by independent economists — materially declines, and until local government debt overhangs are resolved, the consumer-led rebalancing that global markets have been anticipating for a decade will remain deferred.
The world’s second-largest economy, in 2026, is a machine that produces extraordinary technology and exports it to a world not fully ready to absorb the volume — while the domestic audience watches from the sidelines.
Discover more from The Economy
Subscribe to get the latest posts sent to your email.
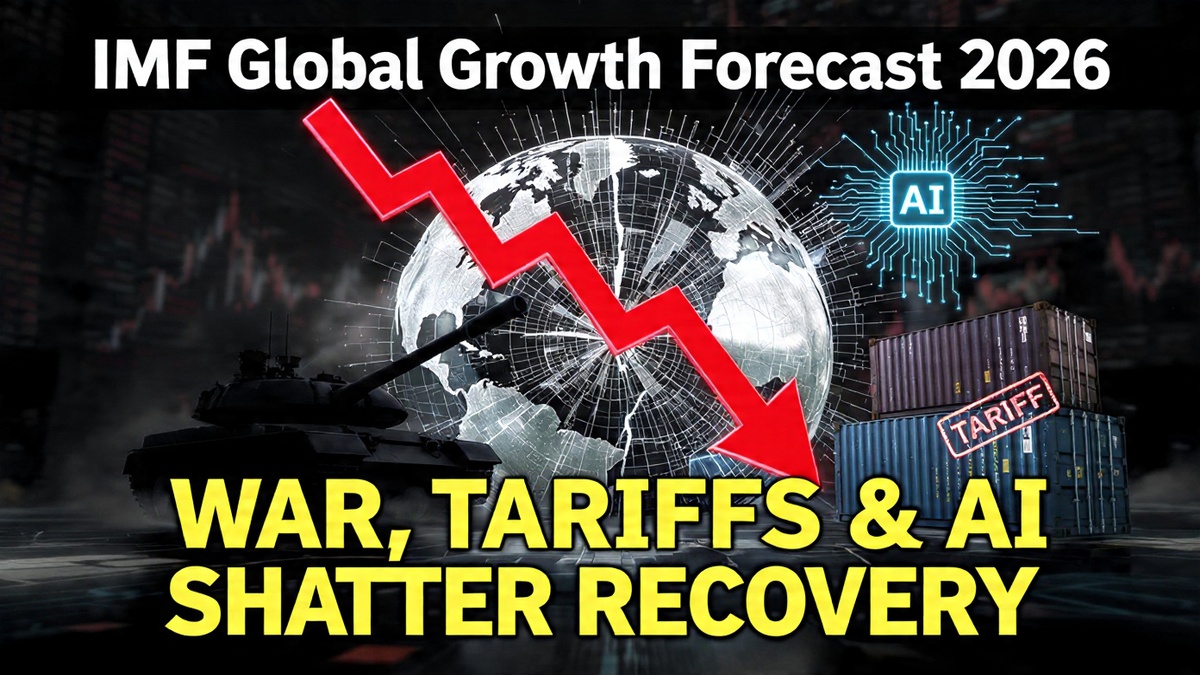
The IMF cut its 2026 global growth forecast to 3.1% as the Iran war, renewed US tariff threats, and AI investment uncertainty converge. Inside the most fragile global economic outlook since COVID.
The International Monetary Fund’s April 2026 World Economic Outlook carried an unusually sober subtitle: Global Economy in the Shadow of War. It was not rhetorical flourish. The Fund revised its global growth forecast to 3.1%, down from 3.4% in 2025, describing the path ahead as “fragile and highly sensitive to further disruption.” For a global economy already navigating post-pandemic fiscal consolidation, residual supply chain reorganisation, and the early strains of AI-driven labour displacement, the additional weight of a major Middle East war proved decisive in shifting the risk calculus.
Three Shocks Arriving Simultaneously
The IMF identified three overlapping risks that distinguish 2026’s fragility from prior cycles. First, the geopolitical shock: the US-Israeli war on Iran, which disrupted Strait of Hormuz oil flows, triggered inflation across energy-dependent economies, and introduced military escalation scenarios that financial markets struggled to price. Second, trade policy uncertainty: the Trump administration’s inauguration of an investigation into 60 countries for alleged facilitation of forced-labour imports — including the European Union — with tariffs of 10-12.5% threatened on their exports to the United States. Third, AI investment uncertainty: the possibility that the large AI productivity gains priced into equity markets may arrive more slowly, or be more concentrated, than consensus assumes.
The Financial Stability Board’s Warning on War Risk
The Financial Stability Board — comprising central bankers, regulators, and finance ministers from G20 countries — warned that the Middle East conflict was creating significant global financial instability, with rising market volatility, tighter financial conditions, and risks from stretched asset valuations, high leverage in non-bank finance, and liquidity mismatches. The FSB explicitly flagged that these vulnerabilities could amplify shocks in sovereign bond markets, private credit, and broader financial stability if conditions deteriorated.
Against this backdrop, Goldman Sachs documented hedge funds buying a record $86 billion in stocks over five sessions — a surge driven mainly by systematic, trend-following strategies responding to easing geopolitical tensions. The bank estimated funds could add another $70 billion if momentum continued. The divergence between systematic strategy positioning and the IMF’s fundamental outlook captured the market’s central tension: short-term momentum traders on one side, long-term structural risk assessors on the other.
Regional Divergence: Banks Profit, Emerging Markets Struggle
Major US banks delivered first-quarter earnings that reflected institutional resilience rather than broader economic health. Goldman Sachs posted its best quarter in years. Morgan Stanley’s stock traders benefited from volatility-driven volume surges. Bank of America reported earnings growth driven by higher trading revenue. The “big six” US banks collectively posted profits above consensus estimates — a pattern that reflects how institutional financial businesses often benefit from the very volatility that damages real-economy participants.
South Korea’s financial markets, after a sharp March selloff, attracted returning foreign investors on easing Middle East tensions, AI-driven tech demand, and reform momentum. But the won remained near multi-decade lows, and the economy retained significant exposure to energy price shocks. UK lenders began cutting fixed mortgage rates as swap rates fell following the stabilisation of Middle East tensions — offering relief to borrowers, though rates remained elevated relative to pre-crisis levels.
The divergence between institutional financial performance and household economic wellbeing is one of 2026’s defining features. Financial markets can absorb, price, and even profit from uncertainty. Households and small businesses, lacking the hedging tools and balance sheet depth of institutions, bear the uncertainty without corresponding offset.
Discover more from The Economy
Subscribe to get the latest posts sent to your email.
Economic Reforms
Argentina Economy 2026: Milei’s Fiscal Surplus, Inflation Drop to 29%, and What Comes Next

Argentina has achieved its first primary fiscal surplus in over a decade and cut inflation from 300% to a projected 29.4% in 2025. But the structural challenge of 2026 tests whether the transformation is real.No economy in the world has undergone a more dramatic reversal in such a compressed timeframe — and no economy in the world inspires more analytical caution about whether that reversal will hold.
Argentina enters the second half of 2026 having achieved something that eluded every previous government for over a decade: a primary fiscal surplus of 1.8% of GDP, maintained through austerity measures, deregulation, and structural reforms that President Javier Milei forced through against sustained political opposition. Inflation, which peaked near 300% in 2024 — one of the highest rates recorded by any major economy in modern history — is projected to fall to 29.4% in 2025 and 13.7% in 2026, a disinflation trajectory that most conventional economists did not believe was achievable without a social or political rupture.
The Policy Architecture That Produced the Turnaround
Milei‘s programme launched in December 2023 combined fiscal consolidation, the elimination of central bank monetary financing, and a managed exchange-rate regime that began with a sharp devaluation and continued with a gradual crawl to anchor inflation expectations. The approach was deliberately abrupt — a shock therapy designed to quickly eliminate the deficit that had sustained years of money printing and debt accumulation.
Deloitte’s 2026 global economic outlook characterises the result as “two years of profound macroeconomic adjustment that reshaped its policy framework and restored a degree of stability to an economy long challenged by chronic imbalances.” Monthly inflation, which had been running at rates exceeding 20% per month at the peak, had stabilised to approximately 2% by late 2025 — still elevated by international standards, but representing a near-complete dismantling of the hyperinflationary momentum that had been building for years.
The nominal anchors that have underpinned this disinflation include tight monetary policy from the central bank, the crawling peg exchange rate regime, and credible commitment to the fiscal surplus as a non-negotiable political line. The international investment community has responded: Argentine sovereign spreads have narrowed materially, and the country’s ability to access capital markets — previously constrained by its serial default history — has improved.
What Structural Reforms and Deregulation Have Changed
Beyond the macroeconomic stabilisation, Milei has pursued a broader structural reform agenda encompassing labour market deregulation, privatisation of state enterprises, elimination of energy subsidies, and reductions in public employment. These reforms carry distributional consequences — real wages fell sharply during the adjustment period, and social safety nets came under pressure — but Milei argued that the alternative was economic collapse rather than a managed adjustment.
The political durability of this programme remains the central uncertainty. Argentina has a long history of economic reform cycles that stabilise inflation and public finances in the short run before unravelling under political pressure, social protest, or an adverse external shock. The Iran war-related global slowdown represents exactly the kind of external headwind that has historically tested the resilience of Argentine stabilisation programmes — higher commodity prices support agricultural export revenues (a tailwind) but global demand uncertainty weighs on growth prospects.
The 2026 Challenge: Converting Stabilisation to Growth
Stabilisation is not growth. The Milei programme has restored macroeconomic credibility but the private investment and productivity gains that translate credibility into sustainable prosperity require additional time and policy continuity. Deloitte notes that the 2026 economic trajectory will rely on whether “other drivers” of demand beyond inventory rebuilding can sustain momentum — export diversification, foreign direct investment, and domestic consumption recovery all remain works in progress.
The comparison that Milei’s critics and supporters both invoke is Chile in the 1970s and 1980s, where a comparable shock therapy produced long-run macroeconomic stability at significant short-term social cost. The comparison that Milei’s critics prefer is the Argentine convertibility programme of the 1990s, which also achieved price stability and fiscal balance before collapsing in the 2001 default crisis. The distinction between the two outcomes depends on variables — debt dynamics, exchange rate flexibility, and external conditions — that will not be resolved in 2026.
The Lesson Argentina Offers Emerging Markets
Whether or not Argentina‘s transformation proves durable, the speed and scale of the disinflation has attracted analytical attention from economists studying how much inflation can be unwound through institutional commitment and fiscal discipline alone. The answer in Argentina’s case — from 300% to a projected 13.7% within approximately two years — challenges some prior assumptions about the minimum time horizon required for disinflation.
Deloitte’s global team places Argentina alongside France, Germany, and the US in their comparative country outlooks — a recognition that this formerly crisis-ridden economy is now generating analysis that other nations find instructive rather than merely cautionary. The hardest part of Argentina‘s economic story may not be what has already happened. It may be what sustaining the turnaround requires in 2027 and beyond.
Discover more from The Economy
Subscribe to get the latest posts sent to your email.

Global Economic Outlook June 2026: Trade Fragmentation Bites

SpaceX IPO 2026: Inside the $2 Trillion Valuation That Remade Wall Street

Kevin Warsh’s Regime Change: The Federal Reserve in the Age of War, Inflation, and Political Pressure

Private Credit Crisis 2026: $3 Trillion Shadow Market Faces Its Biggest Test

US-Iran War Economic Impact 2026: Hormuz Shock, Stagflation Risk, and the Global Recession Threat

China Economy 2026: Semiconductor Surge, Weak Consumption, and the Rebalancing Trap

GENIUS Act 2026: The New Global Payments Architecture

Agentic AI Banking 2026: Autonomous Agents in Trading, Compliance, and Credit — Risks and Opportunities

IMF Global Growth Forecast 2026: War, Tariffs, and AI Uncertainty Shatter the Recovery

US-China Semiconductor War 2026: Bifurcation, Tungsten Shock, and the Race for AI Chips

Salt Is the New Oil: Critical Minerals, the 2026 Investment Playbook

AI Infrastructure Debt Bubble 2026: $570 Billion in Global Debt Issuance Raises Systemic Risk Alarm

Argentina Economy 2026: Milei’s Fiscal Surplus, Inflation Drop to 29%, and What Comes Next

Global Economic Growth 2026: World Bank Cuts Forecast to 2.5%

PwC China Partner Payouts Cut Amid Evergrande Audit Fraud

Broadcom Market Value Loss: Revenue Forecast Disappoints

Investors Pile Into Bullish Dollar Bets as ‘US Exceptionalism’ Trade Returns

Here’s How Much It’ll Cost You to Be Part of SpaceX’s Record-Breaking $75 Billion IPO

Nasdaq Tumbles 4% as Chip and Memory Stocks Sink: A $1.2 Trillion Wipeout

How to Fix Pakistan’s Debt Economy: A Structural Blueprint

Smash Capital Leads $200M Funding for Allen Control Systems

Democrats Draw a Red Line Around Military AI — And the Pentagon Is Already Pushing Back

New Investment Super-Cycle: AI, Green Energy & Re-Shoring

Grinding the Already Ground: Pakistan’s Inflation Crisis

Xponential Fitness Franchise Lawsuit: The $3.97M Judgment

Middle East Conflict Oil Prices: The $4 Surge Explained

The End of the Chatbot: Why OpenAI is Tearing Up Its Most Successful Product

Musk’s SpaceX Lines Up Retail Investors for Record IPO Allocation
-

 Markets & Finance6 months ago
Top 15 Stocks for Investment in 2026 in PSX: Your Complete Guide to Pakistan’s Best Investment Opportunities
-

 Analysis4 months ago
Top 10 Stocks for Investment in PSX for Quick Returns in 2026
-

 Analysis5 months ago
Brazil’s Rare Earth Race: US, EU, and China Compete for Critical Minerals as Tensions Rise
-

 Analysis4 months ago
Johor’s Investment Boom: The Hidden Costs Behind Malaysia’s Most Ambitious Economic Surge
-

 Banks5 months ago
Best Investments in Pakistan 2026: Top 10 Low-Price Shares and Long-Term Picks for the PSX
-

 Investment6 months ago
Top 10 Mutual Fund Managers in Pakistan for Investment in 2026: A Comprehensive Guide for Optimal Returns
-

 Global Economy6 months ago
15 Most Lucrative Sectors for Investment in Pakistan: A 2025 Data-Driven Analysis
-

 Global Economy6 months ago
Pakistan’s Export Goldmine: 10 Game-Changing Markets Where Pakistani Businesses Are Winning Big in 2025