
Analysis
Johor’s Investment Boom: The Hidden Costs Behind Malaysia’s Most Ambitious Economic Surge

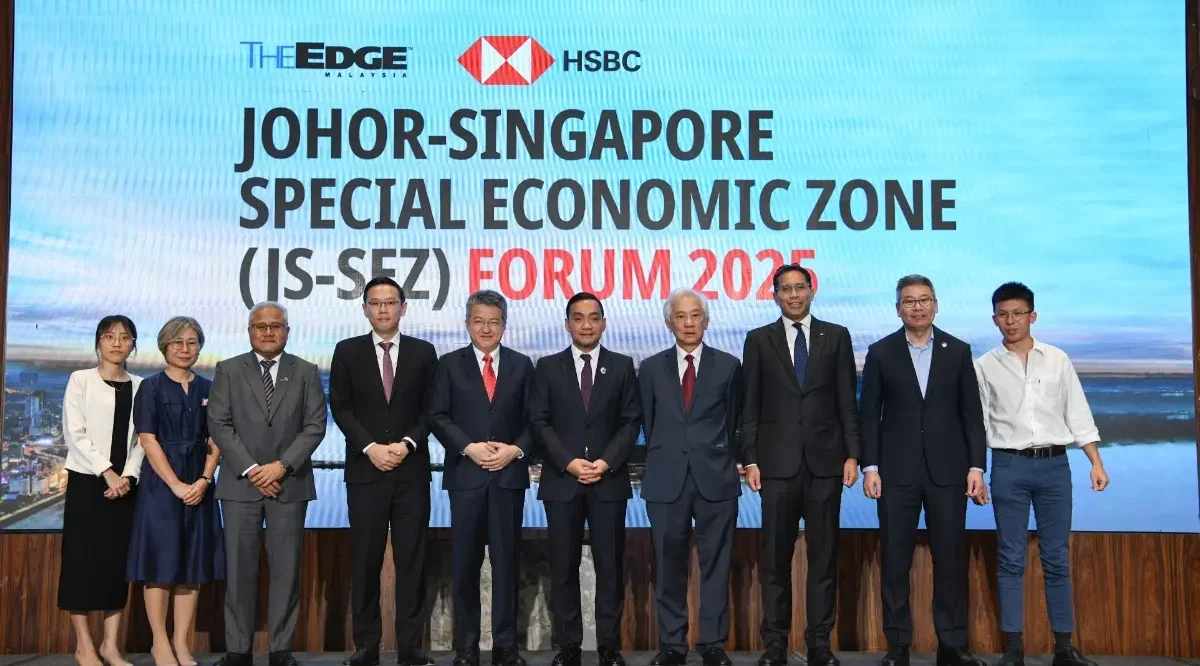
Johor’s record RM91.1B investment boom is reshaping Malaysia’s south—but soaring rents, food prices, and traffic are testing residents’ resilience. Here’s the full picture.
Rising rents, “Singapore pricing,” and a cup of kopi that no longer costs what it used to—Johor’s dazzling economic transformation is extracting a toll from the very people it promised to lift.
Fatimah has been running her kopitiam in Johor Bahru’s old town for nineteen years. She remembers when a cup of kopi-o cost 80 sen and regulars would linger for hours, reading newspapers and trading gossip about life across the Causeway. These days, that same cup costs RM2.50—and some of her competitors near the new commercial strips are charging closer to RM4. Her rent has nearly doubled in three years. Her breakfast crowd has thinned, not because people are less hungry, but because many of her regulars have quietly relocated to suburban neighborhoods farther from the city center, chasing the affordable ordinariness that downtown Johor Bahru can no longer reliably provide.
“People keep telling me this is good for Johor,” she says, refilling a customer’s glass. “Maybe. But good for who, exactly?”
It is a question that hangs over Malaysia’s most dazzling economic story of the decade—and one that policymakers, investors, and economists are only beginning to answer with the rigor it deserves.
The Engines of Growth: FDI, Data Centers, and the JS-SEZ
The numbers are, by any measure, extraordinary. As reported by Bernama, Johor recorded RM91.1 billion in approved investments through the first three quarters of 2025 alone—surpassing the combined investment totals of 2023 (RM43 billion) and 2024 (RM48.5 billion) in a single year. The state is on track to breach RM100 billion for the full year, cementing its position as Malaysia’s top investment destination and leaving Selangor (RM51.9 billion) and Kuala Lumpur (RM45 billion) well behind.
The architecture of this boom rests on three pillars. First, the Johor–Singapore Special Economic Zone (JS-SEZ), formally established on January 8, 2025, spans 3,288 square kilometers across nine flagship areas straddling Iskandar Malaysia and Pengerang—a footprint nearly five times the size of Singapore and almost double that of Shenzhen. As JLL Malaysia’s research highlights, the zone targets eleven priority sectors, from advanced manufacturing and logistics to the digital economy and healthcare. The bilateral framework offers tax incentives, streamlined regulatory clearance, and a special visa pathway for skilled workers and investors.
Second, the data center boom has turned Johor into one of Southeast Asia’s most coveted digital real estate markets. Google, Microsoft, and Nvidia have collectively committed over $20 billion in regional tech infrastructure, with significant portions anchored in Johor. ByteDance’s AI-focused data center at Sedenak Tech Park in Kulai has already gone live. According to FactSet Insights, combined planned data center power capacity across Johor, Kuala Lumpur, and Singapore is projected to reach 21 GW—a figure that underscores the region’s ambitions as Asia’s next hyperscale corridor.
Third, the Rapid Transit System (RTS) Link—a 4-kilometer rail crossing between Johor Bahru and Singapore due to open in late 2026—will carry 10,000 passengers per hour, cutting cross-border travel time to a mere six minutes. That single infrastructure project, perhaps more than any other, is reshaping Johor’s economic identity from a peripheral manufacturing zone into an integrated urban economy tethered to one of the world’s most productive city-states.
The macroeconomic ambition is equally bold. Johor’s state government has publicly targeted a doubling of GDP to RM260 billion by 2030. Nomura’s projection of 5.2% GDP growth for Malaysia in 2026, alongside AMRO Asia’s bullish regional outlook, provides favorable tailwinds. Fortune has noted that Malaysia broadly sees 2026 as a year of “execution”—and nowhere is that pressure more acutely felt than in Johor, where the scaffolding of ambition has been erected with remarkable speed.
“This is not about competing with Penang or Selangor,” Natazha Harris, chief executive of Invest Johor, told The Business Times. “It’s about complementing existing hubs—especially where companies need space to scale.”
The Human Cost: Rising Rents, “Singapore Pricing,” and a Cup That Costs More
But the view from Fatimah’s kopitiam tells a different story—one that investment promotion brochures rarely include.
As Malay Mail reported in February 2026, Johor Bahru residents say they are being “priced out” of their own city, particularly in downtown areas where the spending power of cross-border shoppers from Singapore has driven up the cost of everyday goods. The phenomenon has acquired its own vernacular: “Singapore pricing.” During the Chinese New Year 2026 season, local foot traffic in traditional commercial districts visibly declined, with residents pivoting toward suburban hypermarkets and e-commerce platforms to manage household budgets.
The macroeconomic data validates the anecdote. Johor recorded the highest inflation rate among all Malaysian states in December 2025—2.3 percent, well above the national average. Sunway University economics professor Yeah Kim Leng attributes part of this to anticipatory behavior: businesses are raising wages and prices in expectation of JS-SEZ-related demand, even before much of that demand has fully materialized. This forward-looking inflation is particularly insidious because it front-loads the costs of development onto existing residents while the benefits—higher wages, better jobs, improved public services—remain largely in the pipeline.
The property market tells a similarly uncomfortable story. JLL Malaysia’s mid-2025 research found that average transaction prices for serviced apartments in Johor Bahru surged 20.4 percent in Q2 2025 compared to the 2024 average. Double-storey terrace houses rose 8.6 percent over the same period. Some condominiums in RTS-adjacent corridors have appreciated 40 to 50 percent since 2020. Office rents that once hovered around RM4 per square foot are now touching RM5.80 in prime locations.
The rental market has been even less forgiving. With rental yields averaging 6 to 8 percent in city-center locations—attractive benchmarks for investors—landlords have little incentive to hold prices steady. For young professionals earning local wages, the math has become increasingly punishing. A two-bedroom apartment that rented for RM1,200 per month in 2022 may now command RM1,900 or more.
The Price of Progress: Then vs. Now
| Item | Pre-Boom (2022) | Early 2026 | Change |
|---|---|---|---|
| Kopi-O (kopitiam) | RM0.80–RM1.20 | RM2.00–RM4.00 | +150–230% |
| Hawker meal (basic) | RM5–RM7 | RM7–RM12 | +40–70% |
| 2BR apartment rent (central JB) | RM1,100–RM1,300/mo | RM1,700–RM2,100/mo | +55–65% |
| Office space (Grade A) | RM4 psf/mo | RM5.50–RM5.80 psf/mo | +38–45% |
| Serviced apartment price (avg) | Baseline 2024 avg | +20.4% (Q2 2025) | Surging |
Sources: JLL Malaysia, Malay Mail, The Straits Times, field reports
Invest Johor’s Natazha Harris has acknowledged the friction with disarming candor: “It’s the price we pay for progress. The first thing you notice is heavier traffic. More people are coming in. And rentals are going up.” He noted that the state government has introduced targeted assistance programs to cushion the impact—though critics argue those cushions are thin relative to the velocity of price increases.
Infrastructure Under Strain: The Invisible Tax on Daily Life
Beyond rent and food prices, Johor residents are paying an invisible tax measured in hours lost to traffic congestion—and the psychological toll of living in a city whose infrastructure was not designed for the pace of growth now being demanded of it.
The main Causeway and the Second Link connecting Johor Bahru to Singapore were already under severe pressure before the JS-SEZ era began. Cross-border vehicle queues that once cleared in forty-five minutes now routinely extend to two hours or more during peak periods. As Reed Smith’s mid-2025 analysis notes, the RTS Link’s anticipated capacity of 10,000 passengers per hour should relieve some of this burden when it opens in late 2026—but the construction period itself has added disruption, and the link’s catchment area is geographically limited.
The state government has proposed an Autonomous Rapid Transit (ART) system with 32 stations across three key corridors—Skudai, Tebrau, and Iskandar Puteri—to be implemented via public-private partnership. An electrified double-track rail extension will eventually cut Kuala Lumpur–Johor Bahru travel time to four hours. These are credible, well-conceived infrastructure responses. But infrastructure, by its nature, lags the demand that necessitates it. For residents navigating morning commutes today, the ART is a 2027 or 2028 reality.
Energy is another pressure point. According to Reed Smith’s analysis, insufficient electricity supply had already forced the deferment of nearly 30 percent of 2024 data center proposals in Johor. Grid upgrades and potential ASEAN-level power exchange agreements are under consideration, but the gap between digital infrastructure demand and utility supply capacity represents a structural bottleneck that could slow the very boom investors are banking on—while raising electricity costs for ordinary consumers in the interim.
Key Challenges Facing Johor Residents in 2026
- Housing affordability crisis: Serviced apartment prices up 20.4% year-on-year; rental yields prioritizing investors over tenants
- “Singapore pricing” inflation: Johor’s 2.3% inflation rate highest in Malaysia; food prices up RM2–5 per item at downtown establishments
- Traffic congestion: Cross-border queue times regularly exceeding 2 hours; city road networks at capacity
- Energy infrastructure lag: 30% of 2024 data center proposals deferred due to power supply constraints
- Workforce displacement risk: Wages rising in anticipation of JS-SEZ, but unevenly—benefiting skilled workers while low-income residents face cost increases without wage gains
- Affordable housing undersupply: New property launches skewed toward premium segments targeting Singapore commuters and investors
The Tourism Dimension: When Affordable Becomes a Memory
Johor Bahru has long been a destination for Singaporean day-trippers drawn by the currency differential and the city’s reputation for affordable food, shopping, and entertainment. That value proposition is eroding. As The Straits Times has reported, Singaporean shoppers are increasingly noting that the gap between JB and Singapore prices—for meals, coffee, even groceries—has narrowed substantially. Some visitors report that the “cheap JB trip” of popular memory is becoming more myth than reality.
For the tourism economy, this is a double-edged development. Higher prices may deter the high-volume, low-margin visitor segment while attracting more premium tourism spending. But the transition is disorderly, and traditional hawker operators, coffeeshop owners, and independent retailers—the cultural fabric of Johor Bahru’s streetscape—are caught in a painful middle ground.
There is a deeper irony here that economists sometimes understate: the qualities that made Johor attractive—its affordability, its accessibility, its lack of Singapore’s expensive formality—are precisely what is being consumed by the boom itself.
Balancing Act: Opportunities Amid the Disruption
It would be analytically incomplete to frame Johor’s transformation purely as a story of burden. The investment surge is creating real opportunities that deserve equal weight.
As MIDA’s data confirms, Malaysia’s approved investments in the first half of 2025 were expected to generate over 89,000 new jobs nationally, with Johor as the leading contributor. The JS-SEZ’s special visa and work permit schemes are designed to funnel high-skilled employment into the corridor. Johor has set a minimum salary of RM4,000 for skilled talent—a benchmark that, if widely implemented, would represent a meaningful wage floor uplift.
The private capital data is encouraging too. FactSet’s analysis shows total deal value in the JS-SEZ corridor rising from $56.3 billion in 2024 to $57.5 billion in 2025, even as overall deal volume fell—a sign of larger, higher-conviction investments rather than speculative churn. For property owners (as opposed to renters), the capital appreciation has been substantial. For skilled professionals in digital, manufacturing, and logistics sectors, Johor’s labor market has rarely been more competitive.
The New Straits Times has highlighted that even the previously stubborn property overhang problem—thousands of unsold units that once blighted Johor’s market—has largely resolved itself, with over 3,000 overhang units absorbed in the past year alone. That is not a trivial indicator of genuine underlying demand.
Natazha Harris frames the state’s position with tempered optimism: “This is about speed, certainty and coordination. That’s what investors care about once they’ve made the decision to commit.” The Johor state government, working in concert with federal agencies like MIDA and IRDA, has built a coordination infrastructure that investors across Asia—including a growing cohort of Chinese manufacturers exploring regional diversification—are finding unusually responsive.
Conclusion: Progress Must Earn Its Name
Johor is at an inflection point that Malaysia has rarely seen outside of Kuala Lumpur’s late-1990s construction frenzy or Penang’s semiconductor ascent. The scale of capital arriving—RM91.1 billion in nine months, tech giants committing decades-long infrastructure—is not noise. It is structural. And the Johor-Singapore Special Economic Zone, if its ambitions are realized, could genuinely redraw the economic geography of Southeast Asia.
But progress that is not deliberately shared is not progress—it is displacement rebranded.
Fatimah’s kopitiam, and the thousands of small establishments like it that constitute the social infrastructure of Johor Bahru, is not a footnote to this story. It is the story, in the way that the stories of ordinary people always ultimately are. The question Johor’s policymakers must answer—with policy instruments rather than platitudes—is whether the boom’s dividends can be channeled downward with the same efficiency that foreign capital has been channeled inward.
Concretely, this means expanding the affordable housing pipeline beyond premium segments; deploying cost-of-living assistance that is means-tested and substantial rather than symbolic; accelerating the ART and RTS infrastructure timelines to reduce the congestion tax on working residents; and establishing transparent wage benchmarking mechanisms so that labor market benefits of the JS-SEZ are not captured exclusively by the already-skilled.
Nomura’s projection of 5.2% growth for Malaysia in 2026 is achievable. Johor’s ambition to reach RM260 billion in GDP by 2030 may well be, too. But the most important metric—the one that will determine whether this era is remembered as a genuine leap forward or a cautionary tale about unmanaged urbanization—is whether the people of Johor can still afford to live, work, and linger over a cup of kopi in the city they built.
That affordability, once lost, is very hard to recover. And the time to protect it is now, while the investment wave is still rising and policy still has room to shape its course.
Discover more from The Economy
Subscribe to get the latest posts sent to your email.



Key Takeaways
- Rolex’s secondary market rose approximately 7.9% year-over-year as of 2026 (per WatchCharts data) — trailing Patek Philippe (+16.2%) and Tudor (+11.4%) but still outperforming Audemars Piguet (+3.4%).
- Rolex raised U.S. retail prices 4–9% in January 2026 (steel models ~5.6%, gold models ~8.7%), narrowing the historical gap between retail and pre-owned pricing.
- Not every model appreciates: steel sports references (Submariner, GMT-Master II, Daytona) have held value far better than two-tone or widely available dress references like the standard Datejust.
- The Lady-Datejust posted the sharpest 2026 gain among tracked collections — up 22.73%, from roughly $9,269 to $11,376 — driven by demand for smaller, “everyday luxury” watches.
- Gold’s rise past $2,400/oz has directly lifted the investment case for Rolex’s precious-metal references (Day-Date, Sky-Dweller, Yacht-Master).
The Model-by-Model Picture
| Category | 2026 Trend |
|---|---|
| Lady-Datejust | +22.73% (strongest performer among tracked collections) |
| Steel sports models (Submariner, GMT-Master II) | Held value well; corrected from 2022 peak but stabilized above retail |
| Daytona | Corrected from highs above $50,000 to the mid-$30,000s; still among the most sought-after references |
| Two-tone/widely available Datejust | Flat to negative — “holds value” is an overstatement for this category |
| Gold references (Day-Date, Sky-Dweller) | Lifted by gold’s rise above $2,400/oz |
Why the “Rolex Always Appreciates” Myth Is Fading
The pandemic-era boom pushed some references — the Daytona above all — to speculative highs disconnected from historical norms. Since the March 2022 peak, steel sports models have compressed meaningfully, and dealers who bought inventory near the top have in some cases faced 20–40% markdowns on liquidation. The lesson for 2026 buyers: Rolex as a category is not a monolith. Value retention depends heavily on specific reference, condition, and whether the piece comes with box and papers (“full set”).
What’s Actually Driving 2026 Strength
- Retail price increases raise the floor. When a new Submariner retails at $10,050 (up from $9,500), a pre-owned example at $11,000–$12,000 suddenly represents a smaller premium — narrowing the gap without secondary prices actually moving.
- Supply discipline remains Rolex’s core lever. The brand has never confirmed production numbers, and secondary-market premiums remain entirely a function of Rolex’s own manufacturing decisions — a risk factor as much as a support.
- Certified Pre-Owned rollout. Rolex’s now fully rolled-out CPO program has changed how buyers transact in the used market, adding a layer of brand-verified legitimacy that supports pricing.
The Case for Rolex as a Portfolio Diversifier
Financial advisors increasingly frame luxury watches not as a replacement for equities or bonds, but as a tangible, historically low-correlation diversifier — one that carries its own risks (illiquidity, condition-dependent pricing, no yield) but has demonstrated multi-decade resilience for specific references.
Is Rolex a good investment in 2026?
It depends heavily on the specific reference. Steel sports models like the Submariner and Daytona have held or grown in value; two-tone and widely available dress models generally have not. Overall, Rolex’s secondary market rose about 7.9% year-over-year in 2026, trailing Patek Philippe but ahead of Audemars Piguet.
Discover more from The Economy
Subscribe to get the latest posts sent to your email.

Navigating Mortgage and Loan Refinancing in a High-Yield Environment
Global public debt crossing critical thresholds has kept central bank policies volatile, resulting in fluctuating US Treasury yields throughout 2026. For homeowners and commercial property holders burdened by previous high-interest borrowing cycles, finding optimal refinance windows has become a high-stakes financial puzzle. Stalled disinflation and stubborn employment numbers mean rate cuts are incremental, requiring borrowers to act with precision.
Timing your mortgage or commercial loan refinance in this environment requires a deep understanding of yield curve movements and lender risk appetites.
Decoding 2026 Refinance Dynamics
The 10-Year Treasury Yield Benchmark
Mortgage rates continue to track closely with the 10-year US Treasury yield. When macroeconomic anxiety spikes debt issuance, yields rise, tightening consumer borrowing capacity. Savvy borrowers monitor weekly Treasury auctions to lock in rates during brief dip windows.
Hybrid ARMs and Alternative Structures
With fixed rates remaining elevated, 7/1 and 10/1 adjustable-rate mortgages (ARMs) have surged in popularity. These products offer lower initial monthly payments, giving borrowers breathing room until central bank easing cycles fully materialize.
| Loan Product | Current Rate Range | Best For | Key Risk Factor |
| 30-Year Fixed Mortgage | 6.2% – 6.8% | Long-term predictability | Higher initial monthly outlay |
| 7/1 Hybrid ARM | 5.5% – 5.9% | Short-term ownership / flipping | Rate reset risk after year 7 |
| Commercial Refinance | 7.0% – 8.2% | Corporate asset restructuring | Strict DSCR lender covenants |
Actionable Steps for Successful Refinancing
To maximize your chances of securing favorable refinance terms in a volatile market, follow a disciplined preparation strategy.
Boost Your Credit Score Immediately: Lenders in 2026 are applying stringent credit tiering; a 20-point increase can drop your APR by a crucial quarter-point.
Shop Regional Credit Unions: Smaller financial institutions often offer portfolio loans with more flexible underwriting than major national banks.
Calculate the Break-Even Point: Ensure your total closing costs are recouped through monthly savings within 24 months of closing.
“Market Strategist View: Refinancing in 2026 is an exercise in opportunistic timing. Borrowers must maintain immaculate financial profiles ready to strike the moment Treasury yields dip.”
Mastering the complexities of today’s debt environment ensures you can successfully lower your debt service costs and protect your long-term financial stability.
Discover more from The Economy
Subscribe to get the latest posts sent to your email.

The days of pulling generic auto insurance quotes based purely on your zip code and age are officially over. In 2026, insurance comparison engines are powered entirely by generative AI and real-time telematics. These platforms digest thousands of live data points—ranging from your driving smoothness via connected vehicle sensors to real-time traffic congestion patterns—to generate hyper-personalized premiums instantly.
For consumers, this evolution represents both a massive opportunity for savings and a hidden trap for penalty pricing. Understanding how AI algorithms evaluate risk is essential for anyone looking to lower their monthly auto insurance premiums.
How AI Comparison Engines Evaluate Your Risk Profile
Behavioral Telematics and Connected Cars
Modern cars stream performance data directly to insurance aggregators. Generative AI models analyze braking sharpness, acceleration curves, cornering G-forces, and phone distraction metrics. Drivers who maintain smooth, defensive habits are rewarded with dynamic rate cuts of up to 40% compared to traditional rating tiers.
Predictive Traffic and Weather Modeling
AI tools now cross-reference your daily commute route with predictive weather and accident probability models. If your standard parking location or driving corridor has a statistically higher incidence of uninsured motorist claims, your quotes will reflect that hyper-local risk assessment.
| Comparison Factor | Traditional Rating Model | 2026 Generative AI Model | Impact on Premium |
| Mileage & Usage | Annual estimated odometer reading | GPS tracking & live trip duration | High (up to 35% savings) |
| Driving Behavior | MVR driving record & accidents | Real-time braking, speed, & G-force | Critical (determines tier) |
| Vehicle Tech | Make, model, and safety rating | ADAS calibration & repair cost data | Moderate |
Strategies to Lower Your AI-Driven Insurance Quote
To outsmart the algorithm and secure the lowest possible premium in 2026, drivers must proactively manage their digital footprint on insurance platforms.
Opt-In for Telematics Trial Periods: Many insurers offer immediate 15% discounts just for installing their driving app; let it track safe habits for 30 days to lock in permanent savings.
Scrub Unverified Public Records: Ensure your motor vehicle report is free of clerical errors that AI risk models misinterpret as reckless behavior.
Compare AI Aggregators: Use platforms that integrate multi-carrier API feeds rather than single-brand comparison sites to find the best risk-adjusted rate.
“Industry Note: AI-driven pricing rewards transparency and precision. Drivers who actively manage their telematics data consistently out-save those relying on legacy quote calculators.”
Embracing AI comparison tools allows savvy policyholders to customize coverage limits precisely to their driving habits, eliminating wasted premium spend while ensuring robust protection.
Discover more from The Economy
Subscribe to get the latest posts sent to your email.

Russia Sanctions Waiver: What Asian Oil Buyers Gain

Asia Markets Weekly: How Oil, US Yields and the Fed Reach Tokyo, Kuala Lumpur and Karachi

Gold Near $4,000: Buy, Hold or Wait? A Pakistan Tola Price Guide

US 10-Year Treasury Yield Near 5%: The Hidden Cost for Pakistani Investors

Fed Meeting on October 28: Hike or Hold—and Why Pakistan Investors Should Care

Can Pakistan Turn US–Iran Mediation Into an Economic Dividend?

Oil Above $100: How Higher Crude Prices Reach Pakistan’s Rupee, Petrol and Imports

SBP Interest Rate at 11.5%: What Will Decide Pakistan’s Next Policy Move?

The Global South: Debt, Climate Finance and Investment in 2026

Energy Security Is the New Economic Security

Can Global Tourism Survive Geopolitical Shocks?

Global Maritime Hegemony: How China Secured Over 81% of All New Shipbuilding Orders

The Coming Battle Over AI, Jobs and Wages

Why Developing Economies Face a Sharper Inflation Problem

Crude Oil & Petroleum Market Analysis: OPEC+ Decisions and Price Forecasts

Silver Price Today: Why the Xi-Trump AI Standoff Is Fueling a Safe-Haven Rally

Algorithmic Dogfights: Why the U.S. and China Must Establish Rules of Engagement for Autonomous Air Power

Top US Convenience Store Chains: Store Counts, EV Charging, and Sales Trends

Who Is Shivon Zilis? The Neuralink Executive at the Center of the Musk–OpenAI Trial

Social Security Extra $90 Deposit: Who Qualifies for the October 2026 Medicare Rebate?

Corporate America Faces a New Debt Test as US Borrowing Costs Surge

Global Economic Outlook 2026: 7 Forces Reshaping Markets, Trade and Business

Gold Falls 3.7% as Yields Surge: Is Gold Still a Safe Haven in 2026?

Stock Market Today: Dow, S&P 500, and Nasdaq Retreat as Treasury Yields

MAS Allocates S$1.45 Billion to Five Asset Managers in Third EQDP Batch: Total Deployment Reaches S$5.4 Billion

Anthropic Bans Sustained Abuse of Claude AI Under New Usage Policy Effective November 12, 2026

Gold Price Outlook 2026: The Forces Behind the Forecasts—and What Could Reverse Them

US 10-Year Yield Hits 5.24%: What the Historic Bond Market Sell off Means for Mortgages and Investors
-

 Markets & Finance10 months ago
Top 15 Stocks for Investment in 2026 in PSX: Your Complete Guide to Pakistan’s Best Investment Opportunities
-

 Analysis8 months ago
Top 10 Stocks for Investment in PSX for Quick Returns in 2026
-

 Banks9 months ago
Best Investments in Pakistan 2026: Top 10 Low-Price Shares and Long-Term Picks for the PSX
-

 Analysis9 months ago
Brazil’s Rare Earth Race: US, EU, and China Compete for Critical Minerals as Tensions Rise
-

 Investment10 months ago
Top 10 Mutual Fund Managers in Pakistan for Investment in 2026: A Comprehensive Guide for Optimal Returns
-

 Global Economy10 months ago
15 Most Lucrative Sectors for Investment in Pakistan: A 2025 Data-Driven Analysis
-

 Global Economy10 months ago
Pakistan’s Export Goldmine: 10 Game-Changing Markets Where Pakistani Businesses Are Winning Big in 2025
-

 Analysis8 months ago
Top 10 Countries with the World’s Strongest Currencies in 2026 — Ranked & Analysed