
Markets & Finance
Gold vs US Dollar vs Bitcoin in 2026: Inflation Hedge Compared

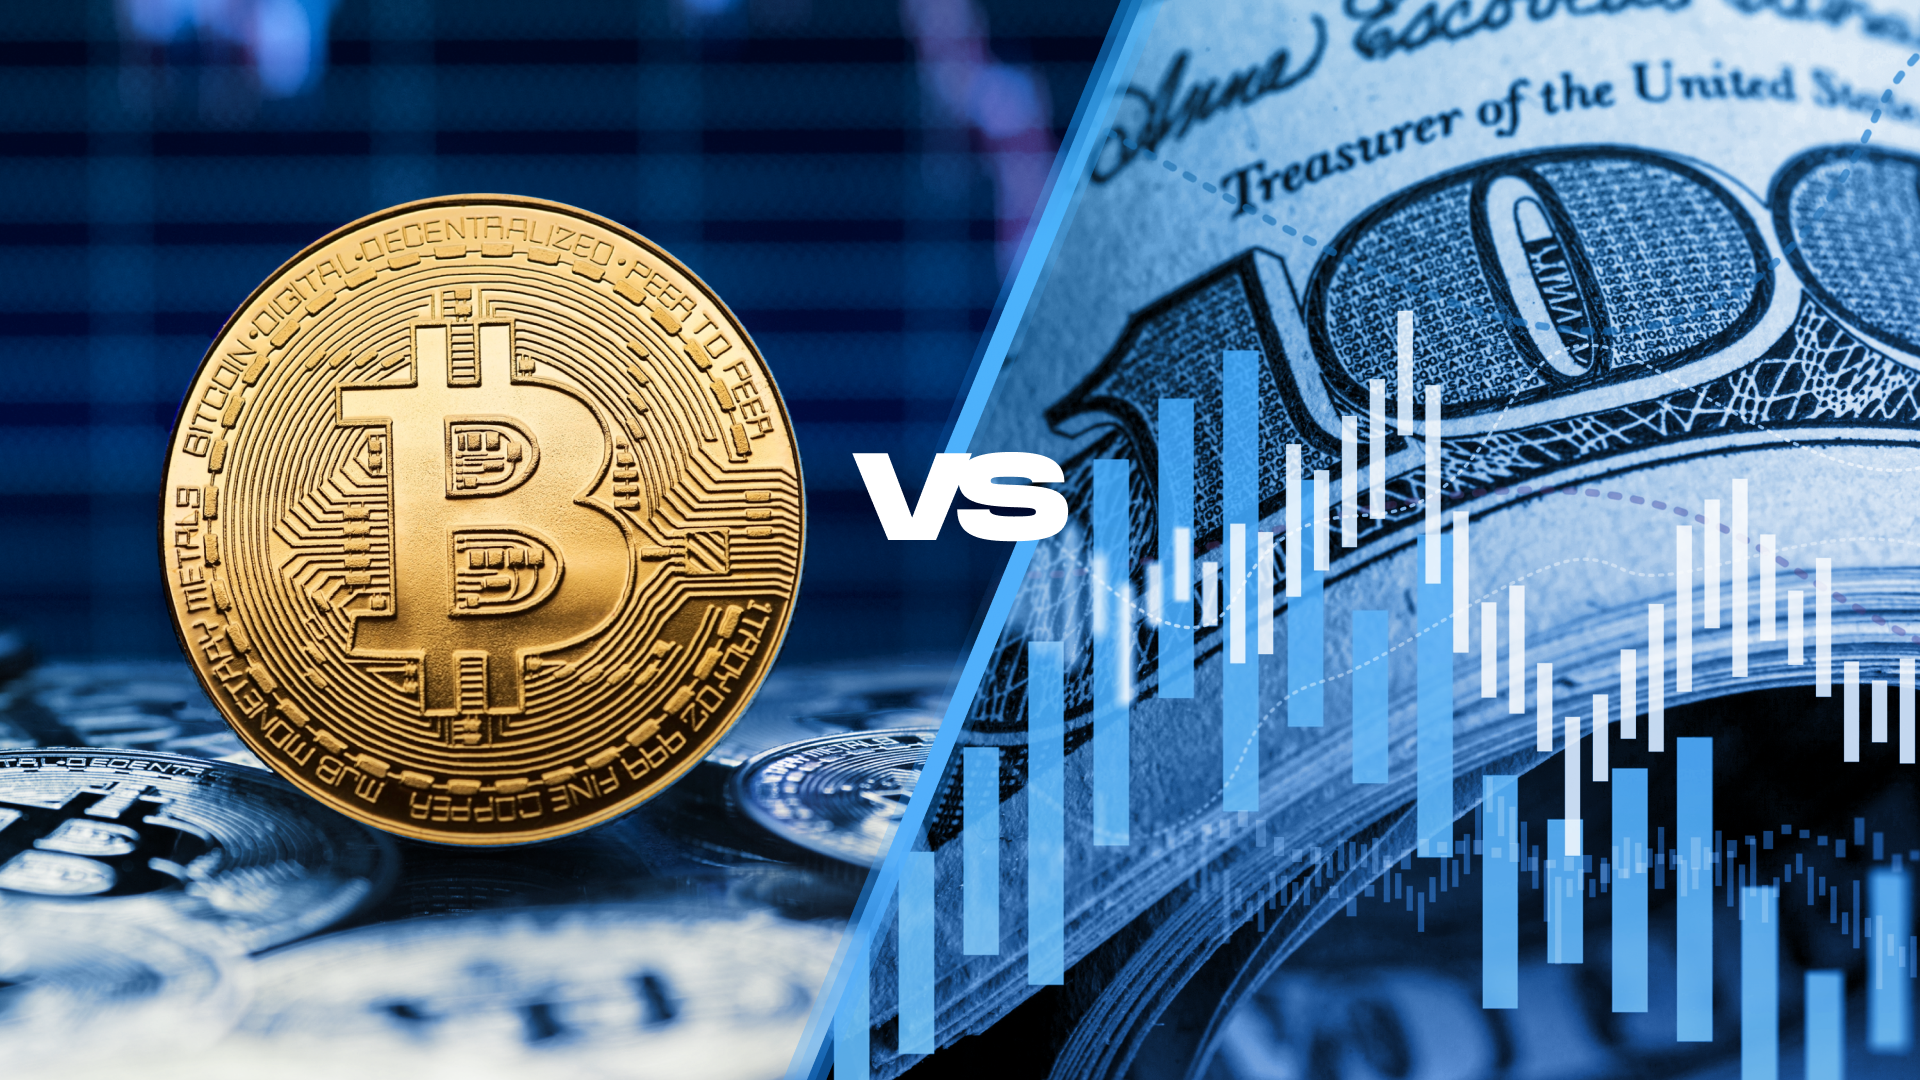
The global economic growth is becoming more uneven, capital is increasingly sensitive to financing costs, and investors must distinguish a convincing story from an investable price. This guide focuses on research methods and risks rather than predictions of guaranteed returns. The IMF October 2026 outlook projects 3.1% global growth and 4.7% inflation for 2026, while the IMF financial-stability assessment warns that market resilience coexists with important vulnerabilities.
Key takeaways
- Match each investment decision to its time horizon, currency and ability to withstand losses.
- Separate observable earnings or contractual cash flows from optimistic forecasts.
- Compare diversification, fees, taxes, liquidity and regulatory restrictions before committing capital.
- Track primary institutional evidence and update assumptions when conditions change.
- Readers in Pakistan should consider rupee exposure and availability of regulated investment channels.
Why this matters now
The central question behind gold vs dollar vs bitcoin 2026 is not merely what may happen next. It is which economic mechanisms could change cash flow, purchasing power or risk. The Bank for International Settlements’ 2026 review describes an economy supported by technological investment but constrained by geopolitical and fiscal pressures. A robust financial plan must therefore survive both a favourable and an adverse scenario.
Three assets, three different economic functions
Gold is a scarce physical asset without a contractual cash flow. The dollar is a currency used for transactions, reserve holdings and dollar liabilities; holding dollars is not the same as owning an inflation-protected investment. Bitcoin is a highly volatile digital asset whose long-run response to inflation cannot be assumed stable. The comparison depends on which inflation and which home currency the investor faces. See the primary institutional research.
For practical analysis, separate the baseline, the upside case and the downside case. Document the specific development that would change your assessment. Assess timing: a promising long-term theme may still be inappropriate for cash needed within twelve months.
Why gold has attracted investment demand
The World Gold Council reported resilient investment demand during 2026 and a recovery in central-bank purchasing in the second quarter. That is evidence of demand, not a promise of rising prices. Gold can fall when real interest rates rise, the dollar strengthens or investors liquidate positions. Storage, spreads and insurance matter for physical buyers. See the primary institutional research.
For practical analysis, separate the baseline, the upside case and the downside case. Document the specific development that would change your assessment. Assess timing: a promising long-term theme may still be inappropriate for cash needed within twelve months.
The dollar: liquidity versus purchasing power
Foreign-currency balances may reduce exposure to a depreciation of the investor’s home currency, but US inflation still erodes dollar purchasing power. Cash in a bank has different legal protection and returns from banknotes held privately. A Pakistani household paying future US-dollar tuition has a genuine dollar liability; a household buying groceries in rupees has different currency matching needs.
For practical analysis, separate the baseline, the upside case and the downside case. Document the specific development that would change your assessment. Assess timing: a promising long-term theme may still be inappropriate for cash needed within twelve months.
Bitcoin: upside narratives and drawdown risk
Bitcoin supply rules do not make its market price stable. Liquidity conditions, leverage, custody arrangements, regulatory changes and speculative activity can dominate short-run returns. Investor.gov warns that crypto assets involve substantial loss and fraud risks. Treat any allocation as a speculative risk decision, not a guaranteed inflation hedge. See the primary institutional research.
For practical analysis, separate the baseline, the upside case and the downside case. Document the specific development that would change your assessment. Assess timing: a promising long-term theme may still be inappropriate for cash needed within twelve months.
How to compare hedges in rupees
Measure the purchase price and exit value after exchange rates, fees and taxes. Consider the needed holding period and worst plausible drawdown. Diversification is more credible than trying to select one universally superior asset. The right benchmark is the real purchasing power of the specific future expense, not whichever asset had the best recent performance. See the primary institutional research.
For practical analysis, separate the baseline, the upside case and the downside case. Document the specific development that would change your assessment. Assess timing: a promising long-term theme may still be inappropriate for cash needed within twelve months.
Comparison and decision framework
| Question | Stronger evidence | Warning sign |
|---|---|---|
| What drives returns? | Audited cash flows, clear contract or transparent index | Undefined or projected returns |
| What can go wrong? | Explicit scenario and downside analysis | Claims of guaranteed gains |
| Is it affordable to hold? | Low transparent fees and adequate liquidity | Leverage, costly spreads or lockups |
| Is access legitimate? | Appropriate licensing and clear legal rights | Unverified brokers or custody |
| Is the exposure diversified? | Multiple independent sources of return | One company, sector or currency |
What it means for Pakistani savers and investors
A Pakistani reader faces both international investment risk and local purchasing-power risk. For example, a foreign asset can rise in US-dollar terms while the rupee conversion and transaction costs alter the realized local outcome. The opposite can also occur. Record the starting exchange rate, applicable taxes, custody charges and capital-transfer restrictions, and confirm current requirements with the State Bank of Pakistan and the relevant securities regulator. Overseas access should not be assumed universally available.
An emergency reserve, expensive consumer debt and near-term family obligations deserve attention before any speculative allocation. A portfolio that cannot meet a sudden cash requirement may force sales at the worst moment. The objective is not to remove risk—impossible in markets—but to choose risks that fit the investor’s actual liabilities.
Risks, limitations and uncertainty
Institutional forecasts are conditional and can change after policy decisions, commodity shocks, conflict escalation or unexpectedly weak earnings. Historic correlations are not binding promises about future asset performance. The analysis does not provide live stock prices, current investment product quotes, real-time exchange rates or individualized tax advice. Prices, regulations and product eligibility should be checked on the transaction date.
Frequently asked questions
Is this a guaranteed investment opportunity?
No. Every financial asset or strategy involves uncertainty. The existence of a popular investment theme is not evidence that an individual security is fairly priced.
What should beginners examine first?
Understand the product, the financial loss you could tolerate, fees and liquidity. Verify the provider and decide whether the money may be needed soon.
How do interest rates affect the analysis?
They influence financing costs, discount rates, exchange rates and demand. The effect differs by sector, maturity and business balance sheet.
Can Pakistani residents invest in foreign markets?
Access depends on current foreign-exchange, banking, brokerage, securities and tax rules, and on the investor’s individual circumstances. Check current regulations and regulated providers rather than assuming access.
How often should this analysis be refreshed?
Review institutional economic releases monthly and re-evaluate immediately after material earnings, regulatory or policy changes. Avoid reacting mechanically to every daily market movement.
Is diversification enough to prevent losses?
No. Diversification may reduce company-specific risk but cannot eliminate broad market, currency, inflation or systemic risks.
Conclusion
Sound financial decisions begin with verifiable evidence, reasonable valuation, awareness of uncertainty and a plan that survives adverse outcomes. Readers should compare multiple independent sources and avoid letting a compelling headline substitute for due diligence.
Discover more from The Economy
Subscribe to get the latest posts sent to your email.


Asia
Asia’s Economic Resilience in 2026: The Strategic Blueprint for Sustaining the Global Growth Engine

As global markets navigate a turbulent macroeconomic landscape defined by fluctuating energy costs, trade shifts, and rapid technological transformation, the Asia-Pacific region continues to act as the primary anchor for the world economy.
Recent data from the International Monetary Fund’s (IMF) October 2026 Regional Economic Outlook places Asia-Pacific growth at 4.8%. While this marks a minor moderation from previous years, it significantly outperforms baseline global metrics, establishing Asia as the source of nearly two-thirds of total global growth.
However, beneath this resilient headline figure lies a complex web of structural vulnerabilities and unprecedented opportunities. Can Asia sustain this momentum, or will external shocks compromise its long-term trajectory? This deep-dive analysis breaks down the core pillars driving Asia’s economy, exposes hidden structural risks, and outlines the definitive strategies required to outpace global competitors.
The Three Forces Shaping Modern Asian Economics
The current economic architecture of the Asia-Pacific region is driven by three competing vectors:
- The AI-Driven Tech Supercycle: Explosive demand for advanced semiconductors, automated solutions, and electronics manufacturing hubs (particularly spanning South Korea, Singapore, Malaysia, and Vietnam) has heavily offset sluggish consumption in Western markets.
- Persistent Energy Market Volatility: Geopolitical friction in the Middle East continues to pose direct threats to net energy importers. Because Asia consumes a disproportionate share of global oil and natural gas relative to its GDP, crude price fluctuations hit regional refiners and industrial supply chains harder than Europe or the Americas.
- Trade Reconfiguration & Supply Chain Diversification: Ongoing tariff pressures and trade policy adjustments have forced multinational corporations to decentralise production lines, boosting intra-Asian trade and strengthening manufacturing alternatives.
Core Data Matrix: Key Regional Performance Indicators
| Country / Region | Projected Real GDP Growth (2026) | Primary Economic Drivers | Key Vulnerabilities |
| ASEAN-5 (Average) | 4.4% | Domestic consumption, tourism, electronics export diversification | Commodity dependency, external debt financing |
| Vietnam | 8.4% | High-tech manufacturing, foreign direct investment (FDI), semiconductor assembly | Infrastructure bottlenecks, export concentration |
| Indonesia | 5.1% | Domestic market scale, downstream mineral processing | Inflationary pressures from fuel pricing |
| Malaysia | 5.2% | Semiconductor testing/packaging, digital economy transition | High exposure to global energy price swings |
| Singapore | 5.0% | Financial services, high-value tech innovation, global trade hub | Global financial tightening, talent constraints |
Key Analytical Insights: Beyond the IMF Baseline
While institutional reports offer macro-level comfort, an expert-level review reveals critical nuances that investors, policymakers, and business leaders must account for:
- Artificial Intelligence as a Labor Transformer, Not Just an Eliminator: IMF findings emphasize that AI is reshaping tasks rather than outright wiping out work. In aging economies (such as Japan, South Korea, and parts of East Asia), AI mitigates acute labor shortages. Conversely, in younger, demographic-dividend economies, it risks complicating entry-level job creation unless educational pipelines pivot toward technical integration.
- The Intra-Asian Trade Buffer: Historically reliant on US and European end-demand, Asian economies have successfully pivoted toward intra-regional supply chains. This localized trade ecosystem acts as a shock absorber against Western economic softening.
- Fiscal Space Constraints: Following years of pandemic-era spending and subsequent energy subsidies, sovereign balance sheets are stretched. Policymakers face a tightrope walk: they must rebuild fiscal buffers while simultaneously investing heavily in green energy transitions and digital infrastructure.
Strategic Recommendations for Sustainable Growth
To convert short-term resilience into permanent structural dominance, regional stakeholders must execute three tactical shifts:
- Deepen Services Trade Integration: While manufacturing trade is well-optimized, intra-regional services trade (fintech, digital services, logistics, and professional consultancy) remains heavily fragmented by regulatory red tape. Harmonizing cross-border data and service frameworks will unlock massive untapped productivity gains.
- Modernize Social Safety Nets and Labor Reskilling: To counteract job displacement from automation and AI, governments must transition from rigid employment protection laws toward dynamic active labor market policies—funding continuous retraining programs for displaced workers.
- Accelerate Renewable Energy Independence: Given that Asia’s oil and gas intensity per unit of GDP is nearly double that of Europe, aggressive investments in domestic solar, wind, and grid-storage infrastructure are no longer just climate goals—they are baseline national security imperatives.
Conclusion
Asia’s economic narrative for 2026 is one of calculated grit. By successfully balancing technological modernization with pragmatic trade adaptation, the region has defied pessimistic global forecasts. However, sustaining this engine requires moving past passive “coping mechanisms” into proactive structural reform. Those economies that bridge the digital skills gap and insulate themselves against energy shocks will dictate the pace of global prosperity for the next decade.
Discover more from The Economy
Subscribe to get the latest posts sent to your email.
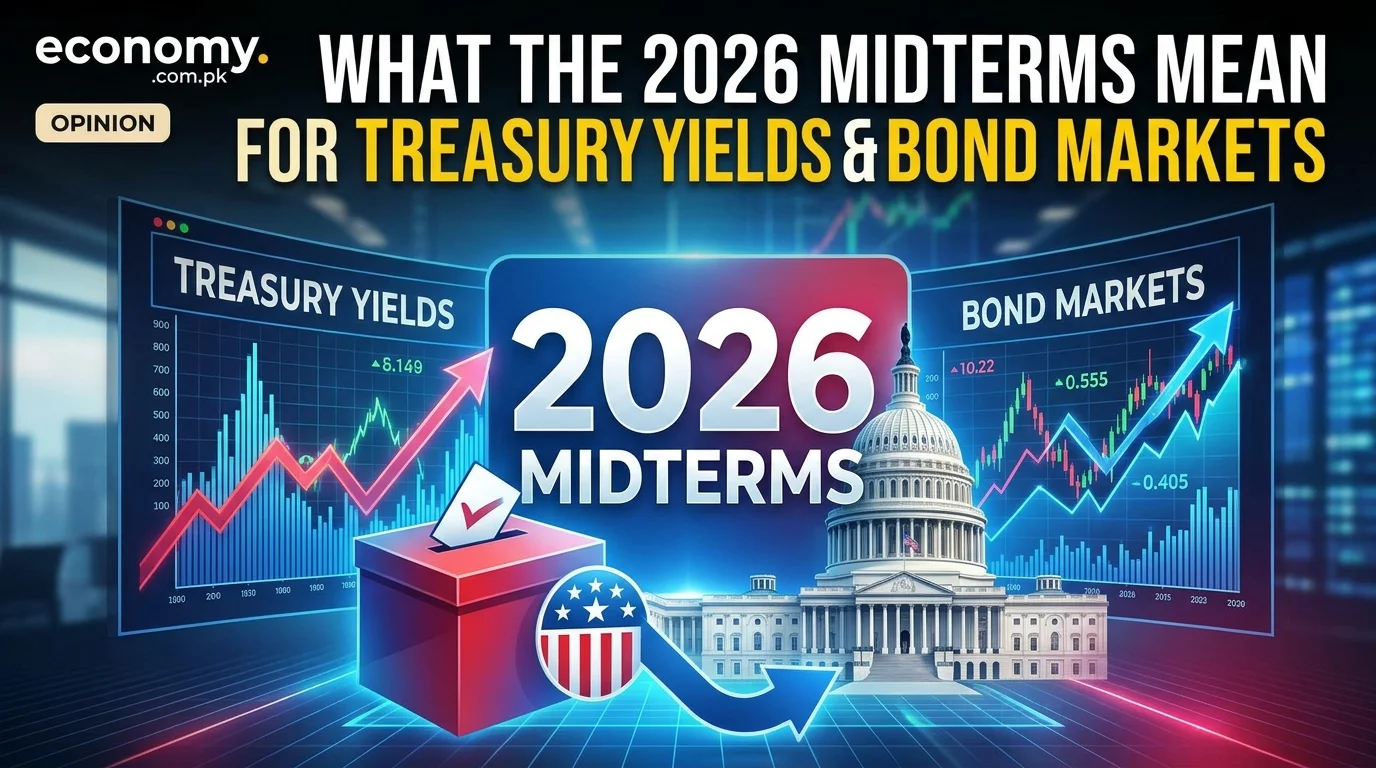
The Democratic sweep of Congress in the November 3, 2026 midterms pulled the 10-year U.S. Treasury yield lower, as investors priced in a possible check on new federal borrowing. The benchmark fell from about 4.95% to 4.89% on election-week trading, and dipped to roughly 4.83% by November 5, its lowest level since September, according to market data reported by Morningstar/Dow Jones and Trading Economics. The move is real, but history suggests it is a weak guide to where yields go next.
Key Takeaways
- The 10-year yield fell roughly 50 basis points from its early-October highs, which had reached multi-decade levels, according to WisdomTree’s rates analysis.
- Bond investors read divided or gridlocked government as a possible brake on borrowing, but that thesis is contested.
- The Federal Reserve, not the election, is the bigger near-term driver. Markets have discussed a possible December rate hike.
- WisdomTree’s central expectation is a 10-year trading range of 4.50% to 5.25% into the coming months.
- Post-midterm history is mixed: Bloomberg-compiled data show yields were lower on average one and 12 months after comparable results, but individual cases vary widely.
Why the Election Moved Bonds at All
Bond markets care about supply. Every dollar of federal deficit must be financed by Treasury auctions, and the more the government borrows, the more investors must be paid to hold the debt. A unified Democratic government could theoretically expand spending, which would normally push yields up. The election result, however, was read as the opposite: a divided or narrowly controlled Washington that makes large new spending bills harder to pass.
That interpretation drove the initial rally. Morningstar reported that the two-year yield fell to a two-month low of 4.546% on the day after the results, while the 30-year yield declined from 5.323% to 5.282%. The sharpest moves came in the front end of the curve, where investors had been pricing a more aggressive Fed.
Bond strategists are not fully convinced. WisdomTree argues that divided government may not reduce deficits at all, because bipartisan spending agreements and existing fiscal commitments can keep Treasury borrowing needs high regardless of who controls Congress. In other words, the political headline may matter less than the arithmetic of entitlement spending, interest costs, and tax policy already on the books.
The Fed Matters More Than Congress
For the next several months, Federal Reserve policy is likely to outweigh the midterms in setting the tone for Treasuries. Through September, Fed officials had signaled that further rate increases might be needed to bring inflation back toward target, and markets priced at least one more hike for 2026. WisdomTree’s analysis suggests the election should have only limited direct effect on that policy path, with a December move still possible after October’s jobs report.
This matters for bond investors because a rate hike shifts the short end of the curve first, but it also influences long-term yields through inflation expectations and term premiums. If the Fed tightens while the market doubts the government’s fiscal discipline, the long end can rise even as short-term yields stabilize.
A practical framework for readers tracking this:
- Watch the Fed’s December decision and the statements that accompany it. A hawkish surprise will likely lift yields across the curve.
- Track monthly jobs and inflation data. Strong employment and sticky price pressures have been the main reasons yields rose this autumn.
- Monitor Treasury auction results. Weak demand at longer maturities is an early sign that investors are demanding more compensation for duration risk.
- Follow oil prices and geopolitical headlines. Energy-driven inflation expectations have repeatedly pushed yields around in 2026.
What the Historical Record Actually Shows
Midterm years are often assumed to produce predictable bond outcomes, but the record is noisy. Analysis from Capital Group and others cited in recent market commentary found that, from the mid-1950s through 2022, the 12 months ending in November of midterm years produced roughly a coin-flip pattern: an average change of about one basis point, a median close to zero, and yields rising in roughly half of cases.
Two comparisons illustrate how unreliable the political signal can be. In 1983, a Republican president faced a Democratic House and a Republican Senate, and the 10-year yield rose by about 129 basis points. In 2019, under a broadly similar political structure, the yield fell by about 97 basis points. Same configuration, opposite outcomes. The difference was inflation, Fed policy, and growth conditions, not the partisan label.
Bloomberg-compiled data offer a more favorable reading for the current situation. Benchmark 10-year yields have tended to be lower on average one and 12 months after midterms that produce a comparable result. That pattern is suggestive rather than predictive. A sample of a few dozen election cycles cannot isolate the effect of partisan control from the macro environment at the time.
Where Yields Could Go Into 2027
The most useful way to think about the 10-year yield is as a range shaped by three forces: Fed policy, inflation expectations, and the supply of Treasury debt. Each is currently pulling in a different direction.
Upward pressure comes from persistent inflation, a Fed still open to tightening, and a large federal deficit that requires heavy issuance. The 10-year yield’s early-October run to multi-decade highs showed how quickly sentiment can shift when those factors align.
Downward pressure comes from a possible slowdown in economic growth, a flight to safety during equity sell-offs, and a political environment that may limit new spending. Equity weakness in early November temporarily supported Treasuries as investors sought safe assets.
Given these crosscurrents, WisdomTree’s expected range of 4.50% to 5.25% is a reasonable planning band rather than a forecast of a specific level. Readers should treat any single-point projection with caution. The distribution of outcomes is wide, and the main risk is a surprise from the Fed or a sharp repricing of inflation.
What This Means for Borrowers, Savers, and Investors
For homebuyers and businesses, the 10-year yield is the reference point that anchors mortgage rates and many corporate borrowing costs. A move toward the lower end of the expected range would ease pressure on mortgage pricing, while a return above 5% would likely keep housing affordability constrained.
For savers, higher yields on short-term Treasuries remain attractive, but the trade-off is reinvestment risk if the Fed eases later. Investors holding long-duration bonds face the opposite exposure: they gain if yields fall and lose if inflation or fiscal worries push them higher.
Practical steps for individuals with exposure to rates:
- Match bond duration to your time horizon rather than trying to time the election-driven moves.
- Consider how much of your portfolio is sensitive to a 50 to 100 basis point move in yields.
- Revisit fixed-rate debt decisions if your borrowing plans are tied to mortgage or refinancing timelines.
Frequently Asked Questions
Did the midterm elections cause Treasury yields to fall?
The results contributed to a decline. The 10-year yield dropped after the Democratic sweep, as investors interpreted divided or constrained government as a possible limit on new borrowing. Other factors, including oil prices, Fed commentary, and an equity sell-off, also influenced the move.
Where is the 10-year Treasury yield now?
In the days after the election, the 10-year traded in the high 4% range, with reports placing it near 4.83% to 4.9% in early November. Yields move daily, so check a live source such as the Treasury Department’s daily yield curve before making decisions.
Will the Fed raise rates in December 2026?
A December hike remains possible, according to WisdomTree’s analysis, particularly if October’s jobs data and inflation readings keep pressure on the Fed. Markets are not certain, and the outcome will depend on incoming data.
Do midterm elections reliably move bond markets?
No. Historical comparisons show wide variation. Bloomberg-compiled data suggest yields have tended to be lower in the year after comparable midterms, but cases such as 1983 and 2019 demonstrate that inflation and Fed policy usually matter more than the political configuration.
What is a reasonable 10-year yield range for 2027?
WisdomTree’s current central range is 4.50% to 5.25%. This is a planning band, not a precise forecast, and the outcome depends heavily on inflation and Fed decisions.
Does a divided Congress reduce the federal deficit?
Not necessarily. Analysts note that bipartisan spending deals and existing fiscal commitments can keep borrowing high even under divided government, so the deficit trajectory depends on policy choices beyond party control.
How should I position a bond portfolio after the midterms?
Focus on duration that matches your time horizon, diversify across maturities, and avoid making large directional bets based on the election alone. Consider consulting a licensed financial adviser for decisions tied to your specific situation.
Conclusion: Watch the Fed and the Deficit, Not Just the Vote
The 2026 midterms moved Treasury yields, but the lasting story is likely to be the interaction between Fed policy and federal borrowing. The election gave bond investors a reason to hope for fiscal restraint, yet the arithmetic of deficits and inflation has not changed. Readers should expect volatility, track the December Fed decision and incoming inflation data, and treat any single forecast with skepticism.
For ongoing coverage, follow Treasury auction results, Fed communications, and monthly economic releases. Those signals will tell you more about where yields are headed than the election headline alone.
Discover more from The Economy
Subscribe to get the latest posts sent to your email.
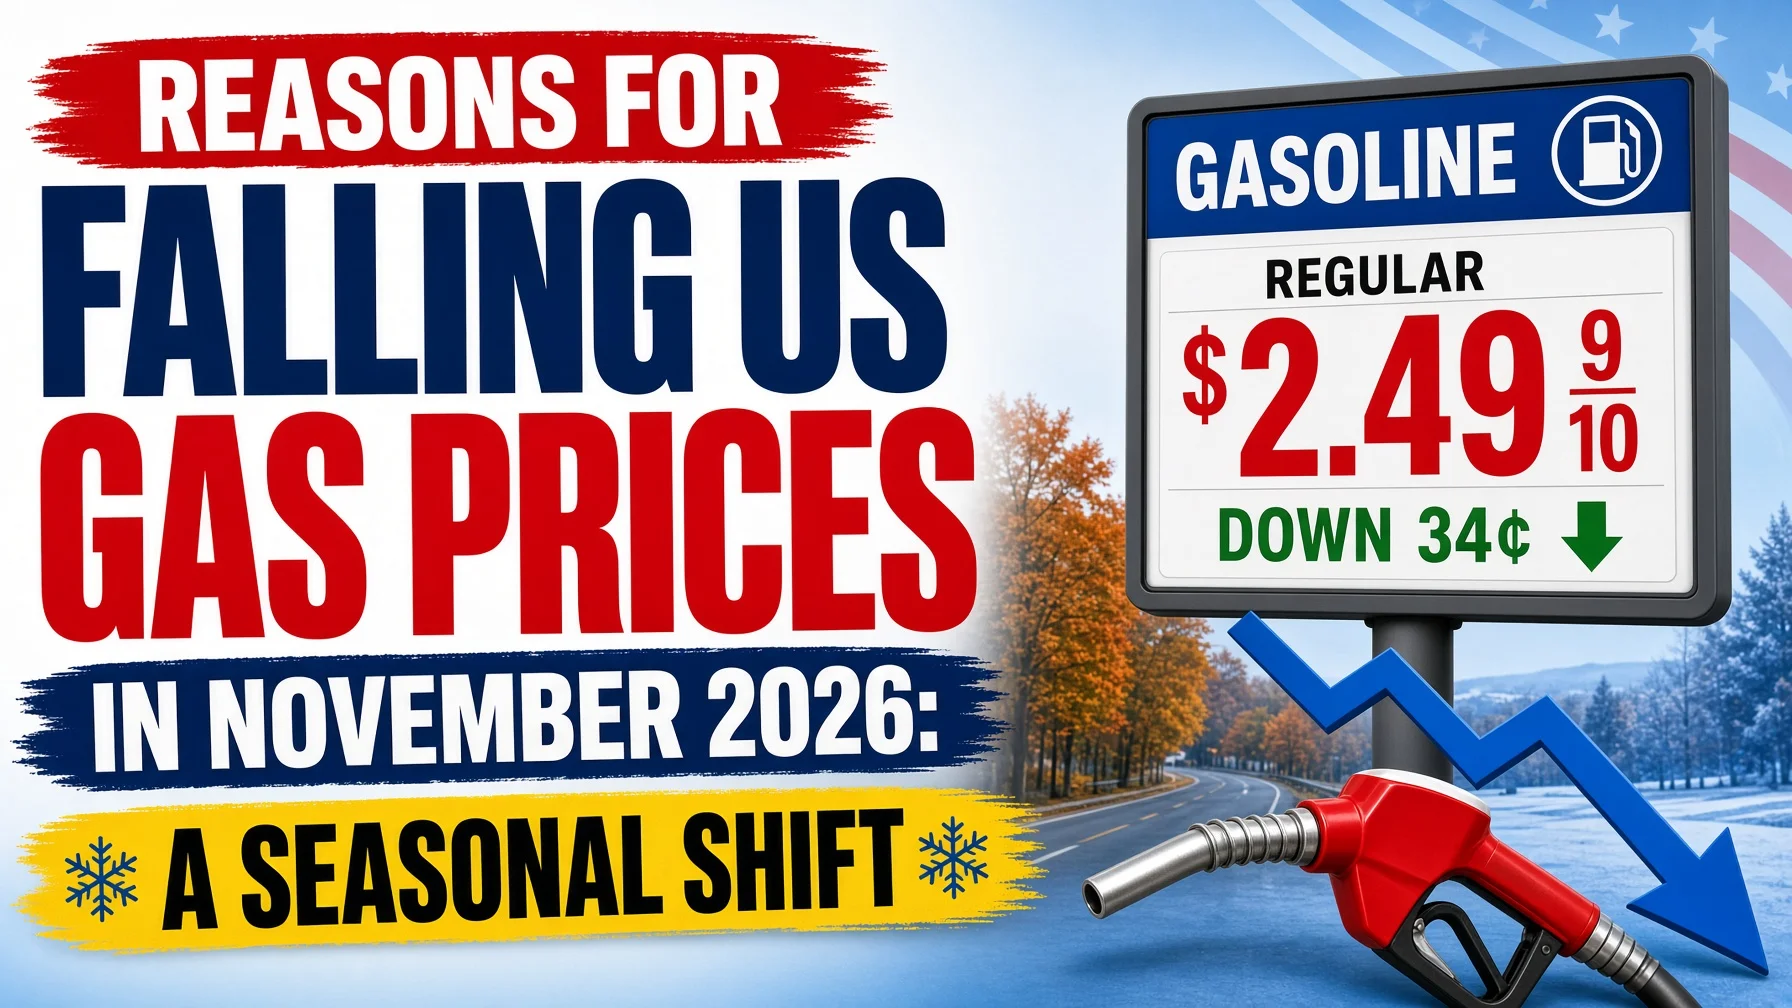
The US national average price of gasoline fell below $4 per gallon in early November 2026 for the first time since July, reaching approximately $3.94. The decline of more than 40 cents over the preceding month is explained by three well-documented factors: the annual switch to cheaper winter-blend fuel, seasonally lower driving demand, and a sharp drop in crude-oil prices. NPR
GasBuddy, AAA and independent analysts have stressed that the movement follows long-standing seasonal patterns rather than any direct political cause. At the same time, a reduction in immediate fears of Middle East supply disruption accelerated the fall in Brent crude that amplified relief at the pump. KCRA citing GasBuddy
Prices remain elevated compared with historical November averages. Further modest declines are possible before Thanksgiving if crude stays soft, but the relief is neither dramatic nor guaranteed.
Table of Contents
- What Are the Main Reasons US Gas Prices Are Falling?
- How Much Have Prices Actually Dropped and Where?
- How Does the Winter-Blend Switch Work?
- What Role Are Crude Oil Prices and the Strait of Hormuz Playing?
- Is the Midterm Election the Real Cause?
- What Do Major Analysts and Organizations Say?
- How Low Could Prices Go by Thanksgiving and Year-End?
- What Could Push Prices Higher Again?
- Key Takeaways
- Frequently Asked Questions
What Are the Main Reasons US Gas Prices Are Falling?
Three overlapping forces account for nearly all of the recent decline:
- Winter-blend gasoline – After mid-September refiners switch to a cheaper-to-produce winter formulation that faces less stringent evaporation standards.
- Seasonally lower demand – Cooler weather and the end of the summer driving season reduce vehicle miles traveled.
- Falling crude prices – Brent crude dropped sharply (into the low-to-mid $90s and briefly near or below $90) after improved flows through the Strait of Hormuz and signals that further near-term military escalation involving Iran was unlikely. NPR
Patrick De Haan, head of petroleum analysis at GasBuddy, has repeatedly stated that “for now, it’s the seasonal shift, not politics, driving the relief at the pump.” ConsumerAffairs
How Much Have Prices Actually Dropped and Where?
AAA and GasBuddy data placed the national average between $3.94 and $3.98 in the second week of November—down roughly 18 cents in a single week and more than 40 cents over the prior month. The national average had remained above $4 continuously since July. Declines were recorded in every state. Lower-cost regions already showed averages well below the national figure, while California and parts of the West Coast remained higher. KCRA
How Does the Winter-Blend Switch Work?
Federal rules require summer-blend gasoline (lower Reid vapor pressure) from 1 June to 15 September to reduce evaporation and smog formation. Outside that window, refiners may produce winter-blend fuel that is cheaper to manufacture. In 2026 the Environmental Protection Agency and Department of Energy permitted an earlier transition because prices were elevated. Once the cheaper fuel moves through the distribution system, the saving typically reaches 10–30 cents per gallon. CBS News
What Role Are Crude Oil Prices and the Strait of Hormuz Playing?
Retail gasoline prices largely track crude. Brent’s steep weekly decline—one of the largest percentage drops since the early pandemic period in some measurements—supplied the biggest incremental relief. Recovering export volumes from the Persian Gulf and public comments from US officials downplaying the likelihood of immediate further military action reduced the geopolitical risk premium that had supported higher prices through October. Washington Post
Is the Midterm Election the Real Cause?
Multiple independent analysts reject a direct causal link. GasBuddy’s historical analysis shows that national average prices have fallen in the 30 days leading up to every US general election since 2006 except 2010, almost always for the same seasonal reasons now visible in 2026. Political outcomes may influence future energy policy, but they did not produce the November price drop. NPR
What Do Major Analysts and Organizations Say?
- GasBuddy (Patrick De Haan): Seasonal blend change, lower demand and softer crude are the drivers; election timing is coincidental.
- AAA: Confirmed the national average falling below $4 and attributed the move to the usual autumn factors plus lower oil prices.
- NPR / Rystad Energy: Identified the decline in Brent as the largest single contributor, linked to improved Gulf flows and diplomatic signals.
Consensus across these sources is consistent.
How Low Could Prices Go by Thanksgiving and Year-End?
De Haan has suggested the national average could reach the $3.65–$3.75 range by Thanksgiving under continued soft crude conditions. Even that level would remain the highest on record for the holiday period. Further declines into December are possible if oil stays near current levels, but the pace is expected to moderate once the winter-blend transition is fully complete. KCRA
What Could Push Prices Higher Again?
- Renewed tensions or disruptions affecting the Strait of Hormuz
- Significant Ukrainian strikes on Russian refining capacity that tighten product markets
- Unexpected US refinery outages
- A sustained rebound in Brent crude above $100
Any of these would quickly reverse the recent gains at the pump.
Primary Drivers of the November 2026 Decline
| Driver | Typical / Recent Contribution | Current Status | Sensitivity Going Forward |
|---|---|---|---|
| Winter-blend switch | 10–30 cents | Fully under way | Low |
| Seasonal demand drop | Moderate | Normal autumn pattern | Low |
| Crude-oil price decline | Largest recent factor | Brent ~$90–93 | High |
| Midterm election / politics | Negligible (direct) | Coincidental timing | Low |
Key Takeaways
- The US national average fell below $4 per gallon in November 2026 for the first time since July.
- The dominant causes are the winter-blend transition, seasonally weaker demand, and a sharp drop in crude prices.
- Analysts uniformly describe any link to the midterm election as a myth.
- Further modest declines are possible before Thanksgiving if oil remains soft.
- Prices are still high by historical November standards.
- Geopolitical risks centered on the Strait of Hormuz remain the clearest threat of a rapid rebound.
Frequently Asked Questions
Why did gasoline prices fall immediately after the election?
The timing coincides with the normal autumn decline. Multiple analysts state the election itself was not the cause.
How low could the national average go by Thanksgiving?
GasBuddy sees a plausible range of $3.65–$3.75 if crude prices stay near current levels.
Are prices lower than they were one year ago?
No. They remain substantially higher on a year-over-year basis.
Does the switch to winter-blend gasoline really save money?
Yes. Winter blend is cheaper to produce and reliably reduces pump prices by 10–30 cents once it reaches stations.
What single factor would send prices back above $4 most quickly?
A sustained rebound in Brent crude driven by fresh supply disruptions in the Middle East.
Is diesel following the same pattern?
Diesel has also eased but remains elevated relative to gasoline; its decline has been somewhat less pronounced.
Did every state see lower prices?
Yes. GasBuddy reported declines in every state over the relevant weekly period.
Conclusion
The drop in US gasoline prices below $4 in November 2026 is a textbook seasonal event reinforced by a meaningful decline in crude oil. For economy, consumer and energy audiences the relief is tangible yet limited, and its causes are well understood: cheaper winter fuel, lower driving demand, and softer oil prices linked to calmer near-term geopolitical signals. Whether the decline extends through the Thanksgiving travel period or stalls will depend primarily on the path of crude. Absent a new supply shock, modest further easing remains the base case into early winter; any renewed tension around the Strait of Hormuz would reverse the gains rapidly.
Discover more from The Economy
Subscribe to get the latest posts sent to your email.

Open Banking Trends 2026: What Consumers Should Know

Nvidia After the Selloff: What to Watch Before Earnings

Black Friday 2026 Early Deals: A Data-Driven Shopping Guide

Fed Policy Path 2027: Rate Expectations After the Hold

Asia’s Economic Resilience in 2026: The Strategic Blueprint for Sustaining the Global Growth Engine

Credit Scoring Changes 2026: What Mortgage Buyers Need to Know

10-Year Treasury Yield Outlook for 2027 After the Democratic Sweep

Is the AI Infrastructure Boom Sustainable? A Reality Check

Disability Insurance Demand in 2026: Who’s Buying and Why

What the 2026 Midterms Mean for Treasury Yields and Bond Markets

Payroll Outlook After the Midterms: 2027 Tax Changes, Compliance Risks and AI Trends

Lisa Su: AMD Is Now a “Data Center First Company” – 2027 Outlook

Reasons for Falling US Gas Prices in November 2026: A Seasonal Shift

SoftBank’s $3.7 Billion Turbine Loss: What the AI Power Bet Reveals

Dow Jones Today: Dow Slips 237 Points After the Worst Day Since April 2025

US–Iran Conflict in October 2026: Hormuz, Oil Prices and Diplomacy

Pakistan IMF Programme 2026: Why Bailouts Keep Returning

SSI November 2026 Payment: Why Benefits Arrive October 30

Singapore Stock Market Outlook 2027: The STI’s Bank-and-Yield Test

2027 Federal Tax Brackets: New IRS Rates and Standard Deductions Explained

IMF Global Outlook 2027: The Recovery Is Real, but the Divide Is Growing

World Bank Debt Report 2026: The $9.4 Trillion Burden Behind the Recovery

Stock Market Crash 2026? What the November Rout Actually Tells Us

KSE-100 Index 2026: Is Pakistan’s Stock-Market Recovery Sustainable?

Germany–France ‘Made in Europe’ Deal Could Reshape China’s EV Ambitions

Global Markets Today: The AI Sell-Off Has Become a Test of Liquidity

Zhuhai Airshow 2026: How China’s Stealth Jets, Drones and Missiles Are Redrawing Global Air Power

Singapore’s Bank Sell-Off Is Really a Test of What Stability Is Worth
-

 Markets & Finance10 months ago
Top 15 Stocks for Investment in 2026 in PSX: Your Complete Guide to Pakistan’s Best Investment Opportunities
-

 Analysis9 months ago
Johor’s Investment Boom: The Hidden Costs Behind Malaysia’s Most Ambitious Economic Surge
-

 Analysis9 months ago
Top 10 Stocks for Investment in PSX for Quick Returns in 2026
-

 Banks10 months ago
Best Investments in Pakistan 2026: Top 10 Low-Price Shares and Long-Term Picks for the PSX
-

 Analysis9 months ago
Brazil’s Rare Earth Race: US, EU, and China Compete for Critical Minerals as Tensions Rise
-

 Investment10 months ago
Top 10 Mutual Fund Managers in Pakistan for Investment in 2026: A Comprehensive Guide for Optimal Returns
-

 Global Economy11 months ago
15 Most Lucrative Sectors for Investment in Pakistan: A 2025 Data-Driven Analysis
-

 Global Economy11 months ago
Pakistan’s Export Goldmine: 10 Game-Changing Markets Where Pakistani Businesses Are Winning Big in 2025