
Agriculture
Agri-Tech Pakistan 2026: Where Farming Innovation Could Actually Pay

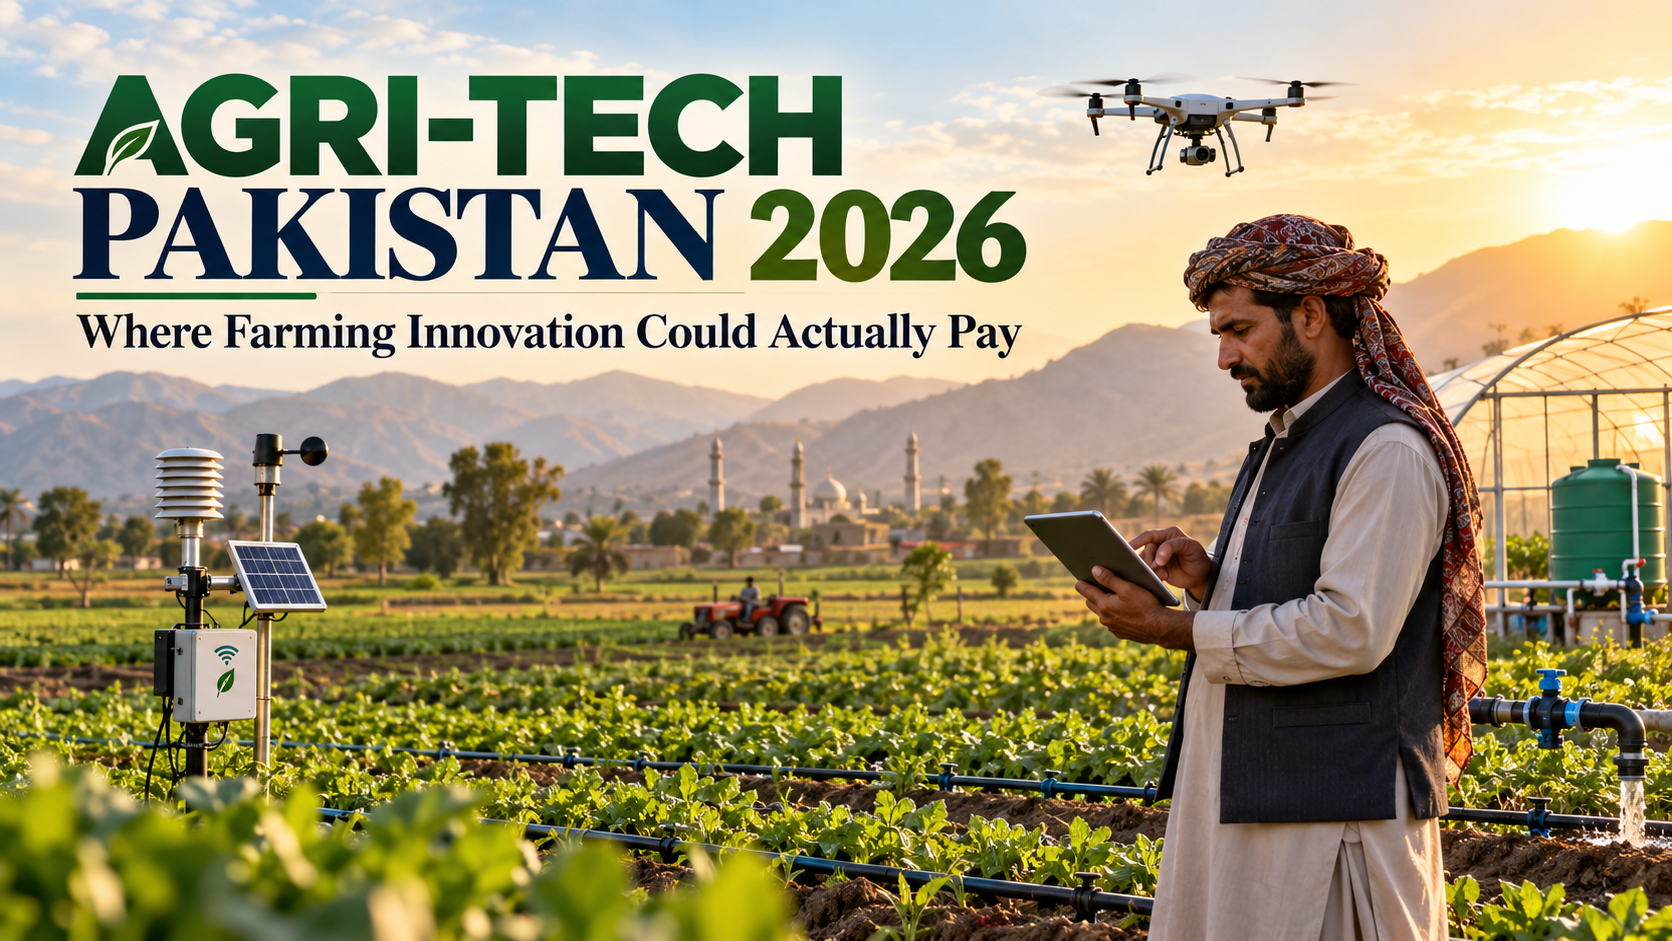
Explore agri-tech Pakistan 2026 opportunities in irrigation, storage, credit and data, with official agriculture figures and a farm-level return model.
Key Takeaways
- Agriculture represented 23.44% of Pakistan’s GDP in FY2025–26, according to the Pakistan Economic Survey highlights.
- FY26 agriculture-sector growth was reported at 2.89%; these figures describe sector performance, not a forecast of agri-tech returns.
- Saving water, reducing spoilage and improving access to working capital can deliver measurable benefits before complex AI systems are added.
- Claims that agri-tech is a guaranteed multibillion-dollar investment opportunity need a transparent market-sizing method and should not be treated as certified figures.
A farmer does not buy technology because it is impressive. She buys it if crops survive, costs fall or the final selling price improves enough to justify the expense. That is the right starting point for agri-tech Pakistan 2026. The sector contributes about 23.44% of GDP, according to the FY2025–26 Economic Survey, yet many producers still face water uncertainty, weak storage and difficult access to affordable credit.
Opportunity exists in simple interventions: a properly calibrated soil-moisture tool, a cold room near a vegetable market or a transparent digital buying platform. But business models vary widely by crop, farm size and province. This analysis separates profitable problems from venture-capital slogans and shows investors and farmers how to test the economics before committing money.
How large is agriculture’s role in Pakistan’s economy?
The Economic Survey 2025–26 highlights report agriculture at 23.44% of GDP in FY26, with the sector growing 2.89% over the year. Livestock contributed a substantial share of agricultural value added, while different crops grew at varying rates. Cotton and wheat have different market structures and risks from perishable vegetables or milk.
| Reported FY2025–26 measure | Value | Interpretation |
|---|---|---|
| Agriculture share of GDP | 23.44% | Sector share, not farm household income |
| Agriculture-sector growth | 2.89% | Real sector expansion |
| Livestock growth | 3.75% | One agricultural subsector |
| Wheat production | 29.61m tonnes | Crop production reported for FY26 |
A digital platform that only serves large commercial farms may capture value without solving the problems of small growers. Conversely, serving very small farms cheaply can be operationally expensive. Investors need to know who pays, who benefits and how money is collected.
The scale of agriculture does not mean any arbitrary fraction can be labelled a market opportunity. An ‘eight-billion-dollar agri-tech market’ claim is meaningless unless it states the geography, addressable crops, customer willingness to pay and assumptions used.
Which technology problems have the clearest economics?
Start with water. Sensors and scheduling can help a farmer avoid unnecessary irrigation, but their value depends on water pricing, pumping cost and the ability to control irrigation. Where farmers cannot adjust delivery times or canal allocations, better data may not translate into savings.
Next is post-harvest loss. A cold-storage provider can charge for preserving vegetables, but must factor electricity, backup supply, loading time, land rent and crop volumes. A storage site that sits empty for most of the year is unlikely to become profitable because it has a mobile dashboard.
Finally, access to verified markets matters. Traders and producers need quality standards, transparent weights and payment enforcement, not merely a price notification app. Simple receipts, warehouse records and reliable transport can be more valuable than predictive analytics without infrastructure.
The World Bank framework for Pakistan prioritises climate resilience, cleaner energy and private investment. That supports identifying practical infrastructure gaps rather than treating every digital farm product as a universal solution.
How much does agriculture contribute to Pakistan’s GDP in 2026?
Answer: Pakistan’s Economic Survey 2025–26 placed agriculture at 23.44% of GDP and reported 2.89% sector growth in FY26. These are fiscal-year estimates, not a measure of average farm profits or an estimate of the market available to technology suppliers.
Can AI and satellite imagery transform farming?
Potentially, but local validation is non-negotiable. A satellite image may reveal vegetation stress over a field, yet the cause could be salinity, pests, water shortage or a recent weather event. A model that diagnoses the wrong cause can lead to costly chemical purchases or wasted water.
The National AI Policy registry confirms the government has adopted an AI strategy. Implementation in agriculture should focus on specific farm decisions: when to irrigate, whether a crop is likely to suffer heat stress, and how to document yields for lenders. Each requires ground-truth samples and a way for agronomists to challenge errors.
Technology adoption also depends on literacy and trust. A farmer may prefer advice through an extension worker or a familiar cooperative rather than download another app. Hybrid services combining human agronomy with digital analysis may therefore outperform a purely self-service platform.
Worked example: does a drip-irrigation upgrade make sense?
Suppose an orchard currently spends Rs240,000 annually on pumping and related irrigation operating costs. A proposed system costs Rs500,000 upfront and, after maintenance, is expected to save Rs100,000 a year. Ignoring financing costs and changes in yields, simple payback is five years. If annual net savings fall to Rs60,000, payback stretches to about 8.3 years.
| Hypothetical scenario | Annual net saving | Simple payback on Rs500,000 |
|---|---|---|
| High operational benefit | Rs140,000 | 3.6 years |
| Base case | Rs100,000 | 5.0 years |
| Lower benefit | Rs60,000 | 8.3 years |
These are model assumptions, not equipment quotations. Real decisions need a discounted cash-flow estimate covering maintenance, pump reliability, credit costs, expected yield improvement, the salvage value of equipment and crop-price risk.
A farmer who cannot finance five years of expected payback should not be pushed into debt based on an attractive demonstration. For many smaller growers, cooperatives or service-as-you-go models may distribute the risk more fairly.
What stops finance from reaching good farm businesses?
Banks need credible collateral and repayment information. Farmers need loans that reflect harvest timing and seasonal risks. These requirements can clash when land records are contested or transaction histories are mostly informal. Better records can make credit assessment more accurate, but technology should not replace fair treatment or create unexplained algorithmic rejections.
The State Bank’s economic data portal provides credit and banking statistics. Investors should compare actual disbursements, outstanding loans and loan quality rather than cite a single growth percentage without the measurement period.
Agri-fintech works best when connected to genuine produce purchases, warehouse receipts or input financing with transparent prices. A loan marketplace that merely transfers costly short-term debt to farmers can make the sector more fragile. Consumer protection and clear pricing are essential.
How should investors evaluate agri-tech opportunities?
Start with unit economics. For a cold-storage warehouse, calculate paid utilisation, electricity cost per stored tonne, spoilage reduction, customer concentration and collection time. For farm software, ask what proportion of farmers pay after a free trial and whether retention persists across crop seasons. For irrigation equipment, test actual output and water savings under local conditions.
The IMF’s October 2026 Pakistan assessment includes climate resilience and reforms concerning irrigation-water pricing. This suggests pricing rules and public infrastructure will change the commercial environment, sometimes positively and sometimes by raising the direct price of previously subsidised inputs.
A strong opportunity should survive conservative assumptions and field testing. Investors should demand audited pilot results, independent product performance and a practical route to scaling from one district to several without losing service quality.
Agricultural technology also needs after-sales service. A failed pump controller during a heatwave can destroy far more value than its purchase price. The vendor should state who will repair devices locally, which spare parts are available, how often sensors require calibration and how quickly an error can be corrected. Farmers should avoid long-term contracts that trap their data inside a platform they cannot easily leave.
Public authorities can help by releasing accessible weather, water and crop-market data with clear quality notes. Universities can independently test devices under local soil and climate conditions. Where subsidised pilots are used, publish the outcomes for farmers who adopted the service and a comparable group who did not. Without that comparison, an impressive demonstration farm may simply reflect better irrigation, higher spending and more attention than nearby fields.
What This Means for You
Farmer: Compare three options: no intervention, simple process improvement and the proposed technology. Count all costs, including servicing and downtime, and ask for results from farms with comparable conditions.
Startup founder: Choose one measurable pain point and one customer category first. Collect evidence across a crop season before claiming national scalability.
Investor: Review unit economics by district and crop; verify land access, energy reliability, farmer acquisition costs and after-sales support. Ignore market-size claims without clear methodology.
Agricultural student: Learn field research, data collection and basic economics alongside code. A model useful to one crop under one climate may fail in another.
What to Watch Next
- 26 October 2026: The State Bank monetary-policy decision and any revision to its inflation assessment; verify any schedule change with the SBP.
- Early November 2026, exact release date to be confirmed: Pakistan Bureau of Statistics October inflation and merchandise-trade releases.
- Late October–November 2026, date not yet confirmed: Any IMF Executive Board announcement on the October staff-level agreement; staff agreement is not Board approval.
- Throughout FY2026–27: Updated SBP monthly balance-of-payments and remittance statistics; compare cumulative results rather than one month alone.
Frequently Asked Questions
How much does agriculture contribute to Pakistan’s GDP in 2026?
Pakistan’s Economic Survey 2025–26 placed agriculture at 23.44% of GDP and reported 2.89% sector growth in FY26. These are fiscal-year estimates, not a measure of average farm profits or an estimate of the market available to technology suppliers.
Is agri-tech a good investment in Pakistan?
It can be where a business solves a costly, recurring farming problem and customers can afford the service. Investors should verify results in local conditions, customer retention, working capital and infrastructure. A large agricultural economy does not guarantee returns for a particular startup.
What is precision agriculture?
Precision agriculture uses location-specific information, sensors, field records and other tools to tailor input use and management decisions. In Pakistan, its value depends on practical water control, data accuracy and farmers’ ability to act on advice. It does not require expensive AI for every farm.
Can cold storage reduce losses for Pakistani farmers?
Proper temperature management can preserve quality for suitable produce, but the economic payoff depends on electricity reliability, volume, transport and fees. A cold-storage project should test annual utilisation and buyer willingness to pay, not only the technology specification.
How do I calculate payback for an irrigation investment?
Divide the upfront cost by expected annual net cash savings to estimate simple payback. A Rs500,000 system saving Rs100,000 a year has a five-year simple payback. Include maintenance, loan interest, yields and the time value of money for a realistic investment decision.
The best agri-tech investment in Pakistan may not look glamorous. Water delivered at the right time, crops preserved after harvest and honest prices paid promptly can create more value than a sophisticated model without infrastructure.
Discover more from The Economy
Subscribe to get the latest posts sent to your email.


Key Takeaways
- This is not primarily a supply crisis: FAO’s July 2026 forecast puts global cereal production at 2.983 billion tonnes — the second-highest on record — with end-of-season stocks actually rising 8.2 million tonnes year-on-year.
- Yet 266 million people across 47 countries faced high levels of acute food insecurity in 2025, and global food inflation could rise from 2.8% to 5% by 2027.
- FAO’s own research attributes roughly 45% of the 2007-08 rice price rise and 30% of the wheat rise to export restrictions and reactive border protection — not fundamental scarcity — a pattern policymakers are watching closely in 2026.
- Fertilizer prices rose 35% year-on-year in the first five months of 2026, driven substantially by Strait of Hormuz-linked energy disruption, threatening the 2026/27 production outlook even though this year’s harvest was strong.
- A near-certain 2026-27 El Niño event is the single largest wildcard risk factor layered on top of an already fragile trade-policy environment.
A Price Crisis Layered on Top of Adequate Supply
The defining paradox of the 2026 food crisis is this: the world is not short of grain. According to FAO’s July 2026 forecast, global cereal production is expected to reach 2.983 billion tonnes this year — slightly below the record level recorded in 2025, but still the second-highest production level on record. Global cereal stocks at the end of the 2026-27 season are forecast at 957.8 million tonnes, an increase of 8.2 million tonnes from the previous year. These figures suggest the world is not currently facing an unavoidable shortage of basic grains — though a major weather event, prolonged geopolitical disruption, or a sharp increase in energy and fertiliser costs could quickly alter that outlook.
And yet the human toll remains severe. The Global Report on Food Crises 2026 estimates that about 266 million people in 47 food crisis countries and territories faced high levels of acute food insecurity in 2025, with FAO and the World Food Programme identifying 13 hunger hotspots for the June-to-November 2026 period. Reconciling adequate global supply with severe localised hunger is the central policy challenge — and it points squarely toward distribution, trade-policy, and price-transmission failures rather than an absolute production shortfall.
The Inflation Trajectory: Manageable Today, Risky Tomorrow
Global food inflation could rise from 2.8% in the first half of 2026 to 5% in the same period next year, adding an estimated 0.6 percentage points to overall inflation. The World Bank Group’s April 2026 Commodity Markets Outlook projects a 2.5% increase in the global food commodity price index this year, with risks firmly tilted to the upside — the emergence of El Niño conditions, rising energy and fertiliser costs, growing biofuel demand, and potential trade restrictions could all push food prices significantly above current projections.
The FAO’s own price index has already logged multiple consecutive monthly increases through 2026. World food commodity prices rose for a third consecutive month in April, with the FAO Food Price Index averaging 130.7 points, up 1.6% from March and 2% above the same month a year earlier, driven by higher costs across vegetable oils, meat, and cereals as the effective closure of the Strait of Hormuz continued to push up energy and fertiliser prices — though the index remained 18.4% below its March 2022 peak. FAO’s chief economist noted that despite the disruptions linked to the Strait of Hormuz crisis, global agrifood systems continue to show resilience.
Fertilizer: The Hidden Transmission Mechanism
The clearest link between the Middle East energy crisis and food prices runs through fertiliser costs. Global fertilizer markets have faced pressure since early 2026, and in the first five months of 2026, fertiliser prices increased by 35% compared to the same period last year — and despite some easing in recent weeks, fertiliser markets have not fully stabilised. Brazil, a major agricultural producer, imports approximately 80-90% of the fertilisers used in its agricultural sector, making it highly vulnerable to global supply disruption — a vulnerability shared by many mid-income agricultural exporters whose next season’s output now hinges on an input market they do not control.
The Real Policy Lesson: Export Restrictions Make Things Worse
The single most important, and most actionable, finding in FAO’s 2026 research concerns what governments do once prices start climbing — and it is a direct warning against the policy response many governments instinctively reach for. FAO’s State of Agricultural Commodity Markets 2026 report finds that when major producers impose export restrictions to protect their own markets, they transfer instability abroad and raise food insecurity elsewhere — insulating trade policies and reactive border protection explain about 45% of the rise in world rice prices and about 30% of the wheat rise during the 2007-08 crisis.
The human cost of that policy failure mode is directly quantifiable. In a scenario simulating a strong warm phase of El Niño affecting several countries, the report estimates that export restrictions push an extra 21.4 million people into hunger, on top of those hit by the shock itself. With a 2026-27 El Niño event now considered virtually certain based on all seasonal forecast modelling systems contributing to the Copernicus Climate Change Service, this is not an abstract policy warning — it is a near-term test that governments will very likely face within the next 12 months.
The 2026 global food crisis is a price and policy crisis, not a supply crisis: cereal production and stocks are near record highs, yet 266 million people face acute food insecurity. FAO research shows export restrictions, not shortages, drove roughly 45% of the 2007-08 rice price spike, with a near-certain 2026-27 El Niño now the key near-term risk.
Comparative Table: Supply-Driven vs. Policy-Driven Food Crisis Dynamics
| Dimension | Supply-Driven Crisis | Policy/Trade-Driven Crisis (2026 Pattern) |
|---|---|---|
| Root cause | Actual production shortfall | Export restrictions, speculation, price transmission failures |
| Global stock trend | Declining | Rising (+8.2 million tonnes forecast for 2026-27) |
| Appropriate policy response | Increase production, food aid | Keep trade flows open, avoid reactive border protection |
| Historical precedent | Genuine harvest failures | 2007-08 crisis: ~45% of rice price rise attributed to export restrictions |
| 2026 risk multiplier | Weather (El Niño) | Reactive policy response to weather-driven price spikes |
Speculation: A Contested but Recurring Explanation
Financial speculation remains a genuinely debated driver of food price volatility, distinct from but related to trade-policy failures. Academic research into prior food crises has argued that investor behaviour, not supply fundamentals, was the dominant price driver. One prominent economic analysis argues that despite common narratives blaming supply chain disruptions, there is no shortage of food globally — financial speculation is the key driver of food price surges, meaning the world faces a food price crisis, not a food supply crisis, with consequences that can be equally severe but require different policy solutions.
Whatever the precise weighting between speculation and trade policy, the practical implication for 2026 policymakers is the same: production-side interventions (subsidising farmers, boosting harvests) address the wrong lever if the actual failure is occurring in trade flows, price transmission, and financial markets.
Why It Matters for Investors and Policymakers
For commodity investors, the 2026 setup argues for treating agricultural price risk as a policy-and-weather compound bet rather than a pure supply-and-demand trade. Adequate global stocks mean prices should, in principle, remain contained — but the historical pattern shows that a weather shock combined with a defensive trade-policy response can produce price spikes disconnected from underlying fundamentals. Agricultural commodity exposure should be sized with this asymmetry in mind: the downside scenario (El Niño plus reactive export restrictions) has a well-documented historical precedent and a quantified human and price impact.
For policymakers, FAO’s research offers a rare, empirically grounded recommendation: keeping trade flows open during a price shock, rather than restricting exports, is the single most effective policy lever available — more effective, on the evidence, than most domestic production interventions.
What to Do Next
- Track fertiliser price trends as a leading indicator for the 2026/27 agricultural season, given their direct link to Strait of Hormuz-driven energy costs and Brazil-style import dependency risk.
- Watch for early signs of export restrictions from major grain producers as the 2026-27 El Niño event develops — this is the single clearest historical predictor of a price spike disconnecting from fundamentals.
- Distinguish country-level food inflation risk using FAO’s country rankings rather than relying on the global average, since currency depreciation and import dependency drive dramatically different exposure levels across markets.
- Treat current elevated global stocks as a genuine buffer, not a reason for complacency — the buffer can be undermined quickly by trade-policy responses to a weather shock, as 2007-08 demonstrated.
FAQ
Is the 2026 food crisis caused by an actual shortage of food?
No, not primarily. Global cereal production is forecast at 2.983 billion tonnes for 2026, the second-highest on record, with global cereal stocks actually rising 8.2 million tonnes year-on-year. The crisis is better explained by trade-policy responses, price transmission, and localised access failures than by an absolute supply shortfall.
What is the biggest risk factor for food prices heading into 2027?
A 2026-27 El Niño event is now considered virtually certain, and historically, weather shocks combined with defensive export restrictions have produced the sharpest price spikes. FAO estimates export restrictions in an El Niño scenario could push an extra 21.4 million people into hunger.
How many people are currently affected by acute food insecurity?
About 266 million people across 47 food crisis countries and territories faced high levels of acute food insecurity in 2025, according to the Global Report on Food Crises 2026.
Discover more from The Economy
Subscribe to get the latest posts sent to your email.
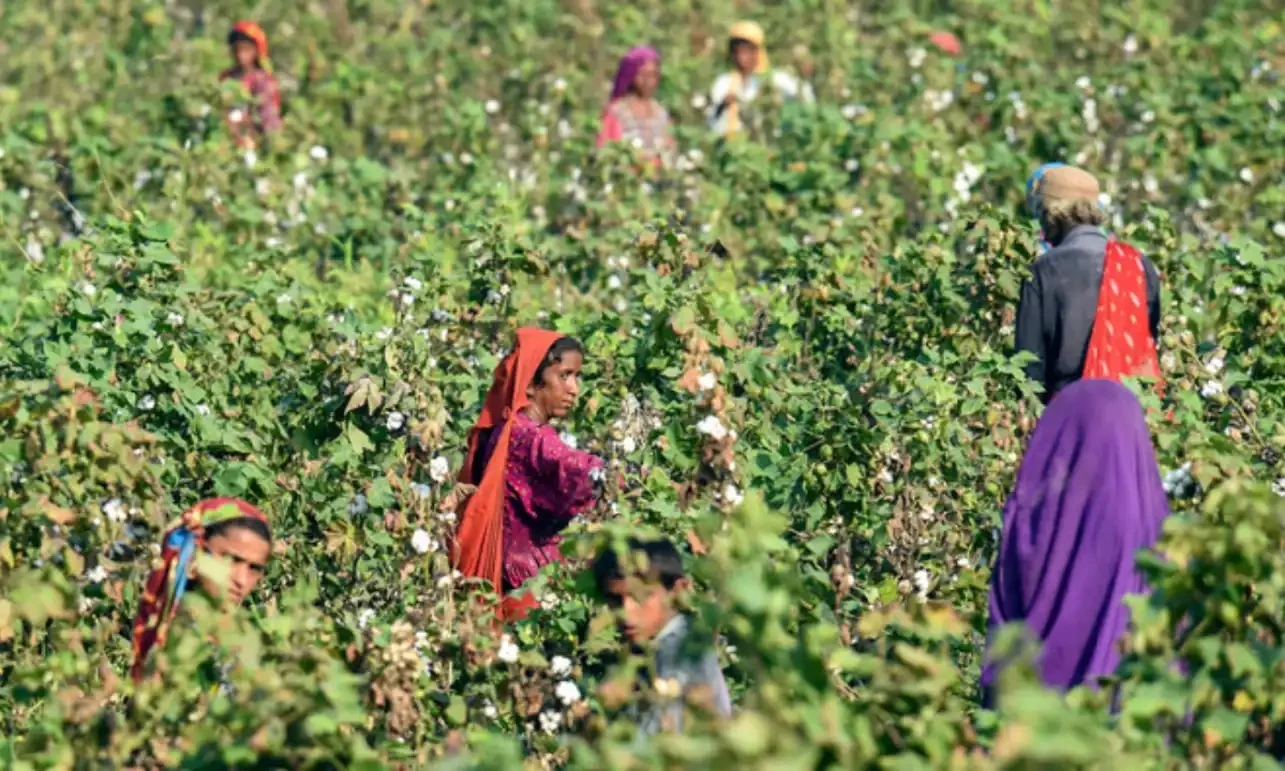
Pakistan’s cotton sector delivered a headline-grabbing statistic this month: Sindh recorded a 67% surge in cotton output by July 31, offsetting a decline in Punjab tied to monsoon disruption, according to Dawn’s business desk. On paper, this reads as a national agricultural success story. In practice, it illustrates something more precarious — Pakistan’s two largest cotton-producing provinces are moving in opposite directions in the same growing season, and the reasons are almost entirely climate-driven rather than structural improvement.
Why the regional divergence matters more than the national average
Averaging Sindh’s surge against Punjab’s decline produces a roughly flat-to-positive national figure, but that average obscures the underlying volatility each province is separately absorbing. Punjab’s decline reflects monsoon-related disruption to planting and harvest cycles, while Sindh’s gain reflects more favourable conditions in the same period — a pattern that, if it recurs unpredictably from season to season, makes national planning for textile-sector input supply considerably harder than a single stable growth number would suggest. Given that Pakistan’s textile exports remain the country’s single largest export category, and agriculture as a whole still accounts for roughly 23% of GDP and employs over a third of the labour force, this kind of provincial volatility has consequences well beyond the farm gate.
The industrial demands layered on top of a volatile harvest
Trade and industry leaders have separately urged Sindh’s provincial government to implement concrete measures ensuring the smooth operation of industrial units during future monsoon seasons, according to the same Dawn reporting — an implicit acknowledgment that monsoon disruption is not treated as a one-off shock but as a recurring operational risk that industrial policy needs to plan around going forward.
Fuel pricing adds a second pressure point
Compounding the agricultural picture, Pakistan’s petroleum dealers’ association has cautiously welcomed a recent government notification on fuel pricing while warning that even the revised rates remain “higher than economically justified,” per Dawn. For an agriculture-dependent economy where diesel costs feed directly into irrigation, transport, and mechanised harvesting expenses, elevated fuel pricing compounds the effect of any weather-driven crop volatility — raising the cost of responding to or recovering from a bad season on top of the yield loss itself.
Why this connects to Pakistan’s broader growth story
This provincial cotton divergence sits underneath the broader national narrative of Pakistan’s FY2025-26 economic stabilization — 3.7% GDP growth, easing inflation, and improved reserves. But as covered in Pakistan’s own economic survey data, agriculture grew just 2.9% against 6.1% for large-scale manufacturing this fiscal year. The Sindh-Punjab cotton split helps explain why: even within agriculture, outcomes are highly localized and weather-dependent, making the sector a persistently unreliable engine for broad-based income growth compared with industrial output that is far less exposed to a single monsoon season.
Key takeaways
- Sindh’s cotton output surged 67% by end-July 2026, offsetting a Punjab decline tied to monsoon disruption.
- The divergence highlights how climate variability, not structural reform, is driving Pakistan’s agricultural swings province by province.
- Industry leaders are pushing Sindh’s government for concrete measures to protect industrial operations during future monsoon seasons.
- Pakistan’s petroleum dealers say even revised fuel prices remain “higher than economically justified,” adding pressure to agriculture-linked costs.
- Agriculture’s structural volatility helps explain why the sector grew just 2.9% in FY2025-26 versus 6.1% for large-scale manufacturing.
FAQ
Why did Sindh’s cotton output surge in 2026? Favourable growing conditions in Sindh contrasted with monsoon-related disruption in Punjab, producing a 67% output increase in Sindh by end-July that offset Punjab’s decline.
Is Pakistan’s agriculture sector recovering in 2026? Only unevenly — national figures mask sharp provincial divergence driven by weather, and the sector as a whole grew just 2.9% in FY2025-26, well below industrial growth.
Are fuel prices in Pakistan rising in 2026? Yes — the petroleum dealers’ association has said recently revised rates remain higher than it considers economically justified.
Discover more from The Economy
Subscribe to get the latest posts sent to your email.

Pakistan Real Estate Tax 2026: What Buyers, Sellers and Investors Must Check

SME Finance Pakistan 2026: Why Small Businesses Still Struggle for Credit

Pakistan IMF Programme 2026: Why Bailouts Keep Returning

Agri-Tech Pakistan 2026: Where Farming Innovation Could Actually Pay

Pakistan Tax Net: Why Agriculture, Retail and Property Are So Hard to Tax

KSE-100 Index 2026: Is Pakistan’s Stock-Market Recovery Sustainable?

Pakistan IT Exports 2026: What Would It Take to Reach $10 Billion?

Pakistan AI Policy 2025: Can It Raise Productivity and Create Jobs?

Pakistan Remittances 2026: How Overseas Workers Support the Economy

Can Pakistan Reach $34 Billion in Exports? The Real Barriers and Fastest Fixes

Why Pakistan’s Inflation Is Still Near 10% Despite Economic Stabilisation

Holiday Airfare 2026: Why Flights Cost More & Fares

California Prop 40 Explained: The 2026 Billionaire Wealth Tax Ballot Measure

US–Iran Conflict in October 2026: Hormuz, Oil Prices and Diplomacy

Crude Oil & Petroleum Market Analysis: OPEC+ Decisions and Price Forecasts

World’s Largest Economies: Ranking the Top Global Powers

Pakistan Economy 2026: Inside the SBP’s Balancing Act

Asian Stock Markets 2026: Japan, China, Pakistan & More

Silver Price Today: Why the Xi-Trump AI Standoff Is Fueling a Safe-Haven Rally

Oil Prices 2026: Inside the Hormuz Crisis That Won’t End

SpaceX IPO 2026: History’s Biggest Stock Debut?

Algorithmic Dogfights: Why the U.S. and China Must Establish Rules of Engagement for Autonomous Air Power

IMF Reports 2026: What the Latest Data Means for the Global Economy

Top US Convenience Store Chains: Store Counts, EV Charging, and Sales Trends

Business Insurance: What Coverage You Actually Need and What It Costs in 2026

Who Is Shivon Zilis? The Neuralink Executive at the Center of the Musk–OpenAI Trial

Global Economic Outlook 2026: 7 Forces Reshaping Markets, Trade and Business

Corporate America Faces a New Debt Test as US Borrowing Costs Surge
-

 Markets & Finance10 months ago
Top 15 Stocks for Investment in 2026 in PSX: Your Complete Guide to Pakistan’s Best Investment Opportunities
-

 Analysis8 months ago
Johor’s Investment Boom: The Hidden Costs Behind Malaysia’s Most Ambitious Economic Surge
-

 Analysis8 months ago
Top 10 Stocks for Investment in PSX for Quick Returns in 2026
-

 Banks9 months ago
Best Investments in Pakistan 2026: Top 10 Low-Price Shares and Long-Term Picks for the PSX
-

 Analysis9 months ago
Brazil’s Rare Earth Race: US, EU, and China Compete for Critical Minerals as Tensions Rise
-

 Investment9 months ago
Top 10 Mutual Fund Managers in Pakistan for Investment in 2026: A Comprehensive Guide for Optimal Returns
-

 Global Economy10 months ago
15 Most Lucrative Sectors for Investment in Pakistan: A 2025 Data-Driven Analysis
-

 Global Economy10 months ago
Pakistan’s Export Goldmine: 10 Game-Changing Markets Where Pakistani Businesses Are Winning Big in 2025