
Global Economy
Pakistan’s Export Goldmine: 10 Game-Changing Markets Where Pakistani Businesses Are Winning Big in 2025

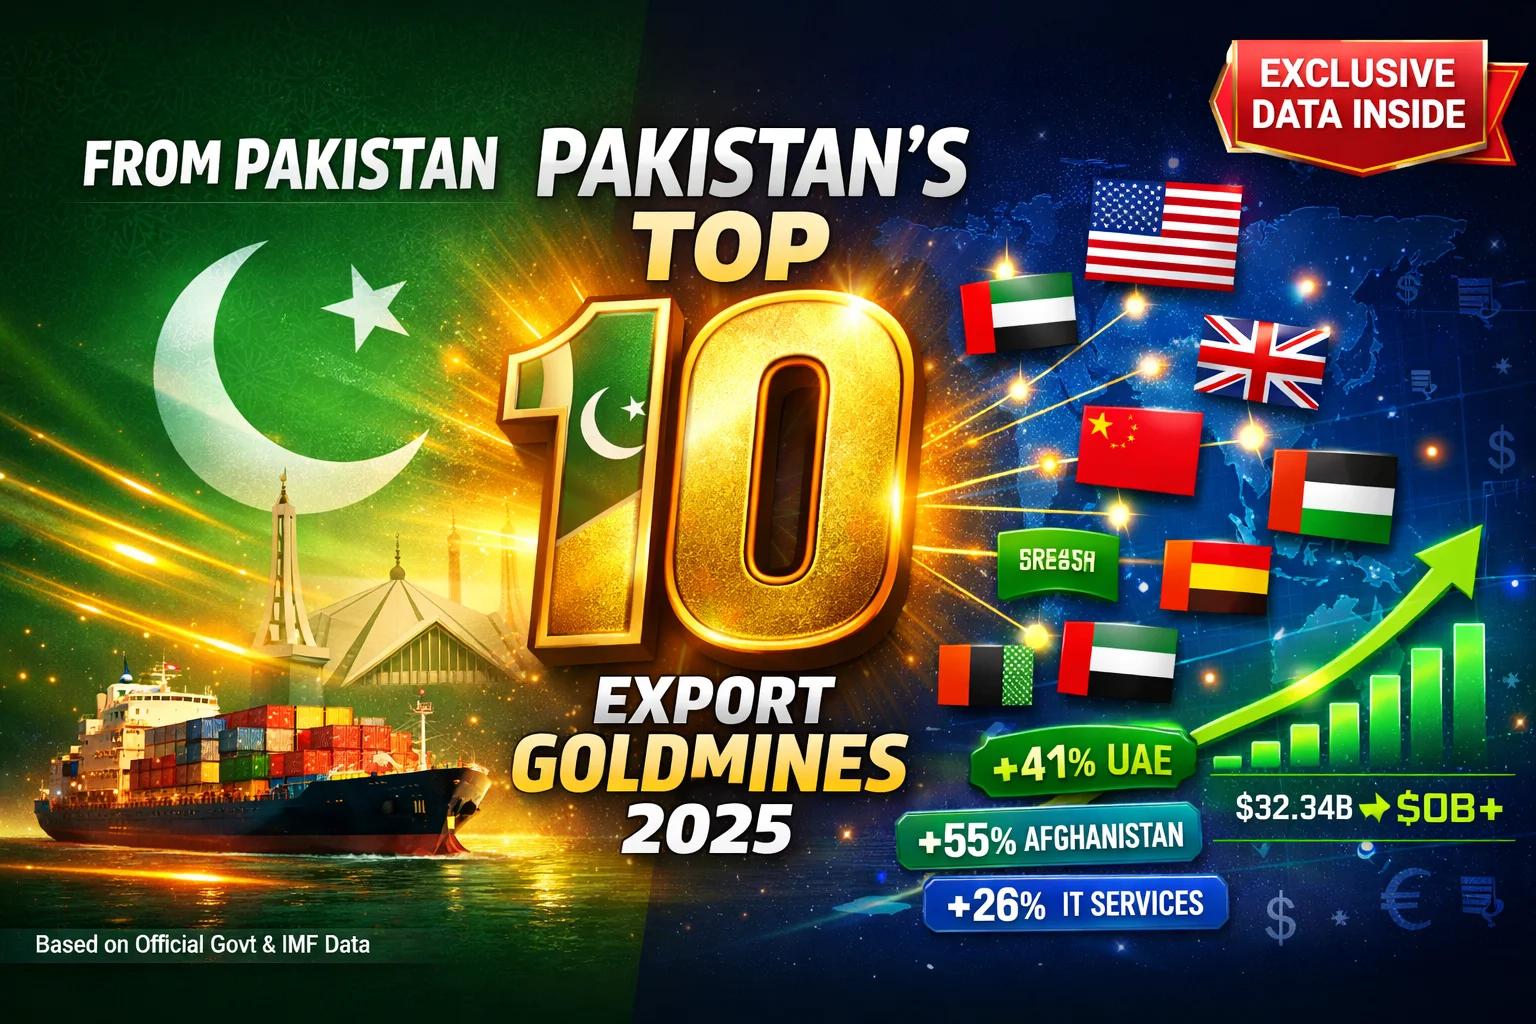
A data-driven roadmap to Pakistan’s most lucrative export destinations, backed by official trade statistics and strategic insights
When Karachi-based textile exporter Asim Raza signed his first €2 million contract with a German retailer in early 2024, he didn’t realize he was riding a wave that would define Pakistan’s economic transformation. His company’s exports to Germany grew by 33% that year—a microcosm of Pakistan’s surging global competitiveness in strategic markets.
Pakistan’s exports reached $32.34 billion in 2024, with goods and services exports climbing to $16.56 billion in the first half of fiscal year 2024-25—a robust 10.52% year-over-year increase. But here’s what the headlines miss: Pakistan isn’t just exporting more. It’s exporting smarter, targeting high-value markets with precision and diversifying beyond its traditional textile stronghold.
This analysis reveals the 10 most promising export destinations for Pakistani goods and services in 2025, backed by data from Pakistan’s State Bank, Bureau of Statistics, international trade databases, and insights from the IMF and World Bank. Whether you’re a seasoned exporter or an entrepreneur eyeing global markets, these destinations represent Pakistan’s best opportunities for sustainable, profitable growth.
Executive Summary: The $50 Billion Opportunity
Pakistan stands at an economic inflection point. The IT sector alone hit a record $4.6 billion in exports for FY 2024-25, marking 26.4% growth, while traditional textiles maintained their dominance despite global headwinds. The 10 markets analyzed here collectively account for over 67% of Pakistan’s total exports and represent combined annual trade potential exceeding $50 billion by 2027.
Key Findings:
- The United States remains Pakistan’s largest export market at $5.6 billion annually, offering unparalleled stability
- UAE trade surged to $10.9 billion in FY 2023-24, with Pakistani exports jumping 41% to $2.08 billion
- European Union markets absorbed $9.0 billion in Pakistani exports in 2024, representing 27.6% of total exports
- Saudi Arabia’s IT imports from Pakistan increased 48% to $47.09 million in FY24
- Emerging opportunities in GCC markets, driven by Vision 2030 initiatives
Methodology: How We Identified These Markets
This analysis combines quantitative trade data with qualitative assessments across five critical dimensions:
- Market Size & Growth Trajectory: Current export volumes and 3-year growth rates
- Trade Policy Environment: Tariff structures, free trade agreements, and preferential access
- Sector Diversification Potential: Opportunities beyond Pakistan’s core exports
- Payment Security & Stability: Currency strength, political risk, and ease of doing business
- Infrastructure & Logistics: Shipping costs, trade corridors, and connectivity
Data sources include Pakistan Bureau of Statistics, State Bank of Pakistan, IMF World Economic Outlook, World Bank Trade Statistics, UN COMTRADE, and official government portals including pc.gov.pk, finance.gov.pk, and invest.gov.pk.
1. United States: The $5.6 Billion Anchor Market
Why America Matters
The United States purchased $5.6 billion worth of Pakistani goods in 2024, representing 17.3% of Pakistan’s total exports. More remarkably, exports to the US reached $1.46 billion in Q1 FY 2024-25 alone, up 6.18% year-over-year, demonstrating resilient demand despite global economic uncertainty.
The US market offers Pakistani exporters something invaluable: predictability. With established payment mechanisms, minimal political risk, and strong rule of law, American buyers provide the stable cash flows that enable Pakistani businesses to scale.
What Pakistan Exports to America
Textiles dominate with bed linens, home textiles, and cotton apparel leading shipments. However, diversification is accelerating. Pakistani surgical instruments from Sialkot, basmati rice, leather goods, and an emerging wave of IT services are gaining traction.
IT services to the United States accounted for 54.5% of Pakistan’s total IT exports in FY 2023, signaling a critical shift toward high-value service exports. Pakistani software houses, freelance platforms, and tech startups are tapping into America’s insatiable demand for affordable, skilled digital talent.
Competitive Edge
Pakistan benefits from preferential treatment under various US trade programs and decades-old procurement relationships. American retailers seeking ethical, cost-effective sourcing alternatives to China increasingly view Pakistan as a strategic partner.
The US Generalized System of Preferences historically provided duty-free access for many Pakistani products, though its reinstatement remains under policy review. Regardless, Pakistan’s competitive pricing—often 15-20% below alternatives—ensures market access.
Entry Strategy
Start with established channels: Partner with US import-export houses that understand compliance requirements (FDA for food, CPSIA for consumer goods). Attend trade shows like NY Textile Week, the Magic Las Vegas fashion trade show, or specialty exhibitions in target sectors.
Focus on certifications: US buyers demand compliance. GOTS (Global Organic Textile Standard), WRAP (Worldwide Responsible Accredited Production), and ISO certifications open doors that pricing alone cannot.
For IT exporters: Leverage Pakistan Software Export Board (PSEB) resources, join Upwork Enterprise or Toptal platforms, and target mid-market US companies seeking dedicated offshore teams.
2. United Arab Emirates: The $10.9 Billion Gateway to Global Markets
Why UAE is Pakistan’s Strategic Hub
Bilateral trade between Pakistan and the UAE hit $10.9 billion in FY 2023-24, with goods trade at $8.41 billion and services at $2.56 billion. Pakistani exports surged by 41.06% to $2.08 billion, making UAE one of Pakistan’s fastest-growing export destinations.
But here’s the real story: UAE’s Pakistani expatriate community sent home $6.7 billion in remittances in 2024, expected to surpass $7 billion in 2025. This creates natural demand channels for Pakistani consumer goods while establishing financial corridors that reduce transaction costs for exporters.
What Thrives in UAE Markets
Food & Agriculture: Pakistani Basmati rice enjoys significant reputation in UAE markets, alongside mangoes, citrus fruits, and halal meat products. UAE’s reliance on food imports—the country imports over 90% of its food—creates perpetual demand.
Textiles & Home Goods: Pakistani fabrics, garments, and home textiles flow through Dubai’s re-export channels to Africa, Central Asia, and Europe.
IT Services: Pakistan aims to double IT exports to Saudi Arabia from $50 million to $100 million, with UAE serving as a regional IT hub connecting to broader GCC markets.
Construction Materials: Pakistan’s cement and marble industries supply UAE’s perpetual infrastructure boom.
Strategic Advantages
- Geographical proximity: Shipping costs 40-50% lower than to Europe or Americas
- Cultural affinity: 1.5 million Pakistani diaspora creates built-in market knowledge
- Re-export platform: UAE’s world-class logistics turn Dubai into a springboard for African and Central Asian markets
- Investment flows: Over $10 billion in Emirati investments in Pakistan over two decades facilitate two-way trade
Market Entry Tactics
Establish presence in Dubai’s Jebel Ali Free Zone or DAFZA (Dubai Aviation Free Zone) for tax advantages and simplified customs. Participate in major trade exhibitions like GULFOOD (food sector), INDEX (interior design/home textiles), and GITEX (technology).
Partner with established UAE trading houses that manage distribution across GCC markets. For smaller exporters, UAE’s growing e-commerce infrastructure (Noon, Amazon.ae) offers direct-to-consumer channels.
3. United Kingdom: The $2.1 Billion Legacy Market with Modern Potential
The UK Advantage
The UK absorbed $2.1 billion in Pakistani exports in 2024, making it the third-largest destination with 6.6% of total export share. More importantly, Q1 FY 2024-25 exports to UK grew to $562.75 million from $519.14 million year-over-year, demonstrating sustained momentum post-Brexit.
The UK represents more than just trade numbers—it’s Pakistan’s gateway to Commonwealth markets and English-speaking channels. A 1.6 million-strong British Pakistani community creates unmatched market intelligence and distribution networks.
What Britain Buys from Pakistan
Textiles reign supreme: Pakistani cotton, knitwear, and home textiles meet Britain’s insatiable fast-fashion and home goods demand. Major retailers like Marks & Spencer, Tesco, and ASDA source extensively from Pakistani manufacturers.
Food products: Basmati rice, halal meat, and spices cater to both ethnic markets and mainstream British consumers increasingly embracing diverse cuisines.
Leather goods: Pakistan’s leather jackets, bags, and footwear compete effectively on quality and price in UK’s mid-to-premium segments.
Post-Brexit Opportunities
Brexit created complexity but also opportunity. Pakistan and the UK are negotiating an enhanced trade agreement that could provide preferential access beyond the UK’s standard GSP arrangements. Pakistani exporters should position for these emerging frameworks.
The UK’s “Global Britain” strategy actively seeks non-EU trade partnerships, creating openings for Pakistani businesses willing to meet British standards (UKCA marking replacing CE, enhanced traceability).
Action Plan
Quality is non-negotiable: British consumers and regulators demand high standards. Invest in UK Accreditation Service (UKAS) recognized certifications.
Tap into ethnic channels: British Pakistani-owned wholesalers and retailers provide market entry points with lower barriers. Birmingham, Manchester, and London’s ethnic business districts are goldmines for first-time exporters.
Digital commerce: UK online shopping penetration exceeds 80%. Pakistani brands can sell directly via Amazon UK, eBay, or specialized platforms like Not On The High Street (artisan goods).
4. Germany: The $1.72 Billion European Manufacturing Powerhouse
Germany: Quality Meets Scale
Germany imported $1.72 billion worth of Pakistani goods in 2024, making it Pakistan’s fifth-largest export market and the most significant European Union destination. Germany accounts for 19.2% of Pakistan’s total EU exports, driven by industrial demand and consumer purchasing power.
German exports to Pakistan reached €400.1 million in H1 2024, while imports from Pakistan hit €1.19 billion, revealing a favorable trade balance for Pakistan and German appetite for Pakistani products.
What German Buyers Want
Technical textiles: Germany’s automotive and industrial sectors import Pakistani technical fabrics, nonwovens, and specialized textiles that meet rigorous specifications.
Home textiles & fashion: Textiles and garments comprise 85.4% of German imports from Pakistan, supplying retailers from discount chains (Aldi, Lidl) to premium brands.
Surgical instruments: Sialkot’s surgical instrument cluster exports precision tools to German medical suppliers, renowned for quality matching European standards.
Leather goods: Pakistani leather jackets, gloves, and accessories compete in Germany’s price-conscious yet quality-demanding market.
The GSP+ Advantage
Pakistan benefits from EU’s GSP+ status, providing duty-free or reduced tariffs on over 66% of product categories. Approximately 78.7% of EU imports from Pakistan utilize GSP+ preferential tariffs, creating substantial cost advantages over non-GSP+ competitors.
Germany views Pakistan favorably under GSP+, granting full tariff removal on most Pakistani exports, making it one of the most profitable European markets for Pakistani goods.
The “Made in Germany” Connection
Germany’s reputation for quality creates opportunities for Pakistani manufacturers willing to meet exacting standards. “Made in Germany” products enjoy strong reputation, and Pakistani suppliers providing components or finished goods to German brands can leverage this halo effect.
Breaking into Germany
Attend trade fairs: Germany hosts world-leading B2B exhibitions including Heimtextil (home textiles, Frankfurt), Texprocess (textile processing, Frankfurt), and MEDICA (medical equipment, Düsseldorf).
Partner with German Mittelstand: Germany’s medium-sized companies (Mittelstand) seek reliable, cost-effective suppliers. These family-owned firms value long-term relationships over transactional deals.
Emphasize sustainability: German buyers increasingly demand environmental certifications (GOTS, OEKO-TEX, FSC). Investment in green manufacturing pays dividends in German markets.
5. China: The $2.4 Billion Two-Way Opportunity
The Dragon’s Appetite
China imported $2.4 billion of Pakistani goods in 2024, representing 7.3% of total Pakistani exports. However, exports to China declined 10.54% in recent reporting periods, revealing a complex, evolving trade relationship that demands strategic navigation.
China represents Pakistan’s second-largest trading partner and the anchor of the China-Pakistan Economic Corridor (CPEC), but the relationship is asymmetric—Pakistan imports far more from China than it exports, creating persistent trade deficits.
What China Actually Buys
Agricultural products dominate: Chinese consumers prize Pakistani basmati rice, seafood (especially shrimp and fish), and increasingly, premium fruits like mangoes and kinnows (citrus).
Raw materials: Cotton, copper, and minerals flow from Pakistan to feed China’s manufacturing machine.
Textiles (surprisingly): While China produces textiles globally, it imports specialty Pakistani fabrics, particularly high-quality cotton yarns and home textiles that Chinese manufacturers re-export as finished products.
The CPEC Multiplier Effect
CPEC infrastructure—Gwadar Port, transportation corridors, Special Economic Zones—theoretically positions Pakistan as China’s gateway to Middle Eastern and African markets. The promise: Pakistani manufacturers using Chinese investment to produce goods for re-export through improved logistics networks.
Reality check: This vision remains partially unfulfilled, but opportunities are materializing. Pakistani businesses should focus on becoming component suppliers in Chinese value chains rather than competing head-to-head with Chinese manufacturers.
Strategic Positioning
Target Chinese consumers directly: Pakistan’s premium food products (organic rice, Himalayan salt, mangoes) appeal to China’s rising middle class seeking healthy, exotic imports. Exports to China totaled $559 million in Q1 FY 2024-25, suggesting continued relevance despite year-over-year declines.
E-commerce platforms: Alibaba’s Tmall Global, JD Worldwide, and cross-border e-commerce platforms allow Pakistani brands to reach Chinese consumers without traditional import channels.
Focus on differentiation: Pakistan cannot compete with China on price for manufactured goods. Instead, emphasize authenticity (premium basmati), sustainability (organic products), and quality craftsmanship (surgical instruments, leather goods).
Entry Tactics
Attend Canton Fair (Guangzhou) for market research and relationship building. Partner with Chinese import-export houses that understand Chinese regulatory requirements (CIQ certifications, customs processes).
For agricultural products, engage provincial commodity trading companies that specialize in food imports. Provinces like Guangdong and Shanghai offer largest consumer markets.
6. Saudi Arabia: The $734 Million Vision 2030 Springboard
The Kingdom’s Transformation
Pakistan’s exports to Saudi Arabia stood at approximately $734 million in 2024, but this understates the opportunity. Saudi Arabia’s Vision 2030 economic diversification plan is creating unprecedented demand across sectors where Pakistan holds competitive advantages.
Pakistan’s total exports to Saudi Arabia recorded $710.29 million for FY 2024, up from $503.85 million in FY 2023, representing 41% growth—one of Pakistan’s fastest-growing major markets.
Most exciting: Pakistan’s IT exports to Saudi Arabia registered 48% growth in FY24, increasing from $31.67 million to $47.09 million, with projections to double to $100 million soon.
What Saudi Arabia Needs
Food security: The Kingdom imports 80%+ of its food. Pakistani exports include rice ($107 million), bovine meat ($44.5 million), and spices ($29.5 million), with room for massive expansion as Saudi food consumption grows 4-5% annually.
IT Services & Digital Transformation: Saudi Arabia allocated $100 billion for AI and digital infrastructure projects. Pakistani IT companies participated in LEAP 2025 with 1,000+ delegates, securing business deals and MoUs.
Construction Materials: Pakistani cement, gypsum, and limestone support Saudi Arabia’s infrastructure boom, with NEOM, Red Sea Project, and Qiddiya entertainment city creating sustained demand.
Textiles & Garments: Saudi’s retail sector expansion and growing youth population (65% under 35) drive apparel demand.
The Remittance-Export Nexus
Pakistan sent 1.88 million workers to Saudi Arabia between 2020-2024, up 21% from previous period. Remittances from Saudi Arabia rose from $7.39 billion in 2020 to $8.59 billion in 2024.
This massive Pakistani workforce creates:
- Natural demand channels for Pakistani consumer goods
- Business intelligence networks
- Distribution partnerships
- Cultural bridges facilitating trade
Vision 2030 Opportunities
Saudi Arabia’s diversification away from oil creates niches:
- Tourism infrastructure: Pakistan’s marble, furniture, and hospitality suppliers can participate
- Education & training: Pakistani IT professionals, engineers, and educators meet Saudi talent needs
- Healthcare services: Pakistan’s medical professionals and pharmaceutical exports align with Saudi healthcare expansion
- Entertainment & sports goods: Sialkot’s sports manufacturing expertise meets Saudi’s sports sector investments
Breaking into Saudi Markets
Leverage official channels: Pakistan-Saudi Joint Business Council and Special Investment Facilitation Council (SIFC) provide government-backed market access support.
Target Vision 2030 projects: Research specific mega-projects (NEOM, Red Sea, Qiddiya) and identify procurement opportunities. Many projects mandate local content but accept GCC+1 (including Pakistan) suppliers.
Establish Saudi presence: Free zones in Jeddah, Riyadh, and Dammam offer tax incentives. Saudi’s Ministry of Investment created a help desk for Pakistani companies, streamlining registration for 100+ Pakistani tech firms.
7. Netherlands: The $1.6 Billion European Gateway
Why the Dutch Market Matters
The Netherlands imported $1.6 billion worth of Pakistani goods in 2024, representing 4.9% of total exports. But Netherlands’ significance extends beyond direct consumption—Rotterdam serves as Europe’s primary gateway, redistributing Pakistani goods across the continent.
Exports to Netherlands totaled $1.001 billion in recent reporting periods, with steady growth driven by Dutch demand for textiles, food products, and re-export logistics.
What Dutch Buyers Seek
Home textiles & fashion: Dutch retailers source Pakistani bed linens, curtains, and cotton apparel for domestic sales and pan-European distribution.
Food products: Netherlands’ position as Europe’s food distribution hub creates demand for Pakistani rice, spices, and specialty foods that Dutch importers redistribute across EU markets.
Cut flowers complement: While Netherlands dominates floriculture, Pakistani dried flowers, craft items, and complementary products find niche markets.
The Rotterdam Effect
Rotterdam’s port handles 14 million containers annually. Pakistani exporters shipping to Rotterdam gain access to European inland waterways, rail networks, and road corridors that reduce distribution costs by 20-30% versus direct shipping to smaller European ports.
Dutch logistics companies (DHL, Kuehne+Nagel branches) specialize in breaking bulk shipments and handling customs for pan-European distribution—a service particularly valuable for mid-sized Pakistani exporters.
Strategic Approach
Focus on consolidation: Netherlands rewards exporters who can deliver consistent, large-volume shipments suitable for European redistribution. Partner with multiple Pakistani manufacturers to offer consolidated product ranges.
Sustainability sells: Dutch consumers rank among Europe’s most environmentally conscious. Products with credible green certifications (FSC, Fairtrade, organic) command premium prices.
Use Dutch as EU testing ground: Launch new products through Dutch importers to test European market reception before broader EU expansion.
Market Entry
Attend Rotterdam Fashion Week (apparel), Hotelympia (hospitality textiles), or sector-specific trade shows. Many Dutch importers prefer working through agents—consider partnering with established Pakistan-Netherlands trade facilitators based in Amsterdam or Rotterdam.
8. Spain: The $1.47 Billion Southern European Opportunity
Spain’s Growing Appetite
Spain imported $1.47 billion of Pakistani goods in 2024, accounting for 4.5% of total exports. More impressively, exports to southern Europe (primarily Spain and Italy) rose 12.19% to $1.159 billion, making it one of Pakistan’s fastest-growing European markets.
Spain offers distinct advantages: lower competition versus northern Europe, growing consumer spending as economy recovers, and strategic position for accessing Iberian and Latin American markets.
What Spain Imports
Textiles dominate: Spanish fast-fashion brands (Zara’s parent Inditex, Mango) and home goods retailers (El Corte Inglés) source Pakistani cotton apparel, home textiles, and accessories.
Leather goods: Spain’s leather goods sector values Pakistani leather jackets, bags, and footwear that complement Spanish design aesthetics.
Rice & food: Spain’s immigrant population and multicultural consumer base create demand for basmati rice, spices, and halal products.
Surgical instruments: Spanish medical suppliers import Pakistani precision instruments for hospitals and clinics.
Competitive Positioning
Spain’s purchasing power sits between premium northern European markets and price-sensitive eastern Europe, creating a “Goldilocks zone” where Pakistani exporters can offer quality products at competitive prices without racing to the bottom.
Spanish buyers increasingly seek “nearshoring” alternatives to Asian suppliers due to supply chain disruptions. Pakistan’s GSP+ access, direct shipping routes, and reliable production capacity make it attractive versus uncertain Chinese supplies.
Cultural Connections
Spain’s historical ties with Islamic heritage (Al-Andalus era) create unexpected cultural affinity. Marketing Pakistani products emphasizing craftsmanship, traditional techniques, and cultural heritage resonates with Spanish consumers valuing authenticity.
Entry Strategy
Barcelona and Madrid focus: These metropolitan hubs account for 60%+ of Spanish imports. Establish relationships with importers and trading houses in these cities.
Attend trade fairs: Feria Internacional de la Moda (Barcelona fashion), Textilhogar (home textiles, Valencia), Alimentaria (food & beverage, Barcelona).
Leverage language: Spanish-speaking Pakistani business professionals are rare—invest in Spanish-language capability or partner with bilingual agents to build stronger relationships.
Target fashion brands directly: Many Spanish fashion brands seek suppliers willing to handle smaller, flexible orders versus Chinese factories demanding minimum quantities. This creates opportunities for medium-sized Pakistani manufacturers.
9. Afghanistan: The $1.51 Billion Overlooked Neighbor
The Afghanistan Paradox
Afghanistan imported $1.51 billion from Pakistan in 2024, representing 4.7% of exports. Remarkably, exports to Afghanistan surged 55.2% year-over-year, making it one of Pakistan’s fastest-growing markets despite security challenges.
Afghanistan represents Pakistan’s most geographically proximate major market, with negligible shipping costs, cultural affinity, and complementary economic structures that create natural trade flows.
What Afghanistan Needs
Everything: As a landlocked, conflict-affected economy, Afghanistan depends heavily on Pakistani imports across categories:
Food products: Wheat flour, edible oils, sugar, tea, and processed foods dominate trade. Afghanistan’s limited agricultural processing capacity creates perpetual demand.
Construction materials: Cement, steel, paint, and building materials supply Afghanistan’s reconstruction and housing needs.
Textiles: Fabric, ready-made garments, and home textiles meet domestic consumption and re-export to Central Asian markets.
Pharmaceuticals: Pakistani medicines provide affordable healthcare solutions for Afghan population.
Consumer goods: Household items, electronics, appliances—most imported from China through Pakistan—flow across the border.
Strategic Considerations
Payment risks require management: Afghan currency instability and banking limitations create payment challenges. Many transactions occur through informal hawala networks or third-country banks. Experienced Afghan trade partners and secured payment mechanisms are essential.
Use Pakistan’s transit advantage: Pakistan serves as Afghanistan’s primary trade corridor to global markets. Pakistani exporters can position as logistics hubs, consolidating Afghanistan-bound goods from global suppliers.
Transit trade restrictions: Pakistan and Afghanistan have complex transit trade agreements. Understanding bilateral arrangements prevents customs headaches.
Beyond Afghanistan: Central Asia Gateway
Afghanistan’s strategic location makes it a potential gateway to Central Asian markets (Uzbekistan, Tajikistan, Turkmenistan) worth exploring. Pakistani goods transiting through Afghanistan can reach these markets, though infrastructure and regulatory challenges require careful navigation.
Risk-Adjusted Approach
Start with established channels: Work with experienced Afghan importers who’ve navigated cross-border trade for years. Afghan trader communities in Peshawar and Quetta facilitate connections.
Demand security: Insist on advance payments or confirmed letters of credit for large transactions. Afghan market’s growth potential justifies caution, not paralysis.
Explore border markets: Cities like Torkham (Khyber Pakhtunkhwa-Nangarhar border) and Chaman (Balochistan-Kandahar border) host formal and informal trading hubs where relationships form naturally.
10. Italy: The $1.1 Billion Fashion & Design Capital
Italian Sophistication Meets Pakistani Craftsmanship
Italy imported $1.1 billion of Pakistani goods in 2024, representing 3.5% of exports. While exports to Italy stood at $747 million in recent periods, Italy’s fashion-forward markets and design-conscious consumers create unique opportunities for Pakistani exporters emphasizing quality and aesthetics.
Italy represents more than a market—it’s a branding platform. Products accepted by Italian buyers gain credibility that opens doors across Europe and globally.
What Italians Value
Premium textiles: Italian fashion houses (Armani, Versace, Prada) and mid-tier brands source high-quality Pakistani cotton fabrics, linens, and specialty textiles that meet exacting standards.
Home textiles: Italian interior design stores import Pakistani bed linens, towels, and decorative textiles appealing to design-conscious consumers.
Leather goods: Italy’s leather heritage creates demand for quality Pakistani leather hides and semi-finished leather products used in Italian manufacturing.
Rice: Italy’s risotto culture creates demand for specialty rice varieties, including Pakistani basmati for fusion cuisine.

The Quality Premium
Italian buyers pay premium prices for products meeting their quality expectations. This creates opportunities for Pakistani exporters willing to invest in:
- Superior raw materials (long-staple cotton, premium leather)
- Advanced manufacturing (Italian-standard finishing, precision)
- Design collaboration (working with Italian designers to create products specifically for Italian tastes)
Competitive Dynamics
Italy faces pricing pressure from low-cost Asian suppliers but refuses to compromise on quality. Pakistani exporters occupying the “high-quality, moderate-price” position can capture market share from both expensive European suppliers and lower-quality Asian competitors.
Fashion Industry Integration
Some Pakistani manufacturers have successfully integrated into Italian fashion supply chains, producing specific components (embroidered fabrics, specialty trims, leather goods) that Italian brands incorporate into finished products.
This “hidden supplier” model allows Pakistani businesses to earn higher margins than commodity textile exports while building capabilities that later enable branded product launches.
Market Penetration
Milano Unica (textile trade fair, Milan) and Pitti Immagine (fashion trade fair, Florence) are essential networking venues. Italian buyers value personal relationships—invest time in building trust through repeated visits and consistent communication.
Focus on Emilia-Romagna and Lombardy: These regions host Italy’s textile and fashion manufacturing hubs, creating density of potential buyers and partners.
Consider design partnerships: Collaborate with Italian designers who can position Pakistani craftsmanship within contemporary design contexts. Italian design + Pakistani production = competitive advantage.
Comparative Analysis: Choosing Your Target Markets
The table below compares these 10 destinations across key decision factors:
| Destination | Market Size (2024) | Growth Rate | Entry Difficulty | Payment Security | Best For |
|---|---|---|---|---|---|
| United States | $5.6B | Moderate (6-8%) | Medium | Highest | Large-scale textile, IT services, established exporters |
| UAE | $2.08B (goods) | Very High (41%) | Low | High | Food, logistics hub, regional gateway |
| UK | $2.1B | Moderate (8%) | Medium | High | Textiles, ethnic markets, Commonwealth access |
| Germany | $1.72B | Moderate-High (15%) | High | Very High | Quality textiles, surgical instruments, technical goods |
| China | $2.4B | Declining (-10%) | Very High | Medium | Agricultural products, raw materials |
| Saudi Arabia | $734M | Very High (41%) | Medium | High | Food, IT services, Vision 2030 opportunities |
| Netherlands | $1.6B | Moderate (10%) | Medium | Very High | European logistics hub, sustainability-focused |
| Spain | $1.47B | High (12-15%) | Low-Medium | High | Fashion, home textiles, growing consumer market |
| Afghanistan | $1.51B | Very High (55%) | Low | Low | Construction, food, consumer goods, high risk/reward |
| Italy | $1.1B | Low-Moderate (3-5%) | High | High | Premium textiles, design collaboration, quality-focused |
Risk-Return Framework
Highest Growth Potential: Afghanistan (55% YoY), UAE (41% YoY), Saudi Arabia (41% YoY)
Safest Markets: United States, Germany, Netherlands (stable institutions, reliable payments)
Easiest Entry: UAE, Spain, Afghanistan (lower regulatory complexity)
Premium Pricing Opportunities: Germany, Italy, UK (quality-conscious consumers)
Volume Leaders: United States, China, UAE (largest absolute market sizes)
Emerging Opportunities: Saudi Arabia IT services, UAE food sector, Spain fashion
Strategic Recommendations: Building Pakistan’s Export Future
For Pakistani Policymakers
1. Sector-Specific Strategies
Pakistan cannot be all things to all markets. Government support should focus on:
- Textiles: Maintain competitiveness through GSP+ preservation, technology upgrades, and sustainability certifications
- IT Services: Accelerate PSEB initiatives, expand Special Technology Zones, ensure internet reliability
- Agriculture: Invest in cold chain logistics, phytosanitary certifications, and food safety standards to unlock Gulf and European markets
- Surgical Instruments: Support Sialkot cluster with advanced manufacturing training and ISO certifications
- Pharmaceuticals: Fast-track WHO GMP compliance to access premium markets
2. Infrastructure Priorities
The $32.34 billion export target demands infrastructure investments:
- Port modernization: Karachi and Gwadar ports need automation and efficiency upgrades to reduce dwell times
- Air cargo expansion: IT services and high-value goods need reliable, affordable air freight
- Digital connectivity: Stable internet infrastructure is now as critical as roads for service exporters
3. Trade Agreements
Negotiate trade deals strategically:
- Pakistan-UK Enhanced Partnership: Capitalize on post-Brexit UK’s appetite for new partners
- Deepened Saudi Relations: Convert political goodwill into concrete trade frameworks
- EU GSP+ Renewal: Begin preparation NOW for 2027 renewal—losing GSP+ would devastate European exports
For Pakistani Business Leaders
1. Diversification Imperative
Over-reliance on traditional markets creates vulnerability. Smart exporters should:
- Allocate 20-30% of export development budgets to emerging markets (Saudi Arabia, Spain, UAE growth sectors)
- Test products in 2-3 new markets annually before committing resources
- Build geographic diversification into business plans, not as afterthought
2. Quality Over Volume
Competing on price alone is a race to the bottom. Premium markets (Germany, Italy, UK) pay 15-40% more for certified, high-quality products. Investments in:
- International certifications (GOTS, OEKO-TEX, ISO 9001)
- Advanced manufacturing equipment
- Skilled workforce training
- Design and innovation capabilities
…pay off through higher margins and customer loyalty.
3. Digital Transformation
Post-COVID buyers expect digital capabilities:
- Professional English-language websites with e-commerce functionality
- Digital product catalogs with specifications and certifications
- Video demonstrations and virtual factory tours
- Social media presence (LinkedIn for B2B, Instagram for consumer goods)
Pakistan’s IT export success ($4.6B in FY24) proves Pakistani businesses can compete digitally. Manufacturing exporters must follow suit.
4. Leverage Government Resources
Pakistani exporters under-utilize available support:
- Trade Development Authority of Pakistan (TDAP): Provides market research, trade mission participation, exhibition support
- Export Development Fund: Offers financial support for market development
- Pakistan Software Export Board: Helps IT exporters with international marketing
- Board of Investment: Facilitates connections with foreign buyers and investors
For Entrepreneurs & New Exporters
1. Start Small, Think Big
You don’t need $1 million to export. Start with:
- E-commerce platforms: Amazon Global, Alibaba, Etsy (for crafts), Fiverr/Upwork (for services)
- Trade agents: Partner with established export houses that handle logistics and payments
- Government programs: TDAP and SMEDA offer new exporter training and support
2. Pick Your Market Wisely
New exporters should target:
- UAE: Easiest entry (low barriers, Pakistani diaspora, cultural affinity)
- Afghanistan: Lowest logistics costs, simple requirements (with risk management)
- Spain: Growing market, moderate competition, accessible buyers
Avoid starting with highly complex markets (China, Germany, USA) unless you have experienced partners.
3. Protect Yourself
Export payment fraud is real. Always:
- Use confirmed letters of credit for unknown buyers
- Verify buyer credentials through Pakistani embassies/trade missions
- Start with small trial orders before committing to large contracts
- Consider export credit insurance through State Bank programs
The $50 Billion Vision: Pakistan’s Export Trajectory 2025-2027
Pakistan’s export potential extends far beyond current $32.34 billion. These 10 markets collectively represent over $50 billion in addressable opportunities by 2027 if Pakistan executes strategically.
Realistic Growth Scenarios
Conservative Scenario (7-8% annual growth):
- 2025: $34.5 billion
- 2026: $37.2 billion
- 2027: $40.1 billion
Moderate Scenario (12-15% annual growth):
- 2025: $36.2 billion
- 2026: $41.5 billion
- 2027: $47.7 billion
Aggressive Scenario (20%+ annual growth):
- 2025: $38.8 billion
- 2026: $46.6 billion
- 2027: $55.9 billion
The aggressive scenario requires:
- Political stability and policy consistency
- Infrastructure investments (ports, digital, roads)
- Sustained GSP+ access to Europe
- Major breakthrough in IT services exports to Saudi Arabia and Gulf markets
- Agricultural export expansion through improved cold chain logistics
Key Performance Indicators to Watch
Track these metrics quarterly to assess progress:
- Geographic Diversification Index: Are top 5 markets becoming less dominant?
- High-Value Export Share: Is IT services/pharmaceuticals/surgical instruments growing faster than textiles?
- GSP+ Utilization Rate: Are exporters maximizing tariff preferences (currently 78.7%)?
- Payment Default Rate: Improving payment security indicates market maturity
- New Market Penetration: Number of first-time export destinations annually
Frequently Asked Questions (FAQ)
1. Which Pakistani products have the highest export growth potential globally?
IT services lead growth trajectories with 26.4% annual increases, reaching $4.6 billion in FY 2024-25. Surgical instruments from Sialkot, pharmaceutical products meeting international standards, and premium food products (organic basmati rice, mangoes) show exceptional potential. Traditional textile exports remain vital but require value addition through sustainability certifications and technical textiles to maintain competitiveness.
2. How can small and medium Pakistani businesses start exporting?
Begin with UAE markets leveraging Pakistani diaspora networks and cultural familiarity. Utilize Pakistan Software Export Board (PSEB) resources for IT services or Trade Development Authority of Pakistan (TDAP) programs for goods. Start through e-commerce platforms like Amazon Global or Alibaba before establishing direct relationships. Consider partnering with established export houses that handle logistics, payments, and regulatory compliance while you focus on production.
3. What certifications do Pakistani exporters need for European markets?
European buyers require GSP+ tariff utilization documentation plus sector-specific certifications: GOTS (Global Organic Textile Standard) or OEKO-TEX for textiles, ISO 9001 for quality management, ISO 14001 for environmental management, and CE marking for applicable products. Food exporters need HACCP certification and EU phytosanitary compliance. These investments typically return 15-40% price premiums in German, UK, and Italian markets.
4. Is exporting to Afghanistan safe and profitable for Pakistani businesses?
Afghanistan offers exceptional growth (55% year-over-year increase to $1.51 billion) with minimal shipping costs and cultural advantages. However, payment risks require mitigation through advance payments, confirmed letters of credit, or working with established Afghan trading partners. Construction materials, food products, and consumer goods see sustained demand. Risk-adjusted returns can exceed safer markets for businesses implementing proper payment security measures.
5. How is Pakistan’s IT services sector competing globally?
Pakistan’s IT sector achieved $4.6 billion exports in FY 2024-25 with 26.4% growth, positioning Pakistan as a competitive outsourcing destination. Key competitive advantages include: English proficiency, 8-hour time zone overlap with Europe, 30-40% cost savings versus Western markets, and growing technical talent pool. United States absorbs 54.5% of Pakistani IT exports, while Saudi Arabia’s IT imports from Pakistan surged 48% year-over-year. Focus areas include software development, cybersecurity services, and business process outsourcing.
6. What trade agreements benefit Pakistani exporters most?
EU’s Generalized System of Preferences Plus (GSP+) provides the largest benefit, granting duty-free or reduced tariffs on 66% of product categories to European markets. Approximately 78.7% of EU imports from Pakistan utilize GSP+ preferences, making it essential for competitiveness. Pakistan also benefits from preferential arrangements with SAARC countries, FTA with Mauritius, and is negotiating enhanced partnerships with UK post-Brexit. Maintaining GSP+ eligibility through labor and environmental compliance is critical for export competitiveness.
7. How can Pakistani textile exporters differentiate from Chinese and Bangladeshi competition?
Emphasize quality over price competition through long-staple Egyptian cotton blends, sustainability certifications (GOTS, OEKO-TEX), and ethical labor practices. Target premium market segments in Germany, Italy, and UK where buyers pay 20-30% premiums for certified sustainable products. Develop technical textiles for automotive and industrial applications where precision matters more than cost. Partner with European designers to create unique value propositions that Chinese mass production cannot replicate.
Conclusion: Pakistan’s Export Awakening
Standing at the crossroads of 2025, Pakistan possesses something rare in emerging economies: genuine competitive advantages across multiple sectors, from centuries-old textile craftsmanship to cutting-edge IT capabilities. The 10 markets analyzed here—representing United States’ stability, UAE’s strategic gateway positioning, European quality premiums, Gulf development opportunities, and regional trade dynamics—collectively offer Pakistani businesses a roadmap to export-led prosperity.
The data tells a compelling story: $32.34 billion in current exports, IT services surging 26.4% annually, UAE trade jumping 41%, and Saudi Arabia emerging as a transformational opportunity. But numbers alone don’t create success. Execution does.
Pakistani exporters who invest in quality, embrace certifications, build digital capabilities, and strategically diversify markets will capture disproportionate gains. Those who remain commodity-focused and single-market dependent will struggle.
For government and business leaders alike, the imperative is clear: Pakistan’s export potential isn’t constrained by global demand—it’s constrained by infrastructure, policy consistency, and willingness to compete on quality rather than merely price. The $50 billion export economy Pakistan needs by 2027 isn’t aspirational fiction. It’s achievable reality for a nation willing to execute strategically.
The world is buying. The question is: Is Pakistan ready to sell?
Sources & Data Attribution
This article incorporates data from:
- State Bank of Pakistan Trade Statistics
- Pakistan Bureau of Statistics Export Data
- Ministry of Commerce Official Publications (pc.gov.pk)
- Ministry of Finance Economic Surveys (finance.gov.pk)
- Board of Investment Pakistan (invest.gov.pk)
- IMF World Economic Outlook Database
- World Bank World Integrated Trade Solution (WITS)
- Asian Development Bank Economic Indicators
- UN COMTRADE International Trade Statistics
- Trade Development Authority of Pakistan Reports
- Pakistan Software Export Board Industry Data
All statistics represent most recent available data as of December 2024 / January 2025 reporting periods.
Discover more from The Economy
Subscribe to get the latest posts sent to your email.


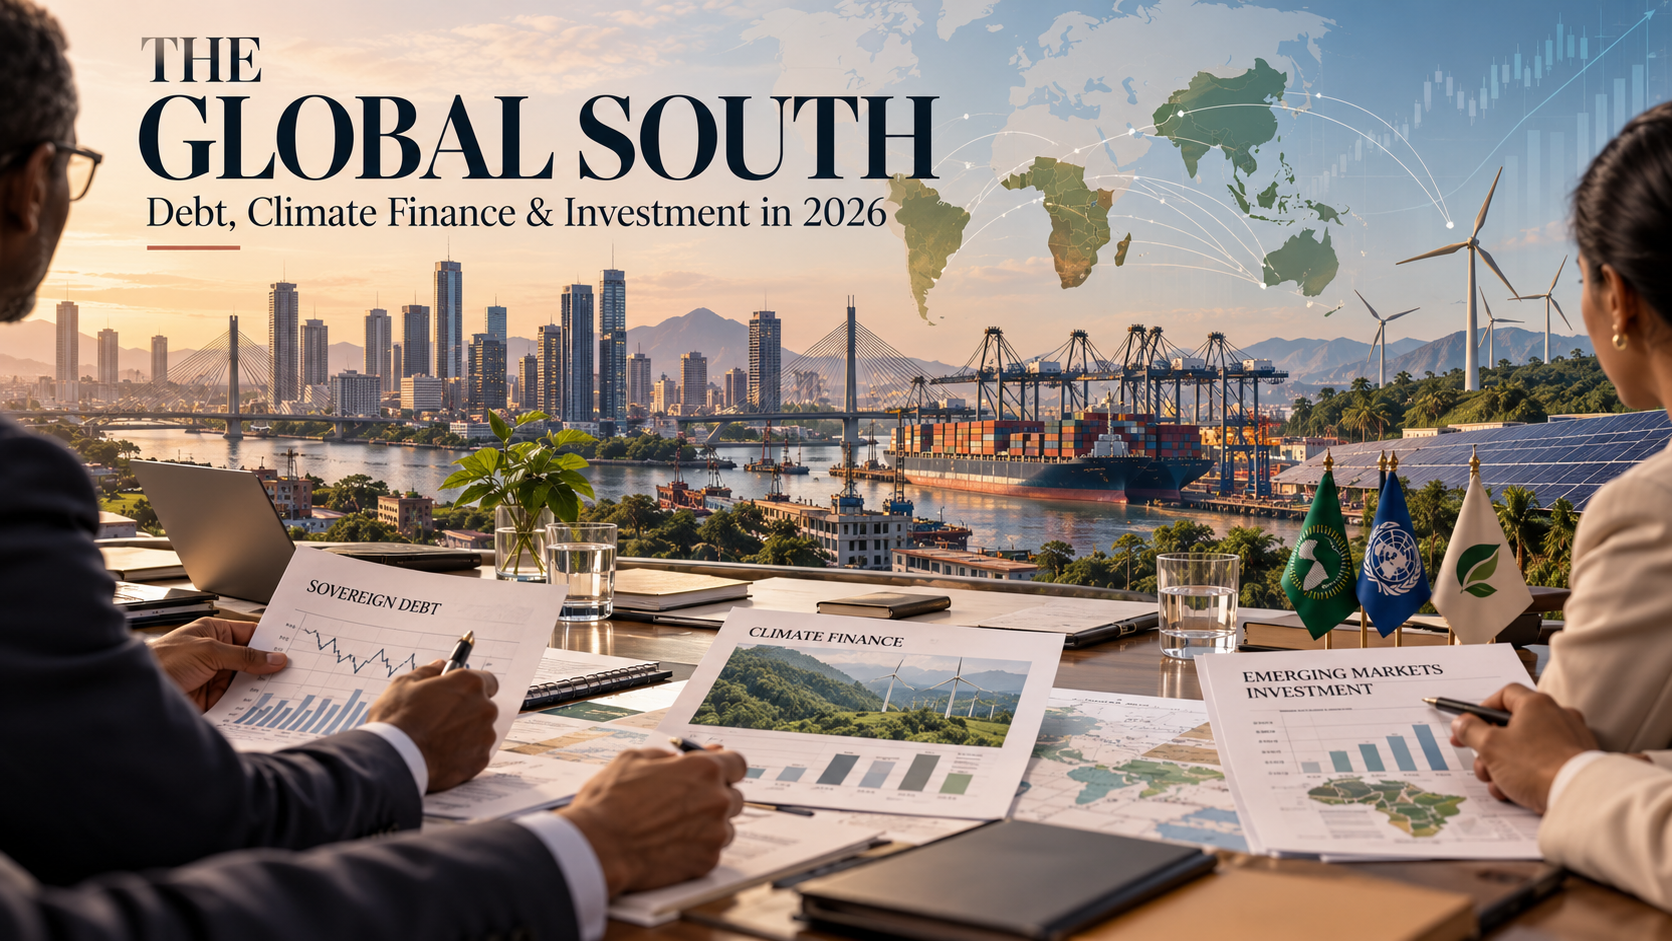
The central development problem of 2026 is not simply a shortage of money. It is the gap between where finance is most urgently needed and where private and public capital is most willing to go. Many developing economies face expensive debt, exposure to climate shocks and large infrastructure needs at the same time that investors concentrate on a smaller group of countries and commercially familiar projects.
The UNCTAD World Investment Report 2026 says global FDI rose 6% to $1.6 trillion in 2025, but developing economies recorded only 2% growth, to $901 billion. More than 80% of global inflows went to the 20 largest recipients. This concentration matters because an aggregate recovery in investment can conceal a deterioration in access for smaller, poorer and climate-exposed countries.
Key takeaways
- Global investment has recovered unevenly; a handful of major recipients capture much of the growth.
- High sovereign yields increase the cost of financing long-lived infrastructure projects.
- Climate-finance goals are international commitments, not proof that money has already been delivered.
- Public guarantees and blended finance can mobilize investment but create fiscal risks if poorly designed.
- Pakistan and other climate-vulnerable economies need bankable projects, transparent procurement and financing terms that fit public balance sheets.
The paradox of rising global investment
A stronger headline FDI figure suggests that multinational companies have regained confidence. Yet location and purpose matter. The UNCTAD report shows that strategic sectors—including AI infrastructure, semiconductors, critical minerals and energy-transition technologies—accounted for 44% of announced greenfield project values in 2025, compared with 16% in 2020.
That does not mean the same share of projects are operating, or that employment and skill transfer have already materialized. Greenfield announcements refer to planned investment. The resulting development benefits depend on implementation, workforce integration, supplier networks and local regulatory conditions.
A large capital-intensive project can raise investment totals without producing substantial local employment. By contrast, a smaller power-distribution upgrade or irrigation investment might have broader productivity effects. Development policy must therefore be guided by outcomes, not project headline values.
How debt turns an investment gap into a development trap
A government may need to finance flood protection, transport networks, schools and electricity grids. When sovereign borrowing yields rise, debt servicing claims a greater share of future tax revenue. The government may then postpone maintenance or investment, reducing growth capacity and weakening the very revenue prospects that underpin debt sustainability.
This is a feedback loop, not a certainty for every borrowing country. The IMF’s October 2026 analysis of sovereign yields warns that high debt makes fiscal balances and market interest rates more sensitive to each other. Its April Fiscal Monitor reported global public debt just below 94% of GDP in 2025, projected to reach 100% by 2029 in that forecast vintage.
Global averages should not be used to label all developing economies insolvent. Debt sustainability depends on borrowing currency, maturity, interest costs, export earnings, domestic savings, tax capacity and creditor terms. A country with long-maturity concessional loans can have a very different risk profile from one refinancing short-term foreign-currency obligations at market rates.
For development projects, repayment risk can be even more nuanced. A new port may generate fees in foreign currency; an irrigation scheme may generate valuable social and productivity returns but relatively little direct cash flow. Both can be economically justified, yet they require different financing designs.
Climate finance: targets versus disbursements
At COP29 in 2024, countries agreed on a new climate-finance goal of at least $300 billion annually by 2035 for developing countries, with developed countries taking the lead, and a broader effort to scale total finance to $1.3 trillion per year by 2035. These commitments are described by the UN Climate Change secretariat.
The distinction between an announced goal and money actually disbursed cannot be overstated. A country facing flood risk in 2026 cannot pay for an embankment with a target set for 2035. It needs project preparation, agreed terms, implementation capacity and accessible funding now.
Finance also takes different forms: grants, concessional loans, guarantees, private investment and domestic budget allocations. A dollar of grant funding does not impose the same repayment burden as a dollar borrowed at commercial rates. Comparing climate-finance totals without identifying their form can mislead the public about the net benefit to recipients.
Adaptation is especially challenging because many protective projects generate benefits by avoiding future losses rather than collecting revenue. Protecting a town from flooding can be valuable to society while offering no direct income stream to repay a private investor. That is a strong case for carefully designed public or concessional funding, not evidence that the project is unproductive.
Four finance tools, four different obligations
| Instrument | Appropriate use | Advantage | Main caution |
|---|---|---|---|
| Grant | Socially essential, low-revenue adaptation | No debt repayment | Limited availability and donor conditions |
| Concessional loan | Infrastructure with public benefits | Lower-cost, longer-tenor finance | Still adds obligations |
| Public guarantee | Partially de-risking a viable private project | Can attract capital | Creates contingent government liability |
| Commercial investment | Projects with credible cash flows | Mobilizes private expertise and funds | Return requirements may be incompatible with affordability |
Original comparison. Appropriate financing depends on project economics and sovereign capacity.
A well-designed programme matches the financing instrument to a project’s cash flows and social returns. Governments should not ask commercial investors to deliver unremunerated public goods, nor should they use scarce grants to subsidize projects that would have proceeded profitably anyway.
The problem of bankability
A project can be economically sensible but financially unready. Investors want to know who owns the land, which authority sets tariffs, what happens if construction is delayed, whether contracts are enforceable and how foreign exchange can be accessed. Without answers, the cost of financing rises or the investment does not proceed.
Project preparation therefore deserves more attention than it receives. Reliable feasibility studies, credible demand forecasts, environmental safeguards, procurement transparency and clear risk allocation are themselves forms of economic infrastructure. They make public money more effective and reduce the need to compensate financiers for avoidable uncertainty.
The UNCTAD investment analysis emphasizes whether international investment builds productive capacity, jobs, skills and technology transfer. Those are better metrics of development success than the number of investment memoranda signed.
The climate–debt dilemma is also a timing dilemma
A flood barrier must be built before the storm. Drought-resistant irrigation must be maintained before harvest conditions deteriorate. Yet governments with financing constraints may postpone such investment because its payoff is uncertain in timing while the upfront cost is immediate and politically visible.
This creates a bias toward emergency relief after a disaster rather than resilience beforehand. International institutions can help by offering longer-maturity finance, technical support, credible insurance mechanisms and rapid access to grants when shocks occur. But financing arrangements should be published and independently scrutinized, especially when guarantees and contingent obligations are involved.
The UN DESA policy brief on the Middle East conflict and development finance underlines how geopolitical and energy shocks can reduce the room available for development investment. A country paying more for imported fuel has fewer funds left for climate protection, even before the next flood or drought arrives.
Pakistan: making resilience investable without mortgaging the future
Pakistan is exposed to external energy and financing shocks while facing major needs in irrigation, drainage, flood protection and electricity-sector reform. The IMF’s October 7 Pakistan assessment says reforms supported by the Resilience and Sustainability Facility include climate-aware public investment planning and disaster-risk financing. It reports a staff-level agreement, subject to Executive Board approval—not an automatic release of funds.
Three practical steps would improve outcomes. First, rank projects by avoided economic loss and realistic operating costs, not political visibility. Second, publish the full fiscal exposure of guarantees and contracts. Third, build local capability to maintain infrastructure after its ribbon-cutting moment. Climate resilience fails when maintenance is unfunded or responsibilities are fragmented between agencies.
Pakistan should also treat export growth and climate investment as complementary goals. A more reliable electricity network and less flood-prone logistics system can make businesses more productive as well as more resilient. The benefit is not confined to future disasters; it shows up in fewer outages, better delivery and lower uncertainty today.
A five-question test for every financing pledge
- Is the funding approved and disbursable, or only politically announced?
- Is it a grant, loan, guarantee or expected private investment—and who ultimately pays?
- Which institution owns implementation, procurement and subsequent maintenance?
- How will results be measured in employment, resilience, productivity or emissions?
- Could repayment or foreign-currency obligations crowd out essential spending later?
The point is not to reject international funding. It is to distinguish investment that expands development capacity from financing that merely moves risk into the future. Transparency helps lenders as well as citizens by reducing costly ambiguity.
Risks and uncertainties
FDI data are revised and announced projects may not be completed. Climate-finance accounting differs across sources and instruments. Borrowing costs can rise or fall quickly, and physical climate losses are difficult to forecast precisely. No financing mechanism eliminates governance risk; concessional funds can still be misallocated. A credible assessment must use country-level debt profiles and project-level cash flows rather than infer individual conclusions from global aggregate figures.
Frequently asked questions
Is global FDI increasing in 2026?
UNCTAD reports a rise in global FDI during 2025 in its 2026 report. That is historical data, not a statement that every country experienced an increase in 2026.
Why do poorer countries struggle to attract investment?
Financing costs, infrastructure constraints, market size, regulatory uncertainty and project preparation can all affect investor decisions.
Is the $300 billion climate-finance goal already being paid annually?
No. The COP29 goal concerns annual finance by 2035; actual commitments and disbursements must be measured separately.
What is concessional finance?
Finance on more favourable terms than typical commercial borrowing, often involving lower interest rates or longer repayment periods.
Can climate projects increase debt risk?
Yes, if financed with unsuitable loans or guarantees; but well-designed investments can also reduce losses and strengthen productivity.
What should Pakistan prioritize?
High-value resilience projects, transparent financing terms, credible maintenance plans and export- and energy-related productivity gains.
Conclusion
The investment divide cannot be closed through pledges alone. Developing economies need capital that arrives on viable terms and builds useful assets, while financiers need transparent projects and credible repayment structures. The most important test of the global development system in 2026 is whether it can channel resources toward genuine resilience without making vulnerable countries more financially fragile.
Discover more from The Economy
Subscribe to get the latest posts sent to your email.

The global Banking growth is becoming more uneven, capital is increasingly sensitive to financing costs, and investors must distinguish a convincing story from an investable price. This guide focuses on research methods and risks rather than predictions of guaranteed returns. The IMF October 2026 outlook projects 3.1% global growth and 4.7% inflation for 2026, while the IMF financial-stability assessment warns that market resilience coexists with important vulnerabilities.
Key takeaways
- Match each investment decision to its time horizon, currency and ability to withstand losses.
- Separate observable earnings or contractual cash flows from optimistic forecasts.
- Compare diversification, fees, taxes, liquidity and regulatory restrictions before committing capital.
- Track primary institutional evidence and update assumptions when conditions change.
- Readers in Pakistan should consider rupee exposure and availability of regulated investment channels.
Why this matters now
The central question behind global banking trends 2026 is not merely what may happen next. It is which economic mechanisms could change cash flow, purchasing power or risk. The Bank for International Settlements’ 2026 review describes an economy supported by technological investment but constrained by geopolitical and fiscal pressures. A robust financial plan must therefore survive both a favourable and an adverse scenario.
Digital banks are extending beyond borders
Technology can reduce the need to duplicate large physical branch networks, but banking remains subject to local licensing, deposit protection, consumer law and capital rules. Cross-border scale is a business model, not a regulatory exemption. Readers should distinguish a licensed bank from an e-money provider, broker or unregulated payments application. See the primary institutional research.
For practical analysis, separate the baseline, the upside case and the downside case. Document the specific development that would change your assessment. Assess timing: a promising long-term theme may still be inappropriate for cash needed within twelve months.
Artificial intelligence in credit and fraud
Banks use machine learning for transaction screening, fraud detection, service operations and risk analysis. The operational promise is significant, but opaque credit models can create unfair outcomes, and false-positive fraud alerts can disrupt customers. Model governance requires testing, human accountability, explainability and correction routes. Customer consent does not remove every data-protection obligation. See the primary institutional research.
For practical analysis, separate the baseline, the upside case and the downside case. Document the specific development that would change your assessment. Assess timing: a promising long-term theme may still be inappropriate for cash needed within twelve months.
Cybersecurity is now systemic finance risk
An attack against a large processing vendor can affect many institutions simultaneously. The IMF’s October 2026 stability assessment identifies sophisticated cyber threats alongside sovereign-yield and AI valuation shocks. Banks should test recovery procedures, third-party concentration, authentication controls and incident communications, not merely purchase security software. See the primary institutional research.
For practical analysis, separate the baseline, the upside case and the downside case. Document the specific development that would change your assessment. Assess timing: a promising long-term theme may still be inappropriate for cash needed within twelve months.
Compliance: technology must support judgment
Anti-money-laundering monitoring, sanctions screening and know-your-customer processes are increasingly automated. False matches and poor data can cause excessive account restrictions, while under-detection carries serious legal exposure. Institutions need measurable controls, independent audits and escalation channels. The Financial Stability Board provides international coordination context but rules vary by jurisdiction. See the primary institutional research.
For practical analysis, separate the baseline, the upside case and the downside case. Document the specific development that would change your assessment. Assess timing: a promising long-term theme may still be inappropriate for cash needed within twelve months.
What Pakistani customers and banks should do
Customers should verify a provider’s licensing status, understand complaint mechanisms, enable strong authentication and never disclose one-time passcodes. Financial firms need resilient payment systems, staff training and clear consent practices. Track SBP circulars for locally applicable requirements rather than extrapolating foreign regulations to Pakistan. See the primary institutional research.
For practical analysis, separate the baseline, the upside case and the downside case. Document the specific development that would change your assessment. Assess timing: a promising long-term theme may still be inappropriate for cash needed within twelve months.
Comparison and decision framework
| Question | Stronger evidence | Warning sign |
|---|---|---|
| What drives returns? | Audited cash flows, clear contract or transparent index | Undefined or projected returns |
| What can go wrong? | Explicit scenario and downside analysis | Claims of guaranteed gains |
| Is it affordable to hold? | Low transparent fees and adequate liquidity | Leverage, costly spreads or lockups |
| Is access legitimate? | Appropriate licensing and clear legal rights | Unverified brokers or custody |
| Is the exposure diversified? | Multiple independent sources of return | One company, sector or currency |
What it means for Pakistani savers and investors
A Pakistani reader faces both international investment risk and local purchasing-power risk. For example, a foreign asset can rise in US-dollar terms while the rupee conversion and transaction costs alter the realized local outcome. The opposite can also occur. Record the starting exchange rate, applicable taxes, custody charges and capital-transfer restrictions, and confirm current requirements with the State Bank of Pakistan and the relevant securities regulator. Overseas access should not be assumed universally available.
An emergency reserve, expensive consumer debt and near-term family obligations deserve attention before any speculative allocation. A portfolio that cannot meet a sudden cash requirement may force sales at the worst moment. The objective is not to remove risk—impossible in markets—but to choose risks that fit the investor’s actual liabilities.
Risks, limitations and uncertainty
Institutional forecasts are conditional and can change after policy decisions, commodity shocks, conflict escalation or unexpectedly weak earnings. Historic correlations are not binding promises about future asset performance. The analysis does not provide live stock prices, current investment product quotes, real-time exchange rates or individualized tax advice. Prices, regulations and product eligibility should be checked on the transaction date.
Frequently asked questions
Is this a guaranteed investment opportunity?
No. Every financial asset or strategy involves uncertainty. The existence of a popular investment theme is not evidence that an individual security is fairly priced.
What should beginners examine first?
Understand the product, the financial loss you could tolerate, fees and liquidity. Verify the provider and decide whether the money may be needed soon.
How do interest rates affect the analysis?
They influence financing costs, discount rates, exchange rates and demand. The effect differs by sector, maturity and business balance sheet.
Can Pakistani residents invest in foreign markets?
Access depends on current foreign-exchange, banking, brokerage, securities and tax rules, and on the investor’s individual circumstances. Check current regulations and regulated providers rather than assuming access.
How often should this analysis be refreshed?
Review institutional economic releases monthly and re-evaluate immediately after material earnings, regulatory or policy changes. Avoid reacting mechanically to every daily market movement.
Is diversification enough to prevent losses?
No. Diversification may reduce company-specific risk but cannot eliminate broad market, currency, inflation or systemic risks.
Conclusion
Sound financial decisions begin with verifiable evidence, reasonable valuation, awareness of uncertainty and a plan that survives adverse outcomes. Readers should compare multiple independent sources and avoid letting a compelling headline substitute for due diligence.
Discover more from The Economy
Subscribe to get the latest posts sent to your email.
Global growth is not the same as broad prosperity. Pakistan’s outcomes will depend less on the global average than on the channels through which external demand, energy, financing, and technology influence local firms. This feature explains the mechanisms, risks and practical decisions that matter through 2027, with particular attention to Pakistan’s different exposure to energy prices, external financing, global trade and AI investment.
At a glance
- World output is forecast to rise, but opportunities and costs are uneven across countries.
- Global inflation forecasts do not predict household prices in Pakistan.
- The AI capital expenditure cycle lifts trade in electronics but may not translate into productivity gains everywhere.
- Pakistan’s IMF staff-level agreement is a milestone, not final Board approval.
- Stronger exports, competitive energy, fiscal credibility and skills are essential to durable growth.
The verified starting point: what the numbers actually say
The IMF October 2026 World Economic Outlook projects global growth of 3.1% in calendar 2026 and 3.4% in calendar 2027, alongside global headline inflation of 4.7% and 4.1%, respectively. Its statistical cutoff is 1 October 2026. The WTO October 2026 trade outlook projects merchandise trade volume growth of 3.9% in 2026 and 4.1% in 2027, versus commercial-services trade volume growth of 3.3% and 6.4%. These are forecasts from different statistical systems, not interchangeable growth measures.
For Pakistan, the IMF Pakistan October 7 staff-level agreement estimated FY2026 growth of 3.6%, September headline inflation of approximately 10.3%, and gross reserves near $21.5 billion at end-September. The fourth EFF review and third RSF review had reached staff-level agreement only, pending IMF Executive Board approval as of the release. Pakistan’s fiscal years run July–June; IMF global growth figures refer to calendar years.
| Indicator | 2026 | 2027 | Important distinction |
|---|---|---|---|
| IMF world GDP growth | 3.1% | 3.4% | Calendar-year projection |
| IMF world headline inflation | 4.7% | 4.1% | Global estimate, not Pakistan CPI |
| WTO goods trade volume growth | 3.9% | 4.1% | Real volume, not nominal trade value |
| WTO commercial services volume growth | 3.3% | 6.4% | Conditional rebound, not guaranteed |
The World Bank June 2026 Global Economic Prospects provides an earlier comparison framework, but its publication date and methodology differ from the October IMF and WTO releases. A thoughtful analysis should compare like with like and should never treat projections as realized outcomes. For a Pakistan-focused story, the crucial question is how global conditions enter domestic economic life.
Why this story matters now
The WTO October 2026 executive summary says AI-enabling goods accounted for 47% of year-on-year growth in the value of world merchandise trade during the first half of 2026. That does not mean 47% of all merchandise trade was AI-related. It identifies a contribution to growth, and in nominal value terms. The same source notes that AI-enabling goods trade rose 67% year-on-year in that period. These figures show how a narrow technology cycle can make global trade appear stronger even as other sectors struggle.
Meanwhile the Reuters October 2026 IMF annual meetings reports persistent concern about global financial risks, geopolitical disruptions and the uneven sharing of AI gains. The Reuters October 2026 Asian growth describes a region where technology investment supports some exporters while energy costs and higher yields challenge others. Pakistan is therefore exposed simultaneously to a potential technology opportunity and to more conventional fuel, financing and trade vulnerabilities.
Why the headline growth rate hides divergence
For why the headline growth rate hides divergence, Growth averages blur distribution. A country manufacturing sought-after electronics can gain from a technology upcycle while an energy importer faces a larger fuel invoice. That contrast explains why Pakistan needs an exposure-weighted reading of international forecasts rather than simply celebrating a higher headline GDP projection.
This matters for economic decision-making because firms and households cannot adjust instantaneously when conditions shift. Prices, contracts, worker skills and financial obligations move on different schedules. Analysts should identify the timetable, who bears the immediate cost, and who may capture the longer-term benefit.
A credible implementation plan requires named institutions, measurable indicators and regular public reporting. The point is not to promise an effortless transition; it is to make policy options concrete enough to compare their benefits and trade-offs.
Pakistan-specific decision test. For why the headline growth rate hides divergence, ask four questions: (1) Which import cost, export opportunity, credit channel or productivity constraint is affected? (2) Which groups face the first-round effects? (3) What could policymakers or firms change within six months? (4) Which published indicator would demonstrate improvement rather than merely announce activity?
What to monitor: (i) official monthly or quarterly data; (ii) movements in export receipts and import bills; (iii) price changes versus changes in physical volumes; (iv) borrowing and working-capital costs; and (v) job quality and household purchasing power. A single monthly reading can be noisy. Comparing several releases helps distinguish a trend from a short-lived disturbance.
Pakistan’s four exposure channels
For pakistan’s four exposure channels, The most useful indicator is not one number but a sequence: orders received by exporters, import bills, financial inflows, electricity charges and jobs created. These measures reach families at different speeds, which is why apparently stable GDP figures can coexist with a sense of economic pressure.
This matters for economic decision-making because firms and households cannot adjust instantaneously when conditions shift. Prices, contracts, worker skills and financial obligations move on different schedules. Analysts should identify the timetable, who bears the immediate cost, and who may capture the longer-term benefit.
A credible implementation plan requires named institutions, measurable indicators and regular public reporting. The point is not to promise an effortless transition; it is to make policy options concrete enough to compare their benefits and trade-offs.
Pakistan-specific decision test. For pakistan’s four exposure channels, ask four questions: (1) Which import cost, export opportunity, credit channel or productivity constraint is affected? (2) Which groups face the first-round effects? (3) What could policymakers or firms change within six months? (4) Which published indicator would demonstrate improvement rather than merely announce activity?
What to monitor: (i) official monthly or quarterly data; (ii) movements in export receipts and import bills; (iii) price changes versus changes in physical volumes; (iv) borrowing and working-capital costs; and (v) job quality and household purchasing power. A single monthly reading can be noisy. Comparing several releases helps distinguish a trend from a short-lived disturbance.
What the latest IMF agreement does and does not mean
For what the latest imf agreement does and does not mean, Economic resilience is the capacity to manage adverse shocks without repeatedly disrupting investment and consumption. Predictable policy, transparent fiscal choices and adequate external liquidity matter alongside short-term growth acceleration.
This matters for economic decision-making because firms and households cannot adjust instantaneously when conditions shift. Prices, contracts, worker skills and financial obligations move on different schedules. Analysts should identify the timetable, who bears the immediate cost, and who may capture the longer-term benefit.
A credible implementation plan requires named institutions, measurable indicators and regular public reporting. The point is not to promise an effortless transition; it is to make policy options concrete enough to compare their benefits and trade-offs.
Pakistan-specific decision test. For what the latest imf agreement does and does not mean, ask four questions: (1) Which import cost, export opportunity, credit channel or productivity constraint is affected? (2) Which groups face the first-round effects? (3) What could policymakers or firms change within six months? (4) Which published indicator would demonstrate improvement rather than merely announce activity?
What to monitor: (i) official monthly or quarterly data; (ii) movements in export receipts and import bills; (iii) price changes versus changes in physical volumes; (iv) borrowing and working-capital costs; and (v) job quality and household purchasing power. A single monthly reading can be noisy. Comparing several releases helps distinguish a trend from a short-lived disturbance.
What businesses should prepare for
For what businesses should prepare for, Growth averages blur distribution. A country manufacturing sought-after electronics can gain from a technology upcycle while an energy importer faces a larger fuel invoice. That contrast explains why Pakistan needs an exposure-weighted reading of international forecasts rather than simply celebrating a higher headline GDP projection.
This matters for economic decision-making because firms and households cannot adjust instantaneously when conditions shift. Prices, contracts, worker skills and financial obligations move on different schedules. Analysts should identify the timetable, who bears the immediate cost, and who may capture the longer-term benefit.
A credible implementation plan requires named institutions, measurable indicators and regular public reporting. The point is not to promise an effortless transition; it is to make policy options concrete enough to compare their benefits and trade-offs.
Pakistan-specific decision test. For what businesses should prepare for, ask four questions: (1) Which import cost, export opportunity, credit channel or productivity constraint is affected? (2) Which groups face the first-round effects? (3) What could policymakers or firms change within six months? (4) Which published indicator would demonstrate improvement rather than merely announce activity?
What to monitor: (i) official monthly or quarterly data; (ii) movements in export receipts and import bills; (iii) price changes versus changes in physical volumes; (iv) borrowing and working-capital costs; and (v) job quality and household purchasing power. A single monthly reading can be noisy. Comparing several releases helps distinguish a trend from a short-lived disturbance.
The policy choices that determine resilience
For the policy choices that determine resilience, The most useful indicator is not one number but a sequence: orders received by exporters, import bills, financial inflows, electricity charges and jobs created. These measures reach families at different speeds, which is why apparently stable GDP figures can coexist with a sense of economic pressure.
This matters for economic decision-making because firms and households cannot adjust instantaneously when conditions shift. Prices, contracts, worker skills and financial obligations move on different schedules. Analysts should identify the timetable, who bears the immediate cost, and who may capture the longer-term benefit.
A credible implementation plan requires named institutions, measurable indicators and regular public reporting. The point is not to promise an effortless transition; it is to make policy options concrete enough to compare their benefits and trade-offs.
Pakistan-specific decision test. For the policy choices that determine resilience, ask four questions: (1) Which import cost, export opportunity, credit channel or productivity constraint is affected? (2) Which groups face the first-round effects? (3) What could policymakers or firms change within six months? (4) Which published indicator would demonstrate improvement rather than merely announce activity?
What to monitor: (i) official monthly or quarterly data; (ii) movements in export receipts and import bills; (iii) price changes versus changes in physical volumes; (iv) borrowing and working-capital costs; and (v) job quality and household purchasing power. A single monthly reading can be noisy. Comparing several releases helps distinguish a trend from a short-lived disturbance.
Policy options: three alternative paths, not numerical forecasts
| Scenario | Assumptions | Implications for Pakistan | Early warning or confirmation |
|---|---|---|---|
| More favorable | Energy costs stabilize; export markets remain open; AI use generates measurable efficiency | Space for investment, steadier purchasing power and stronger services exports | Export orders, real income and private investment improve together |
| Central case | Global growth follows the broad institutional outlook; commodity and funding pressures fluctuate | Gradual recovery with uneven gains across sectors | Stable external balances without a broad productivity surge |
| Adverse | Energy disruptions persist; financing costs rise; AI investment is repriced | Imports become more costly, credit tighter and fiscal choices harder | Reserves, inflation expectations and financing costs weaken at once |
These are qualitative editorial scenarios, not probabilities assigned by an econometric model. Their value lies in clarifying which evidence would require an updated judgment. The IMF October 2026 World Economic Outlook explicitly emphasizes downside risks involving conflict, trade tension, debt and reassessment of AI expectations.
A practical action agenda
For policymakers, the first responsibility is to protect hard-won macroeconomic stability while removing barriers to productivity. Regulatory predictability, tax administration, targeted social protection and transparent energy decisions are more useful than shifting incentives that are impossible for businesses to plan around. The IMF Pakistan 2026 country report identifies revenue mobilization, reform of state enterprises, energy-sector viability and improvements in human capital as linked policy priorities.
For exporters, resilience means identifying where demand is growing, investing in reliable delivery and obtaining credible certifications. Export strategies should track volumes, domestic value added and customer retention; gross receipts alone do not disclose profitability. For small businesses, the practical priority is to map exposure to fuel, electricity, imports and foreign-exchange requirements and to stress-test cash flows before making expansion commitments.
For households, risk management begins with an affordable budget, attention to debt servicing and a realistic distinction between nominal wage gains and purchasing power. For workers, portable skills and credible training can expand options across changing industries. None of this makes external shocks harmless; it simply offers concrete ways to be less exposed.
How this analysis differs from generic global coverage
Major international reporting is indispensable for establishing what happened. The Reuters October 2026 WTO briefing emphasizes the boost from AI to merchandise trade and the pressure of geopolitical disruption. Institutional releases provide detailed projections. This article goes a step further by asking how those macroeconomic signals might translate into local import costs, export competitiveness, employment, household budgets and reform choices. It is an interpretation of attributed evidence, not a claim of exclusive interviews or original field reporting.
The difference is particularly relevant for Pakistan because a global technology boom may coincide with higher costs for countries that import fuel but do not manufacture the equipment in highest demand. No serious strategy should assume that a worldwide headline rate automatically delivers the same benefits locally.
Frequently asked questions
What is the IMF’s global growth forecast for 2027?
The IMF’s October 2026 World Economic Outlook projects 3.4% global GDP growth in 2027, following 3.1% in 2026. These are calendar-year forecasts and may be revised as new data becomes available. See the IMF October 2026 World Economic Outlook.
Is global inflation expected to fall in 2027?
Yes, the October IMF forecast projects global headline inflation easing from 4.7% in 2026 to 4.1% in 2027. That describes the world aggregate and does not imply that prices in Pakistan will fall in absolute terms.
Is Pakistan’s latest IMF financing already approved?
The 7 October 2026 IMF release announced staff-level agreement for the fourth EFF and third RSF reviews, subject to Executive Board approval. The release should not be described as a completed Board decision. See the IMF Pakistan October 7 staff-level agreement.
Will AI investment create jobs in Pakistan?
It could create demand for implementation, software services and specialist support, while also changing tasks in existing occupations. The result depends on skills, investment, electricity reliability and competitive access to customers. No credible source guarantees a particular employment gain.
Does the WTO predict rapid growth in all kinds of trade?
No. Its October outlook differentiates merchandise volume growth from commercial-services volume growth and notes uneven performance by sector and region. Read the WTO October 2026 executive summary.
What should Pakistani companies monitor through 2027?
Export order books, input costs, electricity reliability, financing terms, exchange-rate conditions and customer demand are more operationally useful than a single global growth figure. Businesses should compare these against their own cash flows and margins.
Conclusion: the decisive issue is transmission, not the headline
Global growth is not the same as broad prosperity. Pakistan’s outcomes will depend less on the global average than on the channels through which external demand, energy, financing, and technology influence local firms. The balance of risks is mixed: advanced technology can expand world production and trade, but it does not neutralize an energy shock or a financing squeeze. For Pakistan, policy credibility, internationally competitive exports and productivity-enhancing investment will determine how much of a fragile global expansion becomes better living standards at home.
Discover more from The Economy
Subscribe to get the latest posts sent to your email.

Russia Sanctions Waiver: What Asian Oil Buyers Gain

Asia Markets Weekly: How Oil, US Yields and the Fed Reach Tokyo, Kuala Lumpur and Karachi

Gold Near $4,000: Buy, Hold or Wait? A Pakistan Tola Price Guide

US 10-Year Treasury Yield Near 5%: The Hidden Cost for Pakistani Investors

Fed Meeting on October 28: Hike or Hold—and Why Pakistan Investors Should Care

Can Pakistan Turn US–Iran Mediation Into an Economic Dividend?

Oil Above $100: How Higher Crude Prices Reach Pakistan’s Rupee, Petrol and Imports

SBP Interest Rate at 11.5%: What Will Decide Pakistan’s Next Policy Move?

The Global South: Debt, Climate Finance and Investment in 2026

Energy Security Is the New Economic Security

Can Global Tourism Survive Geopolitical Shocks?

Global Maritime Hegemony: How China Secured Over 81% of All New Shipbuilding Orders

The Coming Battle Over AI, Jobs and Wages

Why Developing Economies Face a Sharper Inflation Problem

Crude Oil & Petroleum Market Analysis: OPEC+ Decisions and Price Forecasts

Silver Price Today: Why the Xi-Trump AI Standoff Is Fueling a Safe-Haven Rally

Algorithmic Dogfights: Why the U.S. and China Must Establish Rules of Engagement for Autonomous Air Power

Top US Convenience Store Chains: Store Counts, EV Charging, and Sales Trends

Who Is Shivon Zilis? The Neuralink Executive at the Center of the Musk–OpenAI Trial

Social Security Extra $90 Deposit: Who Qualifies for the October 2026 Medicare Rebate?

Global Economic Outlook 2026: 7 Forces Reshaping Markets, Trade and Business

Corporate America Faces a New Debt Test as US Borrowing Costs Surge

Gold Price Outlook 2026: The Forces Behind the Forecasts—and What Could Reverse Them

Gold Falls 3.7% as Yields Surge: Is Gold Still a Safe Haven in 2026?

Stock Market Today: Dow, S&P 500, and Nasdaq Retreat as Treasury Yields

Anthropic Bans Sustained Abuse of Claude AI Under New Usage Policy Effective November 12, 2026

MAS Allocates S$1.45 Billion to Five Asset Managers in Third EQDP Batch: Total Deployment Reaches S$5.4 Billion

US 10-Year Yield Hits 5.24%: What the Historic Bond Market Sell off Means for Mortgages and Investors
-

 Markets & Finance10 months ago
Top 15 Stocks for Investment in 2026 in PSX: Your Complete Guide to Pakistan’s Best Investment Opportunities
-

 Analysis8 months ago
Johor’s Investment Boom: The Hidden Costs Behind Malaysia’s Most Ambitious Economic Surge
-

 Analysis8 months ago
Top 10 Stocks for Investment in PSX for Quick Returns in 2026
-

 Banks9 months ago
Best Investments in Pakistan 2026: Top 10 Low-Price Shares and Long-Term Picks for the PSX
-

 Analysis9 months ago
Brazil’s Rare Earth Race: US, EU, and China Compete for Critical Minerals as Tensions Rise
-

 Investment10 months ago
Top 10 Mutual Fund Managers in Pakistan for Investment in 2026: A Comprehensive Guide for Optimal Returns
-

 Global Economy10 months ago
15 Most Lucrative Sectors for Investment in Pakistan: A 2025 Data-Driven Analysis
-

 Analysis8 months ago
Top 10 Countries with the World’s Strongest Currencies in 2026 — Ranked & Analysed