
Global Economy
Pakistan’s Export Goldmine: 10 Game-Changing Markets Where Pakistani Businesses Are Winning Big in 2025
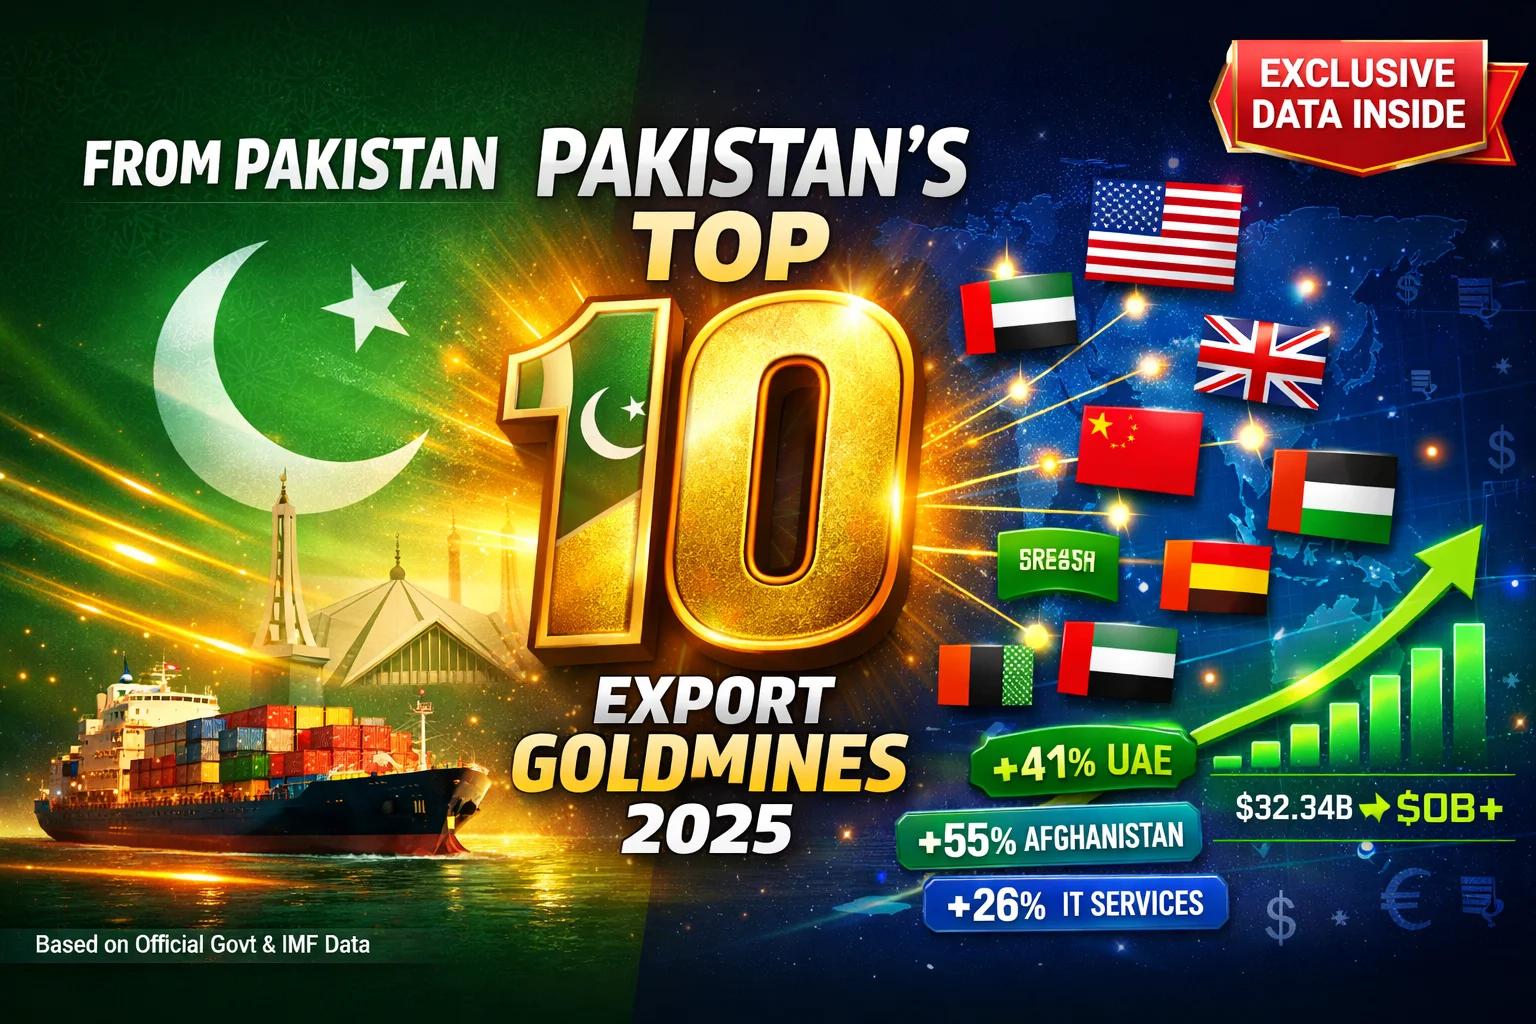
A data-driven roadmap to Pakistan’s most lucrative export destinations, backed by official trade statistics and strategic insights
When Karachi-based textile exporter Asim Raza signed his first €2 million contract with a German retailer in early 2024, he didn’t realize he was riding a wave that would define Pakistan’s economic transformation. His company’s exports to Germany grew by 33% that year—a microcosm of Pakistan’s surging global competitiveness in strategic markets.
Pakistan’s exports reached $32.34 billion in 2024, with goods and services exports climbing to $16.56 billion in the first half of fiscal year 2024-25—a robust 10.52% year-over-year increase. But here’s what the headlines miss: Pakistan isn’t just exporting more. It’s exporting smarter, targeting high-value markets with precision and diversifying beyond its traditional textile stronghold.
This analysis reveals the 10 most promising export destinations for Pakistani goods and services in 2025, backed by data from Pakistan’s State Bank, Bureau of Statistics, international trade databases, and insights from the IMF and World Bank. Whether you’re a seasoned exporter or an entrepreneur eyeing global markets, these destinations represent Pakistan’s best opportunities for sustainable, profitable growth.
Executive Summary: The $50 Billion Opportunity
Pakistan stands at an economic inflection point. The IT sector alone hit a record $4.6 billion in exports for FY 2024-25, marking 26.4% growth, while traditional textiles maintained their dominance despite global headwinds. The 10 markets analyzed here collectively account for over 67% of Pakistan’s total exports and represent combined annual trade potential exceeding $50 billion by 2027.
Key Findings:
- The United States remains Pakistan’s largest export market at $5.6 billion annually, offering unparalleled stability
- UAE trade surged to $10.9 billion in FY 2023-24, with Pakistani exports jumping 41% to $2.08 billion
- European Union markets absorbed $9.0 billion in Pakistani exports in 2024, representing 27.6% of total exports
- Saudi Arabia’s IT imports from Pakistan increased 48% to $47.09 million in FY24
- Emerging opportunities in GCC markets, driven by Vision 2030 initiatives
Methodology: How We Identified These Markets
This analysis combines quantitative trade data with qualitative assessments across five critical dimensions:
- Market Size & Growth Trajectory: Current export volumes and 3-year growth rates
- Trade Policy Environment: Tariff structures, free trade agreements, and preferential access
- Sector Diversification Potential: Opportunities beyond Pakistan’s core exports
- Payment Security & Stability: Currency strength, political risk, and ease of doing business
- Infrastructure & Logistics: Shipping costs, trade corridors, and connectivity
Data sources include Pakistan Bureau of Statistics, State Bank of Pakistan, IMF World Economic Outlook, World Bank Trade Statistics, UN COMTRADE, and official government portals including pc.gov.pk, finance.gov.pk, and invest.gov.pk.
1. United States: The $5.6 Billion Anchor Market
Why America Matters
The United States purchased $5.6 billion worth of Pakistani goods in 2024, representing 17.3% of Pakistan’s total exports. More remarkably, exports to the US reached $1.46 billion in Q1 FY 2024-25 alone, up 6.18% year-over-year, demonstrating resilient demand despite global economic uncertainty.
The US market offers Pakistani exporters something invaluable: predictability. With established payment mechanisms, minimal political risk, and strong rule of law, American buyers provide the stable cash flows that enable Pakistani businesses to scale.
What Pakistan Exports to America
Textiles dominate with bed linens, home textiles, and cotton apparel leading shipments. However, diversification is accelerating. Pakistani surgical instruments from Sialkot, basmati rice, leather goods, and an emerging wave of IT services are gaining traction.
IT services to the United States accounted for 54.5% of Pakistan’s total IT exports in FY 2023, signaling a critical shift toward high-value service exports. Pakistani software houses, freelance platforms, and tech startups are tapping into America’s insatiable demand for affordable, skilled digital talent.
Competitive Edge
Pakistan benefits from preferential treatment under various US trade programs and decades-old procurement relationships. American retailers seeking ethical, cost-effective sourcing alternatives to China increasingly view Pakistan as a strategic partner.
The US Generalized System of Preferences historically provided duty-free access for many Pakistani products, though its reinstatement remains under policy review. Regardless, Pakistan’s competitive pricing—often 15-20% below alternatives—ensures market access.
Entry Strategy
Start with established channels: Partner with US import-export houses that understand compliance requirements (FDA for food, CPSIA for consumer goods). Attend trade shows like NY Textile Week, the Magic Las Vegas fashion trade show, or specialty exhibitions in target sectors.
Focus on certifications: US buyers demand compliance. GOTS (Global Organic Textile Standard), WRAP (Worldwide Responsible Accredited Production), and ISO certifications open doors that pricing alone cannot.
For IT exporters: Leverage Pakistan Software Export Board (PSEB) resources, join Upwork Enterprise or Toptal platforms, and target mid-market US companies seeking dedicated offshore teams.
2. United Arab Emirates: The $10.9 Billion Gateway to Global Markets
Why UAE is Pakistan’s Strategic Hub
Bilateral trade between Pakistan and the UAE hit $10.9 billion in FY 2023-24, with goods trade at $8.41 billion and services at $2.56 billion. Pakistani exports surged by 41.06% to $2.08 billion, making UAE one of Pakistan’s fastest-growing export destinations.
But here’s the real story: UAE’s Pakistani expatriate community sent home $6.7 billion in remittances in 2024, expected to surpass $7 billion in 2025. This creates natural demand channels for Pakistani consumer goods while establishing financial corridors that reduce transaction costs for exporters.
What Thrives in UAE Markets
Food & Agriculture: Pakistani Basmati rice enjoys significant reputation in UAE markets, alongside mangoes, citrus fruits, and halal meat products. UAE’s reliance on food imports—the country imports over 90% of its food—creates perpetual demand.
Textiles & Home Goods: Pakistani fabrics, garments, and home textiles flow through Dubai’s re-export channels to Africa, Central Asia, and Europe.
IT Services: Pakistan aims to double IT exports to Saudi Arabia from $50 million to $100 million, with UAE serving as a regional IT hub connecting to broader GCC markets.
Construction Materials: Pakistan’s cement and marble industries supply UAE’s perpetual infrastructure boom.
Strategic Advantages
- Geographical proximity: Shipping costs 40-50% lower than to Europe or Americas
- Cultural affinity: 1.5 million Pakistani diaspora creates built-in market knowledge
- Re-export platform: UAE’s world-class logistics turn Dubai into a springboard for African and Central Asian markets
- Investment flows: Over $10 billion in Emirati investments in Pakistan over two decades facilitate two-way trade
Market Entry Tactics
Establish presence in Dubai’s Jebel Ali Free Zone or DAFZA (Dubai Aviation Free Zone) for tax advantages and simplified customs. Participate in major trade exhibitions like GULFOOD (food sector), INDEX (interior design/home textiles), and GITEX (technology).
Partner with established UAE trading houses that manage distribution across GCC markets. For smaller exporters, UAE’s growing e-commerce infrastructure (Noon, Amazon.ae) offers direct-to-consumer channels.
3. United Kingdom: The $2.1 Billion Legacy Market with Modern Potential
The UK Advantage
The UK absorbed $2.1 billion in Pakistani exports in 2024, making it the third-largest destination with 6.6% of total export share. More importantly, Q1 FY 2024-25 exports to UK grew to $562.75 million from $519.14 million year-over-year, demonstrating sustained momentum post-Brexit.
The UK represents more than just trade numbers—it’s Pakistan’s gateway to Commonwealth markets and English-speaking channels. A 1.6 million-strong British Pakistani community creates unmatched market intelligence and distribution networks.
What Britain Buys from Pakistan
Textiles reign supreme: Pakistani cotton, knitwear, and home textiles meet Britain’s insatiable fast-fashion and home goods demand. Major retailers like Marks & Spencer, Tesco, and ASDA source extensively from Pakistani manufacturers.
Food products: Basmati rice, halal meat, and spices cater to both ethnic markets and mainstream British consumers increasingly embracing diverse cuisines.
Leather goods: Pakistan’s leather jackets, bags, and footwear compete effectively on quality and price in UK’s mid-to-premium segments.
Post-Brexit Opportunities
Brexit created complexity but also opportunity. Pakistan and the UK are negotiating an enhanced trade agreement that could provide preferential access beyond the UK’s standard GSP arrangements. Pakistani exporters should position for these emerging frameworks.
The UK’s “Global Britain” strategy actively seeks non-EU trade partnerships, creating openings for Pakistani businesses willing to meet British standards (UKCA marking replacing CE, enhanced traceability).
Action Plan
Quality is non-negotiable: British consumers and regulators demand high standards. Invest in UK Accreditation Service (UKAS) recognized certifications.
Tap into ethnic channels: British Pakistani-owned wholesalers and retailers provide market entry points with lower barriers. Birmingham, Manchester, and London’s ethnic business districts are goldmines for first-time exporters.
Digital commerce: UK online shopping penetration exceeds 80%. Pakistani brands can sell directly via Amazon UK, eBay, or specialized platforms like Not On The High Street (artisan goods).
4. Germany: The $1.72 Billion European Manufacturing Powerhouse
Germany: Quality Meets Scale
Germany imported $1.72 billion worth of Pakistani goods in 2024, making it Pakistan’s fifth-largest export market and the most significant European Union destination. Germany accounts for 19.2% of Pakistan’s total EU exports, driven by industrial demand and consumer purchasing power.
German exports to Pakistan reached €400.1 million in H1 2024, while imports from Pakistan hit €1.19 billion, revealing a favorable trade balance for Pakistan and German appetite for Pakistani products.
What German Buyers Want
Technical textiles: Germany’s automotive and industrial sectors import Pakistani technical fabrics, nonwovens, and specialized textiles that meet rigorous specifications.
Home textiles & fashion: Textiles and garments comprise 85.4% of German imports from Pakistan, supplying retailers from discount chains (Aldi, Lidl) to premium brands.
Surgical instruments: Sialkot’s surgical instrument cluster exports precision tools to German medical suppliers, renowned for quality matching European standards.
Leather goods: Pakistani leather jackets, gloves, and accessories compete in Germany’s price-conscious yet quality-demanding market.
The GSP+ Advantage
Pakistan benefits from EU’s GSP+ status, providing duty-free or reduced tariffs on over 66% of product categories. Approximately 78.7% of EU imports from Pakistan utilize GSP+ preferential tariffs, creating substantial cost advantages over non-GSP+ competitors.
Germany views Pakistan favorably under GSP+, granting full tariff removal on most Pakistani exports, making it one of the most profitable European markets for Pakistani goods.
The “Made in Germany” Connection
Germany’s reputation for quality creates opportunities for Pakistani manufacturers willing to meet exacting standards. “Made in Germany” products enjoy strong reputation, and Pakistani suppliers providing components or finished goods to German brands can leverage this halo effect.
Breaking into Germany
Attend trade fairs: Germany hosts world-leading B2B exhibitions including Heimtextil (home textiles, Frankfurt), Texprocess (textile processing, Frankfurt), and MEDICA (medical equipment, Düsseldorf).
Partner with German Mittelstand: Germany’s medium-sized companies (Mittelstand) seek reliable, cost-effective suppliers. These family-owned firms value long-term relationships over transactional deals.
Emphasize sustainability: German buyers increasingly demand environmental certifications (GOTS, OEKO-TEX, FSC). Investment in green manufacturing pays dividends in German markets.
5. China: The $2.4 Billion Two-Way Opportunity
The Dragon’s Appetite
China imported $2.4 billion of Pakistani goods in 2024, representing 7.3% of total Pakistani exports. However, exports to China declined 10.54% in recent reporting periods, revealing a complex, evolving trade relationship that demands strategic navigation.
China represents Pakistan’s second-largest trading partner and the anchor of the China-Pakistan Economic Corridor (CPEC), but the relationship is asymmetric—Pakistan imports far more from China than it exports, creating persistent trade deficits.
What China Actually Buys
Agricultural products dominate: Chinese consumers prize Pakistani basmati rice, seafood (especially shrimp and fish), and increasingly, premium fruits like mangoes and kinnows (citrus).
Raw materials: Cotton, copper, and minerals flow from Pakistan to feed China’s manufacturing machine.
Textiles (surprisingly): While China produces textiles globally, it imports specialty Pakistani fabrics, particularly high-quality cotton yarns and home textiles that Chinese manufacturers re-export as finished products.
The CPEC Multiplier Effect
CPEC infrastructure—Gwadar Port, transportation corridors, Special Economic Zones—theoretically positions Pakistan as China’s gateway to Middle Eastern and African markets. The promise: Pakistani manufacturers using Chinese investment to produce goods for re-export through improved logistics networks.
Reality check: This vision remains partially unfulfilled, but opportunities are materializing. Pakistani businesses should focus on becoming component suppliers in Chinese value chains rather than competing head-to-head with Chinese manufacturers.
Strategic Positioning
Target Chinese consumers directly: Pakistan’s premium food products (organic rice, Himalayan salt, mangoes) appeal to China’s rising middle class seeking healthy, exotic imports. Exports to China totaled $559 million in Q1 FY 2024-25, suggesting continued relevance despite year-over-year declines.
E-commerce platforms: Alibaba’s Tmall Global, JD Worldwide, and cross-border e-commerce platforms allow Pakistani brands to reach Chinese consumers without traditional import channels.
Focus on differentiation: Pakistan cannot compete with China on price for manufactured goods. Instead, emphasize authenticity (premium basmati), sustainability (organic products), and quality craftsmanship (surgical instruments, leather goods).
Entry Tactics
Attend Canton Fair (Guangzhou) for market research and relationship building. Partner with Chinese import-export houses that understand Chinese regulatory requirements (CIQ certifications, customs processes).
For agricultural products, engage provincial commodity trading companies that specialize in food imports. Provinces like Guangdong and Shanghai offer largest consumer markets.
6. Saudi Arabia: The $734 Million Vision 2030 Springboard
The Kingdom’s Transformation
Pakistan’s exports to Saudi Arabia stood at approximately $734 million in 2024, but this understates the opportunity. Saudi Arabia’s Vision 2030 economic diversification plan is creating unprecedented demand across sectors where Pakistan holds competitive advantages.
Pakistan’s total exports to Saudi Arabia recorded $710.29 million for FY 2024, up from $503.85 million in FY 2023, representing 41% growth—one of Pakistan’s fastest-growing major markets.
Most exciting: Pakistan’s IT exports to Saudi Arabia registered 48% growth in FY24, increasing from $31.67 million to $47.09 million, with projections to double to $100 million soon.
What Saudi Arabia Needs
Food security: The Kingdom imports 80%+ of its food. Pakistani exports include rice ($107 million), bovine meat ($44.5 million), and spices ($29.5 million), with room for massive expansion as Saudi food consumption grows 4-5% annually.
IT Services & Digital Transformation: Saudi Arabia allocated $100 billion for AI and digital infrastructure projects. Pakistani IT companies participated in LEAP 2025 with 1,000+ delegates, securing business deals and MoUs.
Construction Materials: Pakistani cement, gypsum, and limestone support Saudi Arabia’s infrastructure boom, with NEOM, Red Sea Project, and Qiddiya entertainment city creating sustained demand.
Textiles & Garments: Saudi’s retail sector expansion and growing youth population (65% under 35) drive apparel demand.
The Remittance-Export Nexus
Pakistan sent 1.88 million workers to Saudi Arabia between 2020-2024, up 21% from previous period. Remittances from Saudi Arabia rose from $7.39 billion in 2020 to $8.59 billion in 2024.
This massive Pakistani workforce creates:
- Natural demand channels for Pakistani consumer goods
- Business intelligence networks
- Distribution partnerships
- Cultural bridges facilitating trade
Vision 2030 Opportunities
Saudi Arabia’s diversification away from oil creates niches:
- Tourism infrastructure: Pakistan’s marble, furniture, and hospitality suppliers can participate
- Education & training: Pakistani IT professionals, engineers, and educators meet Saudi talent needs
- Healthcare services: Pakistan’s medical professionals and pharmaceutical exports align with Saudi healthcare expansion
- Entertainment & sports goods: Sialkot’s sports manufacturing expertise meets Saudi’s sports sector investments
Breaking into Saudi Markets
Leverage official channels: Pakistan-Saudi Joint Business Council and Special Investment Facilitation Council (SIFC) provide government-backed market access support.
Target Vision 2030 projects: Research specific mega-projects (NEOM, Red Sea, Qiddiya) and identify procurement opportunities. Many projects mandate local content but accept GCC+1 (including Pakistan) suppliers.
Establish Saudi presence: Free zones in Jeddah, Riyadh, and Dammam offer tax incentives. Saudi’s Ministry of Investment created a help desk for Pakistani companies, streamlining registration for 100+ Pakistani tech firms.
7. Netherlands: The $1.6 Billion European Gateway
Why the Dutch Market Matters
The Netherlands imported $1.6 billion worth of Pakistani goods in 2024, representing 4.9% of total exports. But Netherlands’ significance extends beyond direct consumption—Rotterdam serves as Europe’s primary gateway, redistributing Pakistani goods across the continent.
Exports to Netherlands totaled $1.001 billion in recent reporting periods, with steady growth driven by Dutch demand for textiles, food products, and re-export logistics.
What Dutch Buyers Seek
Home textiles & fashion: Dutch retailers source Pakistani bed linens, curtains, and cotton apparel for domestic sales and pan-European distribution.
Food products: Netherlands’ position as Europe’s food distribution hub creates demand for Pakistani rice, spices, and specialty foods that Dutch importers redistribute across EU markets.
Cut flowers complement: While Netherlands dominates floriculture, Pakistani dried flowers, craft items, and complementary products find niche markets.
The Rotterdam Effect
Rotterdam’s port handles 14 million containers annually. Pakistani exporters shipping to Rotterdam gain access to European inland waterways, rail networks, and road corridors that reduce distribution costs by 20-30% versus direct shipping to smaller European ports.
Dutch logistics companies (DHL, Kuehne+Nagel branches) specialize in breaking bulk shipments and handling customs for pan-European distribution—a service particularly valuable for mid-sized Pakistani exporters.
Strategic Approach
Focus on consolidation: Netherlands rewards exporters who can deliver consistent, large-volume shipments suitable for European redistribution. Partner with multiple Pakistani manufacturers to offer consolidated product ranges.
Sustainability sells: Dutch consumers rank among Europe’s most environmentally conscious. Products with credible green certifications (FSC, Fairtrade, organic) command premium prices.
Use Dutch as EU testing ground: Launch new products through Dutch importers to test European market reception before broader EU expansion.
Market Entry
Attend Rotterdam Fashion Week (apparel), Hotelympia (hospitality textiles), or sector-specific trade shows. Many Dutch importers prefer working through agents—consider partnering with established Pakistan-Netherlands trade facilitators based in Amsterdam or Rotterdam.
8. Spain: The $1.47 Billion Southern European Opportunity
Spain’s Growing Appetite
Spain imported $1.47 billion of Pakistani goods in 2024, accounting for 4.5% of total exports. More impressively, exports to southern Europe (primarily Spain and Italy) rose 12.19% to $1.159 billion, making it one of Pakistan’s fastest-growing European markets.
Spain offers distinct advantages: lower competition versus northern Europe, growing consumer spending as economy recovers, and strategic position for accessing Iberian and Latin American markets.
What Spain Imports
Textiles dominate: Spanish fast-fashion brands (Zara’s parent Inditex, Mango) and home goods retailers (El Corte Inglés) source Pakistani cotton apparel, home textiles, and accessories.
Leather goods: Spain’s leather goods sector values Pakistani leather jackets, bags, and footwear that complement Spanish design aesthetics.
Rice & food: Spain’s immigrant population and multicultural consumer base create demand for basmati rice, spices, and halal products.
Surgical instruments: Spanish medical suppliers import Pakistani precision instruments for hospitals and clinics.
Competitive Positioning
Spain’s purchasing power sits between premium northern European markets and price-sensitive eastern Europe, creating a “Goldilocks zone” where Pakistani exporters can offer quality products at competitive prices without racing to the bottom.
Spanish buyers increasingly seek “nearshoring” alternatives to Asian suppliers due to supply chain disruptions. Pakistan’s GSP+ access, direct shipping routes, and reliable production capacity make it attractive versus uncertain Chinese supplies.
Cultural Connections
Spain’s historical ties with Islamic heritage (Al-Andalus era) create unexpected cultural affinity. Marketing Pakistani products emphasizing craftsmanship, traditional techniques, and cultural heritage resonates with Spanish consumers valuing authenticity.
Entry Strategy
Barcelona and Madrid focus: These metropolitan hubs account for 60%+ of Spanish imports. Establish relationships with importers and trading houses in these cities.
Attend trade fairs: Feria Internacional de la Moda (Barcelona fashion), Textilhogar (home textiles, Valencia), Alimentaria (food & beverage, Barcelona).
Leverage language: Spanish-speaking Pakistani business professionals are rare—invest in Spanish-language capability or partner with bilingual agents to build stronger relationships.
Target fashion brands directly: Many Spanish fashion brands seek suppliers willing to handle smaller, flexible orders versus Chinese factories demanding minimum quantities. This creates opportunities for medium-sized Pakistani manufacturers.
9. Afghanistan: The $1.51 Billion Overlooked Neighbor
The Afghanistan Paradox
Afghanistan imported $1.51 billion from Pakistan in 2024, representing 4.7% of exports. Remarkably, exports to Afghanistan surged 55.2% year-over-year, making it one of Pakistan’s fastest-growing markets despite security challenges.
Afghanistan represents Pakistan’s most geographically proximate major market, with negligible shipping costs, cultural affinity, and complementary economic structures that create natural trade flows.
What Afghanistan Needs
Everything: As a landlocked, conflict-affected economy, Afghanistan depends heavily on Pakistani imports across categories:
Food products: Wheat flour, edible oils, sugar, tea, and processed foods dominate trade. Afghanistan’s limited agricultural processing capacity creates perpetual demand.
Construction materials: Cement, steel, paint, and building materials supply Afghanistan’s reconstruction and housing needs.
Textiles: Fabric, ready-made garments, and home textiles meet domestic consumption and re-export to Central Asian markets.
Pharmaceuticals: Pakistani medicines provide affordable healthcare solutions for Afghan population.
Consumer goods: Household items, electronics, appliances—most imported from China through Pakistan—flow across the border.
Strategic Considerations
Payment risks require management: Afghan currency instability and banking limitations create payment challenges. Many transactions occur through informal hawala networks or third-country banks. Experienced Afghan trade partners and secured payment mechanisms are essential.
Use Pakistan’s transit advantage: Pakistan serves as Afghanistan’s primary trade corridor to global markets. Pakistani exporters can position as logistics hubs, consolidating Afghanistan-bound goods from global suppliers.
Transit trade restrictions: Pakistan and Afghanistan have complex transit trade agreements. Understanding bilateral arrangements prevents customs headaches.
Beyond Afghanistan: Central Asia Gateway
Afghanistan’s strategic location makes it a potential gateway to Central Asian markets (Uzbekistan, Tajikistan, Turkmenistan) worth exploring. Pakistani goods transiting through Afghanistan can reach these markets, though infrastructure and regulatory challenges require careful navigation.
Risk-Adjusted Approach
Start with established channels: Work with experienced Afghan importers who’ve navigated cross-border trade for years. Afghan trader communities in Peshawar and Quetta facilitate connections.
Demand security: Insist on advance payments or confirmed letters of credit for large transactions. Afghan market’s growth potential justifies caution, not paralysis.
Explore border markets: Cities like Torkham (Khyber Pakhtunkhwa-Nangarhar border) and Chaman (Balochistan-Kandahar border) host formal and informal trading hubs where relationships form naturally.
10. Italy: The $1.1 Billion Fashion & Design Capital
Italian Sophistication Meets Pakistani Craftsmanship
Italy imported $1.1 billion of Pakistani goods in 2024, representing 3.5% of exports. While exports to Italy stood at $747 million in recent periods, Italy’s fashion-forward markets and design-conscious consumers create unique opportunities for Pakistani exporters emphasizing quality and aesthetics.
Italy represents more than a market—it’s a branding platform. Products accepted by Italian buyers gain credibility that opens doors across Europe and globally.
What Italians Value
Premium textiles: Italian fashion houses (Armani, Versace, Prada) and mid-tier brands source high-quality Pakistani cotton fabrics, linens, and specialty textiles that meet exacting standards.
Home textiles: Italian interior design stores import Pakistani bed linens, towels, and decorative textiles appealing to design-conscious consumers.
Leather goods: Italy’s leather heritage creates demand for quality Pakistani leather hides and semi-finished leather products used in Italian manufacturing.
Rice: Italy’s risotto culture creates demand for specialty rice varieties, including Pakistani basmati for fusion cuisine.

The Quality Premium
Italian buyers pay premium prices for products meeting their quality expectations. This creates opportunities for Pakistani exporters willing to invest in:
- Superior raw materials (long-staple cotton, premium leather)
- Advanced manufacturing (Italian-standard finishing, precision)
- Design collaboration (working with Italian designers to create products specifically for Italian tastes)
Competitive Dynamics
Italy faces pricing pressure from low-cost Asian suppliers but refuses to compromise on quality. Pakistani exporters occupying the “high-quality, moderate-price” position can capture market share from both expensive European suppliers and lower-quality Asian competitors.
Fashion Industry Integration
Some Pakistani manufacturers have successfully integrated into Italian fashion supply chains, producing specific components (embroidered fabrics, specialty trims, leather goods) that Italian brands incorporate into finished products.
This “hidden supplier” model allows Pakistani businesses to earn higher margins than commodity textile exports while building capabilities that later enable branded product launches.
Market Penetration
Milano Unica (textile trade fair, Milan) and Pitti Immagine (fashion trade fair, Florence) are essential networking venues. Italian buyers value personal relationships—invest time in building trust through repeated visits and consistent communication.
Focus on Emilia-Romagna and Lombardy: These regions host Italy’s textile and fashion manufacturing hubs, creating density of potential buyers and partners.
Consider design partnerships: Collaborate with Italian designers who can position Pakistani craftsmanship within contemporary design contexts. Italian design + Pakistani production = competitive advantage.
Comparative Analysis: Choosing Your Target Markets
The table below compares these 10 destinations across key decision factors:
| Destination | Market Size (2024) | Growth Rate | Entry Difficulty | Payment Security | Best For |
|---|---|---|---|---|---|
| United States | $5.6B | Moderate (6-8%) | Medium | Highest | Large-scale textile, IT services, established exporters |
| UAE | $2.08B (goods) | Very High (41%) | Low | High | Food, logistics hub, regional gateway |
| UK | $2.1B | Moderate (8%) | Medium | High | Textiles, ethnic markets, Commonwealth access |
| Germany | $1.72B | Moderate-High (15%) | High | Very High | Quality textiles, surgical instruments, technical goods |
| China | $2.4B | Declining (-10%) | Very High | Medium | Agricultural products, raw materials |
| Saudi Arabia | $734M | Very High (41%) | Medium | High | Food, IT services, Vision 2030 opportunities |
| Netherlands | $1.6B | Moderate (10%) | Medium | Very High | European logistics hub, sustainability-focused |
| Spain | $1.47B | High (12-15%) | Low-Medium | High | Fashion, home textiles, growing consumer market |
| Afghanistan | $1.51B | Very High (55%) | Low | Low | Construction, food, consumer goods, high risk/reward |
| Italy | $1.1B | Low-Moderate (3-5%) | High | High | Premium textiles, design collaboration, quality-focused |
Risk-Return Framework
Highest Growth Potential: Afghanistan (55% YoY), UAE (41% YoY), Saudi Arabia (41% YoY)
Safest Markets: United States, Germany, Netherlands (stable institutions, reliable payments)
Easiest Entry: UAE, Spain, Afghanistan (lower regulatory complexity)
Premium Pricing Opportunities: Germany, Italy, UK (quality-conscious consumers)
Volume Leaders: United States, China, UAE (largest absolute market sizes)
Emerging Opportunities: Saudi Arabia IT services, UAE food sector, Spain fashion
Strategic Recommendations: Building Pakistan’s Export Future
For Pakistani Policymakers
1. Sector-Specific Strategies
Pakistan cannot be all things to all markets. Government support should focus on:
- Textiles: Maintain competitiveness through GSP+ preservation, technology upgrades, and sustainability certifications
- IT Services: Accelerate PSEB initiatives, expand Special Technology Zones, ensure internet reliability
- Agriculture: Invest in cold chain logistics, phytosanitary certifications, and food safety standards to unlock Gulf and European markets
- Surgical Instruments: Support Sialkot cluster with advanced manufacturing training and ISO certifications
- Pharmaceuticals: Fast-track WHO GMP compliance to access premium markets
2. Infrastructure Priorities
The $32.34 billion export target demands infrastructure investments:
- Port modernization: Karachi and Gwadar ports need automation and efficiency upgrades to reduce dwell times
- Air cargo expansion: IT services and high-value goods need reliable, affordable air freight
- Digital connectivity: Stable internet infrastructure is now as critical as roads for service exporters
3. Trade Agreements
Negotiate trade deals strategically:
- Pakistan-UK Enhanced Partnership: Capitalize on post-Brexit UK’s appetite for new partners
- Deepened Saudi Relations: Convert political goodwill into concrete trade frameworks
- EU GSP+ Renewal: Begin preparation NOW for 2027 renewal—losing GSP+ would devastate European exports
For Pakistani Business Leaders
1. Diversification Imperative
Over-reliance on traditional markets creates vulnerability. Smart exporters should:
- Allocate 20-30% of export development budgets to emerging markets (Saudi Arabia, Spain, UAE growth sectors)
- Test products in 2-3 new markets annually before committing resources
- Build geographic diversification into business plans, not as afterthought
2. Quality Over Volume
Competing on price alone is a race to the bottom. Premium markets (Germany, Italy, UK) pay 15-40% more for certified, high-quality products. Investments in:
- International certifications (GOTS, OEKO-TEX, ISO 9001)
- Advanced manufacturing equipment
- Skilled workforce training
- Design and innovation capabilities
…pay off through higher margins and customer loyalty.
3. Digital Transformation
Post-COVID buyers expect digital capabilities:
- Professional English-language websites with e-commerce functionality
- Digital product catalogs with specifications and certifications
- Video demonstrations and virtual factory tours
- Social media presence (LinkedIn for B2B, Instagram for consumer goods)
Pakistan’s IT export success ($4.6B in FY24) proves Pakistani businesses can compete digitally. Manufacturing exporters must follow suit.
4. Leverage Government Resources
Pakistani exporters under-utilize available support:
- Trade Development Authority of Pakistan (TDAP): Provides market research, trade mission participation, exhibition support
- Export Development Fund: Offers financial support for market development
- Pakistan Software Export Board: Helps IT exporters with international marketing
- Board of Investment: Facilitates connections with foreign buyers and investors
For Entrepreneurs & New Exporters
1. Start Small, Think Big
You don’t need $1 million to export. Start with:
- E-commerce platforms: Amazon Global, Alibaba, Etsy (for crafts), Fiverr/Upwork (for services)
- Trade agents: Partner with established export houses that handle logistics and payments
- Government programs: TDAP and SMEDA offer new exporter training and support
2. Pick Your Market Wisely
New exporters should target:
- UAE: Easiest entry (low barriers, Pakistani diaspora, cultural affinity)
- Afghanistan: Lowest logistics costs, simple requirements (with risk management)
- Spain: Growing market, moderate competition, accessible buyers
Avoid starting with highly complex markets (China, Germany, USA) unless you have experienced partners.
3. Protect Yourself
Export payment fraud is real. Always:
- Use confirmed letters of credit for unknown buyers
- Verify buyer credentials through Pakistani embassies/trade missions
- Start with small trial orders before committing to large contracts
- Consider export credit insurance through State Bank programs
The $50 Billion Vision: Pakistan’s Export Trajectory 2025-2027
Pakistan’s export potential extends far beyond current $32.34 billion. These 10 markets collectively represent over $50 billion in addressable opportunities by 2027 if Pakistan executes strategically.
Realistic Growth Scenarios
Conservative Scenario (7-8% annual growth):
- 2025: $34.5 billion
- 2026: $37.2 billion
- 2027: $40.1 billion
Moderate Scenario (12-15% annual growth):
- 2025: $36.2 billion
- 2026: $41.5 billion
- 2027: $47.7 billion
Aggressive Scenario (20%+ annual growth):
- 2025: $38.8 billion
- 2026: $46.6 billion
- 2027: $55.9 billion
The aggressive scenario requires:
- Political stability and policy consistency
- Infrastructure investments (ports, digital, roads)
- Sustained GSP+ access to Europe
- Major breakthrough in IT services exports to Saudi Arabia and Gulf markets
- Agricultural export expansion through improved cold chain logistics
Key Performance Indicators to Watch
Track these metrics quarterly to assess progress:
- Geographic Diversification Index: Are top 5 markets becoming less dominant?
- High-Value Export Share: Is IT services/pharmaceuticals/surgical instruments growing faster than textiles?
- GSP+ Utilization Rate: Are exporters maximizing tariff preferences (currently 78.7%)?
- Payment Default Rate: Improving payment security indicates market maturity
- New Market Penetration: Number of first-time export destinations annually
Frequently Asked Questions (FAQ)
1. Which Pakistani products have the highest export growth potential globally?
IT services lead growth trajectories with 26.4% annual increases, reaching $4.6 billion in FY 2024-25. Surgical instruments from Sialkot, pharmaceutical products meeting international standards, and premium food products (organic basmati rice, mangoes) show exceptional potential. Traditional textile exports remain vital but require value addition through sustainability certifications and technical textiles to maintain competitiveness.
2. How can small and medium Pakistani businesses start exporting?
Begin with UAE markets leveraging Pakistani diaspora networks and cultural familiarity. Utilize Pakistan Software Export Board (PSEB) resources for IT services or Trade Development Authority of Pakistan (TDAP) programs for goods. Start through e-commerce platforms like Amazon Global or Alibaba before establishing direct relationships. Consider partnering with established export houses that handle logistics, payments, and regulatory compliance while you focus on production.
3. What certifications do Pakistani exporters need for European markets?
European buyers require GSP+ tariff utilization documentation plus sector-specific certifications: GOTS (Global Organic Textile Standard) or OEKO-TEX for textiles, ISO 9001 for quality management, ISO 14001 for environmental management, and CE marking for applicable products. Food exporters need HACCP certification and EU phytosanitary compliance. These investments typically return 15-40% price premiums in German, UK, and Italian markets.
4. Is exporting to Afghanistan safe and profitable for Pakistani businesses?
Afghanistan offers exceptional growth (55% year-over-year increase to $1.51 billion) with minimal shipping costs and cultural advantages. However, payment risks require mitigation through advance payments, confirmed letters of credit, or working with established Afghan trading partners. Construction materials, food products, and consumer goods see sustained demand. Risk-adjusted returns can exceed safer markets for businesses implementing proper payment security measures.
5. How is Pakistan’s IT services sector competing globally?
Pakistan’s IT sector achieved $4.6 billion exports in FY 2024-25 with 26.4% growth, positioning Pakistan as a competitive outsourcing destination. Key competitive advantages include: English proficiency, 8-hour time zone overlap with Europe, 30-40% cost savings versus Western markets, and growing technical talent pool. United States absorbs 54.5% of Pakistani IT exports, while Saudi Arabia’s IT imports from Pakistan surged 48% year-over-year. Focus areas include software development, cybersecurity services, and business process outsourcing.
6. What trade agreements benefit Pakistani exporters most?
EU’s Generalized System of Preferences Plus (GSP+) provides the largest benefit, granting duty-free or reduced tariffs on 66% of product categories to European markets. Approximately 78.7% of EU imports from Pakistan utilize GSP+ preferences, making it essential for competitiveness. Pakistan also benefits from preferential arrangements with SAARC countries, FTA with Mauritius, and is negotiating enhanced partnerships with UK post-Brexit. Maintaining GSP+ eligibility through labor and environmental compliance is critical for export competitiveness.
7. How can Pakistani textile exporters differentiate from Chinese and Bangladeshi competition?
Emphasize quality over price competition through long-staple Egyptian cotton blends, sustainability certifications (GOTS, OEKO-TEX), and ethical labor practices. Target premium market segments in Germany, Italy, and UK where buyers pay 20-30% premiums for certified sustainable products. Develop technical textiles for automotive and industrial applications where precision matters more than cost. Partner with European designers to create unique value propositions that Chinese mass production cannot replicate.
Conclusion: Pakistan’s Export Awakening
Standing at the crossroads of 2025, Pakistan possesses something rare in emerging economies: genuine competitive advantages across multiple sectors, from centuries-old textile craftsmanship to cutting-edge IT capabilities. The 10 markets analyzed here—representing United States’ stability, UAE’s strategic gateway positioning, European quality premiums, Gulf development opportunities, and regional trade dynamics—collectively offer Pakistani businesses a roadmap to export-led prosperity.
The data tells a compelling story: $32.34 billion in current exports, IT services surging 26.4% annually, UAE trade jumping 41%, and Saudi Arabia emerging as a transformational opportunity. But numbers alone don’t create success. Execution does.
Pakistani exporters who invest in quality, embrace certifications, build digital capabilities, and strategically diversify markets will capture disproportionate gains. Those who remain commodity-focused and single-market dependent will struggle.
For government and business leaders alike, the imperative is clear: Pakistan’s export potential isn’t constrained by global demand—it’s constrained by infrastructure, policy consistency, and willingness to compete on quality rather than merely price. The $50 billion export economy Pakistan needs by 2027 isn’t aspirational fiction. It’s achievable reality for a nation willing to execute strategically.
The world is buying. The question is: Is Pakistan ready to sell?
Sources & Data Attribution
This article incorporates data from:
- State Bank of Pakistan Trade Statistics
- Pakistan Bureau of Statistics Export Data
- Ministry of Commerce Official Publications (pc.gov.pk)
- Ministry of Finance Economic Surveys (finance.gov.pk)
- Board of Investment Pakistan (invest.gov.pk)
- IMF World Economic Outlook Database
- World Bank World Integrated Trade Solution (WITS)
- Asian Development Bank Economic Indicators
- UN COMTRADE International Trade Statistics
- Trade Development Authority of Pakistan Reports
- Pakistan Software Export Board Industry Data
All statistics represent most recent available data as of December 2024 / January 2025 reporting periods.
Discover more from The Economy
Subscribe to get the latest posts sent to your email.


How once-unimaginable catastrophes become baseline assumptions
There is a particular kind of hubris that infects markets in the long stretches between catastrophes. Volatility compresses. Risk premia decay. The insurance gets quietly cancelled because it hasn’t paid out in years and the premiums feel like wasted money. Then the disaster arrives — not as a distant rumble but as a wall of water — and the entire analytical framework investors have spent years constructing turns out to have been a map of the wrong country.
We are living through one of the most instruction-rich moments in modern financial history. Since February 28, 2026, when the United States launched military operations against Iran and Tehran responded by closing the Strait of Hormuz, markets have been running a live masterclass in catastrophe pricing. West Texas Intermediate crude surged from $67 to $111 per barrel in under a fortnight — the fastest oil spike in four decades. War-risk insurance premiums on shipping through the Gulf soared more than 1,000 percent. The S&P 500 lost 5 percent in a single week, and the ECB and Bank of England are now staring down a renewed tightening scenario they spent the first quarter of 2026 insisting was off the table.
And yet — and this is the part that should make every portfolio manager uncomfortable — the analytical mistakes driving losses right now are not new. They are the same six structural errors investors have made in every previous crisis. Understanding them, really understanding them, is not an academic exercise. It is the difference between surviving the next disaster and being liquidated by it.
Key Takeaways at a Glance
- Markets price first-order disaster impacts; second- and third-order cascades are systematically underpriced
- Volatility is information; price-discovery failure is the true systemic risk — monitor private-to-public valuation spreads
- Tight CAT bond spreads signal capital crowding, not benign risk — use compression as a contrarian indicator
- Emerging market currencies and credit spreads lead developed-market pricing of global disasters
- Geopolitical risk premia decay faster than structural damage — separate the transitory from the permanent
- The best time to buy tail protection is when every indicator says you do not need it
Lesson One: Markets price the disaster they know, not the one that is compounding behind it
The economics of disaster pricing contain a fundamental asymmetry. Markets are reasonably good at incorporating a known risk — geopolitical tension, elevated VIX, stretched valuations — into current prices. What they catastrophically underprice is the second-order cascade that no single model captures.
Consider what the Hormuz closure actually detonated. Yes, oil went to $111 per barrel. Obvious. What was less obvious: the inflation feedback loop that forced investors to reprice central bank paths they had already discounted as settled. The Federal Reserve was expected to hold rates in 2026; futures now assign a 74 percent probability it does not cut at all this year. Europe’s energy import dependency made the ECB’s position worse. That transmission — from oil shock to rate-repricing to credit stress to equity multiple compression — is a chain, not a point event. Most risk models price the first link.
The academic framework for this is well established but rarely operationalised. The NBER disaster-risk literature, particularly Wachter (2013) and Barro (2006), argues that rare disasters produce risk premia that appear irrational in calm periods but are in fact the rational price of tail exposure across long time horizons. What these models miss, however, is that real-world disasters rarely arrive as clean, isolated point events. They arrive as cascades. The COVID-19 pandemic was not just a health shock — it was simultaneously a supply-chain shock, a demand shock, a sovereign-debt shock, and a labour-market restructuring shock. The Hormuz closure is not just an oil shock. It is an inflation shock, a monetary policy shock, a EM balance-of-payments shock, and an AI-investment sentiment shock, all at once.
Key takeaway: Map not just the primary disaster scenario but every second- and third-order transmission mechanism it activates. The primary impact is already partially in the price. The cascades are not.
Lesson Two: The real crisis is not volatility — it is the collapse of price discovery
Scott Bessent, the US Treasury Secretary, said something in March 2026 that deserves to be read not as politics but as a precise financial concept. Asked what genuinely frightened him after 35 years in markets, Bessent answered: “Markets go up and down. What’s important is that they are continuous and functioning. When people panic is when you’re not able to have price discovery — when markets close, when there is the threat of gating.”
Volatility is information. A price moving sharply up or down is a market doing exactly what it should: integrating new signals, adjusting expectations, clearing. The true systemic catastrophe is not a 10 percent drawdown. It is the moment when buyers and sellers can no longer find each other at any price — when the mechanism that produces prices breaks entirely.
This is not theoretical. Private credit markets are currently exhibiting exactly this dynamic. US BDCs — business development companies that provide credit to mid-market companies — have seen share prices fall 10 percent and trade 20 percent or more below their latest stated NAVs. Alternative asset managers that collect fees from these vehicles are down more than 30 percent. The public market is rendering a verdict on private valuations that the private market itself cannot yet deliver, because the private marks have not moved. There is no continuous clearing mechanism. There is no daily price discovery. There is only the last funding round — which is a negotiated fiction, not a price.
Investors who understand this distinction can do something useful with it: treat the spread between public-market pricing and private-market marks as a real-time fear gauge. When that gap widens sharply, the market is not panicking irrationally. It is pricing the absence of price discovery itself.
Key takeaway: Distinguish between volatility (information-rich, manageable) and price-discovery failure (structurally dangerous, contagion-prone). Monitor private-to-public valuation spreads as a leading indicator of the latter.
Lesson Three: Catastrophe bond complacency is always a warning, never a reassurance
In February 2026, Bloomberg reported that catastrophe-bond risk premia had fallen to levels not seen since before Hurricane Ian struck Florida in 2022. The cause was a surge of fresh capital chasing ILS yields. Managers called it a healthy market. A more honest reading is that it was a market pricing the wrong risk for the wrong reasons.
Here is the structural problem with catastrophe bonds, and indeed with most insurance-linked securities: the risk premium is set by the supply of capital chasing the trade, not by the true probability distribution of the underlying disaster. When capital floods in — as it has, driven by institutional allocators seeking uncorrelated returns — spreads compress regardless of whether the actual hurricane, flood, or geopolitical catastrophe risk has changed. The academic literature on CAT bond pricing, including recent work in the Journal of the Operational Research Society, confirms that cyclical capital flows consistently distort the risk-neutral pricing of catastrophe events.
The counter-intuitive lesson: when CAT bond spreads are tightest, protection is cheapest to buy and most expensive to have sold. The compression that looks like market efficiency is often capital crowding masquerading as a risk assessment. A catastrophe-bond market trading at pre-Ian yields six months before an Iran-driven energy crisis was not a serene market. It was a complacent one.
Key takeaway: Use catastrophe-bond spread compression not as a signal of benign risk conditions but as a contrarian indicator of under-priced tail exposure. Buy protection when it is cheap; do not sell it because it is cheap.
Lesson Four: Emerging markets absorb the shock first — and price it most honestly
There is a geographic hierarchy to disaster pricing that sophisticated global investors routinely ignore. When a major geopolitical or macro catastrophe detonates, the signal appears first in emerging market currencies, credit spreads, and energy import bills — not in the S&P 500 or the Dax. This is not because EM markets are more efficient. It is because they have less capacity to absorb shocks and therefore less incentive to pretend the shock is temporary.
The Hormuz closure is a case study. Developed-market investors spent the first week debating whether oil at $111 per barrel was “priced in.” Meanwhile, Gulf states were issuing precautionary production-cut announcements and Middle Eastern shipping had effectively ceased. Economies in South and Southeast Asia — which import 80 percent or more of their petroleum needs — faced simultaneous currency pressure (oil is dollar-denominated), fiscal pressure (fuel subsidies explode), and inflation pressure (food and transport costs surge). Countries like Pakistan, Sri Lanka, and Bangladesh were pricing a recession before most DM economists had updated their Q1 2026 forecasts.
The BIS research on disaster-risk transmission across 42 countries documents precisely this dynamic: world and country-specific disaster probabilities co-move in complex, non-linear ways. When global disaster probability rises, EM asset prices move first and fastest. For a DM investor, this is an early-warning system hiding in plain sight.
Key takeaway: Monitor EM currency indices, sovereign credit spreads, and fuel import data as leading indicators of how the global market is actually pricing a disaster — before the consensus in New York or London has caught up.
Lesson Five: Geopolitical risk premia have a half-life problem — and it is shorter than you think
Markets are extraordinarily good at normalising the catastrophic. This is not a character flaw; it is a survival mechanism. But for investors, the normalisation of extreme risk is one of the most financially treacherous dynamics in markets.
Consider the structural pattern Tyler Muir documented in his landmark paper Financial Crises and Risk Premia: equity risk premia collapse by roughly 20 percent at the onset of a financial crisis, then recover by around 20 percent over the following three years — even when the underlying structural damage persists. Wars display an even more dramatic version of this pattern. The initial shock is priced aggressively. But as weeks become months, the equity market begins to discount the conflict as background noise, even if oil remains $20 per barrel above pre-war levels and inflation continues to compound.
This half-life problem cuts in two directions. On the way in: investors are often too slow to price a new geopolitical risk, underestimating how durable its effects will be. On the way out: investors often reprice risk premia too quickly back to baseline, treating a structural change in the global system as if it were a weather event that has now passed. The Strait of Hormuz may reopen. But global shipping has permanently re-priced war-risk. Sovereign wealth funds in the Gulf are permanently reconsidering their US dollar reserve holdings. Indian and Japanese energy policymakers are permanently accelerating domestic diversification. These structural changes do not vanish when the headline risk premium fades.
Key takeaway: When pricing geopolitical disasters, separate the acute risk premium (which will fade) from the structural repricing (which will not). The former is a trading signal. The latter is an asset allocation decision that most portfolios have not yet made.
Lesson Six: The moment you feel safest is precisely when you are most exposed
The final lesson is the most counter-intuitive, and arguably the most important. There is a specific period in any market cycle — often 18 to 36 months after the previous crisis — when the cost of tail protection is at its cheapest, investor confidence is high, and catastrophe risk feels entirely theoretical. This is exactly when the next disaster is being loaded.
We can locate this period with precision in the current cycle. In early 2026, the CAPE ratio on US equities reached 39.8, its second-highest reading in 150 years. The Buffett Indicator (total market cap to GDP) hovered between 217 and 228 percent — historically associated with the period immediately before major corrections. CAT bond spreads were at post-Ian lows. VIX had compressed back to mid-teens. Private-credit redemption queues were elevated but not yet alarming. And the macroeconomic consensus — including, notably, within the US Treasury — was that tariff-driven inflation would prove transitory and that central banks would be cutting before mid-year.
Every one of those conditions has now reversed. The reversal took six weeks.
The academic literature on learning and disaster risk, particularly the Kozlowski, Veldkamp, and Venkateswaran (2020) framework on “scarring” from rare events, finds that markets systematically underestimate disaster probability in long stretches without disasters, then over-correct sharply when one arrives. This is not irrationality in the pejorative sense — it is Bayesian updating in the presence of genuinely ambiguous information. But the practical implication is stark: the time to buy disaster insurance is not after the disaster has arrived and the VIX has spiked to 45. It is in the quiet months when every indicator says you don’t need it.
Key takeaway: Maintain systematic, rule-based disaster hedges that do not depend on a real-time catastrophe forecast. The moment it feels unnecessary to hold tail protection is the moment the portfolio is most exposed to needing it.
The Synthesis: From Lessons to Portfolio Architecture
These six lessons converge on a single architectural principle: disaster pricing is not a moment-in-time forecast exercise. It is a permanent structural feature of portfolio construction.
The real mistake — the one that has cost investors dearly in 2020, in 2022, and again in 2026 — is not failing to predict the next disaster. It is believing that markets have already priced it in. The history of catastrophe pricing teaches us, with brutal consistency, that they have not. The cascade is underpriced. The price-discovery failure is unmodelled. The CAT bond spread is supply-driven, not risk-driven. The EM signal is ignored. The geopolitical risk premium is given a shorter half-life than the structural damage it caused. And the tail hedge is cancelled precisely when it is most needed.
The investors who will outperform across the full cycle are not those who predicted the Hormuz closure or the tariff escalation or the next crisis that has not yet been named. They are those who understood that unpriceable disasters are not unpriceable because they are impossible to imagine. They are unpriceable because the incentive structures of the investment industry consistently penalise the premiums required to hedge them.
That gap between what disasters cost and what markets charge for protection is not a market inefficiency. It is the most durable alpha in finance. Learning to harvest it is, in the deepest sense, the only lesson that matters.
Discover more from The Economy
Subscribe to get the latest posts sent to your email.

There was a moment, somewhere in the fog of mid-2025, when the prevailing consensus on Wall Street and in the marble corridors of multilateral institutions was something close to dread. U.S. tariffs had mushroomed into the most aggressive trade barriers since Smoot-Hawley. Shipping lanes were fractured. Geopolitical fault lines — in the Middle East, in the Taiwan Strait, across the ruins of eastern Ukraine — had not so much deepened as multiplied. The prophets of doom were well-provisioned with data. And yet, here we are. The global economy, battered and limping, is still standing — and in certain respects, walking rather faster than feared.
This is not a triumphalist story. The global economy more resilient than feared narrative deserves neither uncritical celebration nor smug vindication. What it demands is honest, clear-eyed examination. Why did the worst not happen? What forces absorbed the blows? And — most critically — does the resilience we are witnessing reflect structural strength, or is it a borrowed grace, a temporary reprieve before deeper reckonings arrive?
The numbers, for now, tell a story of surprising steadiness. The IMF’s January 2026 World Economic Outlook projects global growth at 3.3 percent for 2026 and 3.2 percent for 2027 — a small but meaningful upward revision from October 2025 estimates. IMF Managing Director Kristalina Georgieva, speaking at Davos in January 2026, called this outcome “the biggest surprise” — a remarkable concession from the head of the institution whose job it is, partly, to anticipate exactly this. Meanwhile, the UN Department of Economic and Social Affairs estimated 2025 global growth at 2.8 percent, better than expected given the tariff storm that rolled through international trade. The OECD, for its part, subtitled its December 2025 Economic Outlook “Resilient Growth but with Increasing Fragilities” — a formulation that is, in its cautious way, almost poetic.
The Four Pillars of an Unlikely Resilience
So what happened? Why didn’t it break?
1. The Private Sector Adapted Faster Than Governments Could Fragment
Perhaps the single most underappreciated force in the global economy’s durability is the sheer agility of the private sector. Georgieva at Davos was blunt about it: globally, governments have stepped back from running companies, and the private sector — “more adaptable, more agile” — has filled the void. When tariffs on certain trade corridors spiked, supply chains did not collapse so much as reroute. Manufacturers diversified sourcing from China to Vietnam, Mexico, and India. Companies front-loaded exports ahead of anticipated barriers, producing a short-term trade surge that buffered 2025 GDP figures across multiple economies. The OECD noted that global growth continued at a resilient pace, driven in part by the front-loading of trade in anticipation of higher tariffs earlier in the year, alongside strong AI investment and supportive macroeconomic policies.
This is, of course, a partial answer. Front-loading is not structural growth — it borrows demand from the future. But it bought time, and time, in economics, is often everything.
2. Technology Investment as the New Growth Engine
The second pillar is one that carries both the greatest promise and the most dangerous ambiguity: the relentless surge in artificial intelligence and broader information technology investment. The IMF’s analysis identified continued investment in the technology sector — especially AI — as a key driver of resilience, acting as “a very powerful driver of growth and potentially prosperity”. The OECD’s data underscores the geography of this boom: AI-related trade now accounts for roughly 15.5 percent of total world merchandise trade, with two-thirds of that originating in Asia. Tech exports from Korea and Chinese Taipei continued rising into late 2025. In the United States, the numbers are almost surreal: strip out AI-related investments, and U.S. GDP contracted slightly in the first half of 2025.
This tells you something important. The global economy’s resilience in 2025–26 is, in significant measure, a tech-sector story. It is a story concentrated in a handful of companies, a handful of geographies, and a single technological paradigm. That concentration is both the source of its power and the root of its fragility — a point we will return to.
3. Monetary and Fiscal Policy Did Not Drop the Ball
History will be reasonably kind to the monetary policymakers of this era — not because they were brilliant, but because they did not, on balance, panic. Central banks that had raised rates aggressively through 2022–23 began easing with measured care as inflation declined. Global headline inflation fell from 4.0 percent in 2024 to an estimated 3.4 percent in 2025, with further moderation projected toward 3.1 percent in 2026. This easing in price pressures gave central banks room to cut, which in turn supported financial conditions, credit availability, and investment flows. The IMF noted that “accommodative financial conditions” were among the key offsetting tailwinds to trade disruptions.
Fiscal policy, too, surprised — though not without cost. Governments spent. Defence budgets expanded. Industrial policy packages — from the remnants of U.S. clean energy subsidies to the EU’s Recovery and Resilience Facility — continued channelling public money into capital formation. The bill, of course, is accumulating. But in 2025 and into 2026, fiscal firepower helped absorb shocks that might otherwise have cascaded.
4. Emerging Market Resilience Held the Global Average
The fourth pillar is often underweighted in Western commentary: the developing world, especially in Asia, continued to grow. South Asia is forecast to expand 5.6 percent in 2026, led by India’s 6.6 percent expansion, driven by resilient consumption and substantial public investment. Africa is projected at 4.0 percent. These are not trivial numbers. When commentators in New York or London describe the global economy as “resilient,” they are describing an aggregate that is substantially upheld by hundreds of millions of consumers and workers in economies whose stories rarely make the front page of financial newspapers. The heterogeneity is stark: the OECD bloc muddles along; the emerging world, in many places, runs.
The Data Beneath the Headlines: A Comparative Snapshot
| Institution | 2025 Global Growth | 2026 Forecast | Key Drivers Cited |
|---|---|---|---|
| IMF (Jan 2026) | 3.3% | 3.3% | AI investment, fiscal/monetary support, private sector agility |
| OECD (Dec 2025) | 3.2% | 2.9% | Front-loading, AI trade, macroeconomic policy |
| UN DESA (Jan 2026) | 2.8% | 2.7% | Consumer spending, disinflation, EM domestic demand |
The discrepancies in headline figures reflect genuine methodological differences — purchasing power parity weighting, country coverage, base year choices. But the directional consensus is unmistakable: the world grew more in 2025 than it was expected to when tariff escalation peaked. That is a fact worth sitting with.
Why the Resilience Is Under-Appreciated (and Why That Matters)
Here is an inconvenient truth about economic discourse: bad news travels faster, and fear is more monetisable than optimism. The financial media ecosystem is structurally incentivised to amplify downside scenarios. The think tanks that warned loudest about a tariff-induced recession in 2025 are not, by and large, issuing prominent corrections.
This matters because misread resilience breeds misguided policy. If policymakers believe the economy is weaker than it actually is, they over-stimulate — running up debt, inflating asset prices, postponing necessary reforms. If investors believe fragility is the baseline, they underallocate capital to productive long-term investments in favour of short-term hedging. Getting the diagnosis right is not academic; it shapes behaviour, and behaviour shapes outcomes.
The IMF noted that the trade shock “has not derailed global growth” and that global economic growth “continues to show considerable resilience despite significant trade disruptions caused by the US and heightened uncertainty”. Georgieva’s “biggest surprise” framing is telling: even the IMF, with all its modelling resources, did not anticipate the degree of offset. That should prompt a certain epistemic humility about our collective ability to forecast economic shocks — and perhaps a corresponding caution about declaring the worst inevitable next time.
The Fragilities That Resilience Is Masking
And yet. Here is where intellectual honesty demands a sharp turn.
The IMF warned explicitly that the current resilience “masks underlying fragilities tied to the concentration of investment in the tech sector,” and that “the negative growth effects of trade disruptions are likely to build up over time.” The OECD’s subtitle — “Resilient Growth but with Increasing Fragilities” — deserves to be read in full, not just the first half. There are at least five structural vulnerabilities that the headline growth numbers obscure.
The AI Bubble Risk Is Real and Underpriced
The same technology boom that is holding up the global economy today could become its undoing if expectations are not met. The IMF cautioned explicitly about the risk of a correction in AI-related valuations, warning that if tech firms fail to “deliver earnings commensurate with their lofty valuations,” a correction could trigger lower-than-expected growth and productivity losses. The OECD echoes this: weaker-than-expected returns from net AI investment could trigger widespread risk repricing in financial markets, given stretched asset valuations and optimism about corporate earnings.
Strip out AI investment from U.S. GDP and the economy contracted in early 2025. That is a remarkable statement of concentration risk, and it deserves to be said plainly: a significant portion of what we are calling “global resilience” is a bet on AI productivity gains materialising at scale, on schedule. That bet may be correct. It may also be the largest speculative bubble since the dot-com era, dressed in more sophisticated clothes.
Public Debt Is a Ticking Clock
Governments spent their way through the pandemic, then through the inflation crisis, then through the tariff shock. The fiscal bills are accumulating. The OECD flagged that high public spending pressures from rising defence requirements and population ageing are increasing fiscal risks, while NATO countries plan to raise core military spending to at least 3.5% of GDP by 2035. The IMF maintains that governments still have “important work to do to reduce public debt to safeguard financial stability.” None of this is new, but the accumulation of deferred reckoning is reaching levels where the next shock — a pandemic, a financial crisis, a major military conflict — will find fiscal buffers meaningfully depleted.
Geopolitical Fragmentation Has Not Stabilised
The Strait of Hormuz, through which roughly a fifth of global oil supply normally flows, saw shipping traffic fall 90 percent during a fresh Middle East escalation. The IMF’s Georgieva warned that if the new conflict proves prolonged, it has “clear and obvious potential to affect market sentiment, growth, and inflation”. For Japan alone, close to 60 percent of oil imports transit through the strait. For Asia broadly, the exposure is existential in energy security terms. The tariff wars between the U.S. and China have eased somewhat from their 2025 peaks, but the WTO’s Director-General has warned that a full U.S.-China economic decoupling could reduce global output by 7 percent in the long run — a figure that dwarfs any AI productivity upside currently modelled.
Inequality Is Widening, Not Narrowing
The resilience of the global aggregate conceals a distributional disaster. The UN Secretary-General António Guterres noted that “many developing economies continue to struggle and, as a result, progress towards the Sustainable Development Goals remains distant for much of the world”. High prices continue to erode real incomes for low- and middle-income households across the globe, even as headline inflation falls. AI productivity gains, where they materialise, are accruing disproportionately to capital owners and highly skilled workers in a handful of advanced economies. The Davos consensus on AI-as-equaliser remains aspirational, not empirical.
Supply Chain Concentration Has Not Been Solved
The pandemic briefly sensitised policymakers to the fragility of hyper-concentrated global supply chains. Yet China still accounts for more than 50 percent of all rare earth mining and lithium globally, and more than 90 percent of all magnet manufacturing and graphite. These are not peripheral materials — they are the physical substrate of the AI economy, the clean energy transition, and modern defence systems. A single supply disruption event here would cascade through semiconductors, electric vehicles, wind turbines, and data centres simultaneously. The diversification rhetoric remains largely rhetoric.
What Genuine Resilience Would Actually Look Like
Reading the data carefully, one is struck by the difference between resilience as a condition and resilience as a strategy. What the global economy has demonstrated since 2022 is resilience of the first kind: absorption capacity, improvisational agility, the ability to muddle through. What it has not yet demonstrated is resilience of the second kind: the deliberate construction of buffers, the investment in systemic redundancy, the political willingness to accept short-term costs for long-term stability.
Georgieva’s injunction at Davos — “learn to think of the unthinkable, and then stay calm, adapt” — is good personal advice. As a framework for global economic governance, it is insufficient. Here, then, is what bold, prescription-level thinking demands:
1. A Multilateral AI Investment Framework. The AI boom cannot continue to be managed as a purely national or corporate phenomenon. A framework housed at the WEF or the OECD should establish shared standards for AI investment disclosure, productivity accounting, and systemic risk assessment. If AI is indeed driving 15 percent of world merchandise trade, it deserves the kind of multilateral oversight that financial instruments won — slowly, imperfectly — after 2008.
2. Coordinated Fiscal Consolidation Timelines. The IMF’s calls for debt reduction need to be backed by credible multilateral timelines, not just bilateral conditionality. A G20-level framework that sequences fiscal consolidation against growth indicators — rather than imposing austerity into downturns — would give markets clearer signals while protecting public investment in strategic sectors.
3. Strategic Supply Chain Diversification, Funded Publicly. The World Bank and regional development banks should establish dedicated financing windows for critical minerals diversification and processing capacity outside current concentration zones. This is not protectionism — it is systemic risk management, and it is overdue.
4. A Green and Digital Investment Compact for the Global South. The differential between 6.6 percent growth in India and negative growth in parts of sub-Saharan Africa is not inevitable — it reflects infrastructure deficits and financing gaps that multilateral institutions have the tools, if not always the will, to address. The UN DESA report is explicit: without stronger policy coordination, today’s pressures risk locking the world into a lower-growth path, with developing nations shouldering a disproportionate share of the pain.
5. Central Bank Independence as a Non-Negotiable. The IMF has stressed that central bank independence remains critical for both price stability and credibility. In an era when political leaders are increasingly tempted to subordinate monetary institutions to short-term electoral calculations — particularly around the inflation-tariff nexus — this point deserves repetition, loudly, without apology.
The Verdict: Resilient, But Not Invulnerable
Let us be precise about what the evidence shows. The global economy has absorbed, without breaking, a series of shocks that would have qualified as catastrophic by pre-pandemic standards. It has done so through a combination of technological investment, fiscal and monetary firepower, private sector adaptability, and the sheer demographic and economic weight of emerging economies continuing to grow. This is genuinely impressive. It should not be dismissed.
But resilience in a storm is not the same as being sea-worthy. The hull is holding — for now. The debt levels are high and rising. The geopolitical weather is worsening. The AI boom is either the most transformative force since the industrial revolution or the most dangerous speculative bubble since tulips, and the honest answer is that we do not yet know which. As the IMF’s own blog put it in January 2026, the challenge for policymakers and investors alike is “to balance optimism with prudence, ensuring that today’s tech surge translates into sustainable, inclusive growth rather than another boom-bust cycle.”
Georgieva’s injunction rings true: “We need to not only understand why it is resilient, but nurture this resilience for the future.” That is the work that has not yet been done. The economy has surprised us. The question is whether we are surprised enough to actually change course — or whether, as so often in history, relief becomes complacency, and complacency becomes the seed of the next crisis.
The global economy is more resilient than we feared. It is less resilient than we need it to be. That gap — between the relief of today and the demands of tomorrow — is the most important space in contemporary economic policy. Filling it requires not optimism alone, nor pessimism, but something rarer and more valuable: clarity.
📊 Key Growth Forecasts at a Glance (2025–2027)
| Economy | 2025 (Est.) | 2026 (Forecast) | 2027 (Forecast) |
|---|---|---|---|
| World (IMF) | 3.3% | 3.3% | 3.2% |
| World (UN DESA) | 2.8% | 2.7% | 2.9% |
| World (OECD) | 3.2% | 2.9% | 3.1% |
| United States | ~1.9–2.0% | 2.0–2.4% | 1.9–2.0% |
| China | 5.0% | 4.4–4.5% | 4.3% |
| Euro Area | 1.3% | 1.2–1.3% | 1.4% |
| India | ~6.3% | 6.3–6.6% | 6.5% |
| Japan | 1.1–1.3% | 0.7–0.9% | 0.6–0.9% |
Sources: IMF WEO January 2026; OECD Economic Outlook December 2025; UN DESA WESP 2026
Discover more from The Economy
Subscribe to get the latest posts sent to your email.
Analysis
Iran’s Real Weapon Is the World Economy: How Missiles, Drones, Mines and Selective Maritime Disruption Are Reshaping Global Risk
When the White House quietly confirmed that US President Donald Trump would travel to Beijing on May 14 to 15, rescheduling a summit previously derailed by the sudden outbreak of the Iran war on February 28, it was more than a mere scheduling adjustment. It was a stark geopolitical admission. The delay revealed that this conflict in the Middle East is now structurally vast enough to disrupt the calendars of great powers, distort global markets, and force governments thousands of miles from the Persian Gulf to urgently rethink energy security, inflation, and supply-chain resilience.
For decades, military analysts have war-gamed a clash between Washington and Tehran through the sterile lens of conventional military metrics: ship counts, sortie rates, and air defense batteries. But as the events of the past month have demonstrated with chilling clarity, the central question of this conflict is no longer whether Iran can defeat the United States or Israel conventionally. They cannot, and they know it.
The real question is whether Tehran can make the economic price of continuing the war too high, too global, and too prolonged for the West to ignore. We are witnessing a masterclass in asymmetric warfare where Iran’s real weapon is the world economy. By deploying low-cost, high-impact tools, Tehran is proving that missiles, drones, mining threats and selective maritime disruption can be enough to make insurers, traders, shipowners and governments reprice risk across the entire globalized system.
Iran’s strategy is a meticulously calibrated economic coercion. Tehran is exploiting a rare combination of geography, target concentration and asymmetric tools to hold the global economic recovery hostage. And so far, the financial markets are proving them right.
The New Paradigm: Iran Asymmetric Economic Warfare
To understand the genius—and the terror—of Iran’s current playbook, one must discard the 20th-century notion that wars are won by destroying the enemy’s military formations. In a hyper-connected, hyper-optimized global economy, a nation does not need to sink a fleet to achieve strategic parity; it merely needs to make the cost of transit commercially unviable.
This is the essence of Iran asymmetric economic warfare. By utilizing swarms of cheap loitering munitions, unmanned surface vessels, and the persistent, invisible threat of naval mines, Tehran has fundamentally altered the cost-benefit analysis of navigating the world’s most critical maritime chokepoints. A $20,000 drone does not need to sink a $150 million Very Large Crude Carrier (VLCC) carrying $100 million worth of oil. It only needs to scorch its deck to trigger a systemic panic in the underwriting rooms of London and New York.
Tehran understands the fragility of the maritime arteries that sustain modern capitalism. This is why the recent entrance of Yemen’s Houthis into the broader conflict is so destabilizing. We are no longer looking at an isolated crisis in the Strait of Hormuz; we are facing a dual-chokepoint strangulation encompassing both Hormuz and the Bab el-Mandeb Strait. By targeting commercial vessels selectively—and reportedly floating a mafia-style “$2 million-per-ship fee” for guaranteed safe passage—Iran and its proxies are effectively levying a private tax on global trade.
This is not a traditional blockade. It is a protection racket scaled to the size of the global economy. Through Iran missiles drones mining global supply chains, Tehran is executing a strategy designed not to win a military victory, but to inflict a political and economic pain threshold that forces a diplomatic capitulation.
Repricing the Gulf: Iran Maritime Disruption Insurance
The immediate frontline of this new war is not the flight deck of a US aircraft carrier; it is the actuarial spreadsheets of global maritime insurers. The Strait of Hormuz disruption 2026 is triggering a seismic shift in how risk is priced, bought, and sold.
Prior to February 28, an estimated 20% of global oil consumption—roughly 21 million barrels per day—transited the Strait of Hormuz. Today, that volume has contracted sharply as shipping companies route around the cape or pause voyages entirely. For those that dare the passage, the financial toll is staggering. War-risk insurance premiums have skyrocketed, surging from a fraction of a percent of a vessel’s value to unsustainable single-digit percentages practically overnight.
As the Financial Times notes in its analysis of maritime risk, when Gulf shipping risk insurers repricing occurs at this velocity, the costs are immediately passed down the supply chain. Iran maritime disruption insurance is no longer a niche concern for shipping magnates; it is a direct inflationary tax applied to every commodity, manufactured good, and barrel of oil moving between East and West.
Data Visualization Context: [Chart: Oil Price Trajectory vs. Shipping Volumes Through Hormuz & Bab el-Mandeb Since Feb 28] – A diverging line graph illustrating the inverse relationship between plunging daily vessel transits in the Gulf and the sharp, unbroken ascent of Brent Crude prices crossing the $100 threshold.
This dynamic forces a profound recalibration of what constitutes “risk.” A shipowner looking at a 500% increase in war-risk premiums must decide if the cargo is worth the financial gamble. When the answer is no, vessels sit idle, supply chains freeze, and the global economy chokes. This is precisely what the architects in Tehran intended.
The Macro Shock: Inflation, Oil Trajectories, and Fed Paralysis
The ripple effects of this strategy are already crashing onto the shores of Western central banks. The Iran war oil prices impact has been immediate and violent. With US crude settling above the $100 mark and Brent eyeing a record monthly rise, the specter of the 1970s oil shocks has returned to haunt policymakers. The International Energy Agency (IEA) has already sounded the alarm, warning that we are teetering on the edge of the “largest supply disruption in history” if the conflict broadens to regional oil infrastructure.
This energy shock arrives at the worst possible macroeconomic moment. Just as the US Federal Reserve and the European Central Bank believed they had tamed the post-pandemic inflation dragon, the Gulf crisis has reignited price pressures. Federal Reserve Chair Jerome Powell recently signaled a “wait and see” approach regarding the war’s economic fallout, a subtle admission that the central bank is trapped. Raising interest rates to combat oil-driven inflation risks plunging the global economy into a deep recession; holding them steady risks allowing inflation to become entrenched.
The Economist recently highlighted the resurgence of stagflation fears, pointing out that a prolonged conflict exceeding three months will inevitably lead to deep macroeconomic scarring. By weaponizing the oil markets, Iran has effectively bypassed the Pentagon and launched a direct strike on the Federal Reserve. This is the zenith of Iran calibrated economic coercion 2026: forcing Western leaders into impossible domestic political dilemmas.
Target Concentration: The Outsized Impact on Asian Economies
While the geopolitical theater is fixated on the Washington-Tehran dynamic, the true economic victims of this asymmetric warfare reside in the East. The Strait of Hormuz closure economic impact on Asia cannot be overstated. The economies of China, Japan, India, and South Korea are fundamentally reliant on Middle Eastern crude and liquefied natural gas (LNG).
Tehran’s strategy capitalizes heavily on this “target concentration.” The overwhelming majority of the oil flowing through Hormuz is destined for Asian markets. Consequently, the disruption serves as a blunt instrument of leverage against the very nations that historically maintain neutral or even amicable relations with Iran.
The real-time fallout across the Indo-Pacific is stark. In Singapore, households are already facing immediate electricity tariff hikes for the April-June quarter, with the Energy Market Authority warning of sharper increases to come. Major logistics hubs are feeling the squeeze, with companies like Yeo Hiap Seng cutting headcount and moving operations to navigate the margin crush. Supply chains are fraying; luxury cars destined for Asian markets are stranded in Sri Lankan ports as Japanese shipping companies face paralyzing congestion.
To mitigate the crisis, Asian powers are scrambling for alternatives. Japan is hastily coordinating with Indonesia to secure thermal coal as a fallback for power generation, risking its climate commitments in the name of raw survival. Meanwhile, in a fascinating display of diplomatic fracture, Malaysia recently announced that its tankers would be exempt from Iran’s reported Hormuz toll—a testament to Kuala Lumpur’s pragmatic, long-standing relationship with Tehran.
This selective enforcement is the most insidious aspect of Iran economic coercion. By granting safe passage to some nations while punishing others, Tehran is attempting to divide the international community, making a unified coalition impossible. It forces Beijing and New Delhi to pressure Washington for a rapid de-escalation, effectively turning America’s vital trading partners into unwitting lobbyists for Iranian interests.
The Limits of Conventional Deterrence
The stark reality of 2026 is that traditional naval hegemony is insufficient to guarantee the free flow of global commerce. The US Navy, for all its unparalleled lethality, is designed to destroy state-level navies and project power ashore. It is not inherently designed to play an endless, unwinnable game of Whac-A-Mole against swarms of explosive drones launched from the backs of pickup trucks, or to sweep vast swathes of the Gulf for untethered acoustic mines.
As detailed by Foreign Affairs in their recent evaluation of Gulf security, attempting to solve an asymmetric economic problem with a symmetric military solution is a fool’s errand. Every Tomahawk missile fired at a fifty-dollar drone launch pad is a victory for Tehran’s arithmetic. The sheer cost imbalance heavily favors the instigator.
Furthermore, the secondary knock-on effects are paralyzing corporate strategy. Multinational giants are scaling back; consumer goods titans like Unilever have reportedly imposed global hiring freezes explicitly citing the Middle East war’s macroeconomic drag. Credit ratings agencies are recalibrating the sovereign debt of Gulf nations, with Fitch signaling downgrade risks for regional players due to post-war security environment uncertainties.
When global capital begins to view the entire Middle East as functionally un-investable and physically un-navigable, Iran’s objective is met. They do not need to plant a flag in Washington. They simply need to make the Dow Jones bleed until Washington offers terms.
Conclusion: Navigating a Repriced World
When Presidents Trump and Xi sit down in Beijing this May, the agenda will not merely be about tariffs, semiconductor export controls, or artificial intelligence dominance. The specter at the banquet will be the vulnerability of their shared globalized economy to asymmetric disruption. The Iran war of 2026 has irrevocably proved that the ultimate weapon of mass disruption is not nuclear; it is logistical.
We have entered an era where Iran’s real weapon is the world economy. The success of calibrated economic coercion means that future conflicts will increasingly mirror this blueprint. Rogue states and non-state actors alike have learned that by applying pressure to the delicate, over-optimized nodes of global supply chains, they can punch vastly above their geopolitical weight class.
The West cannot bomb its way out of an insurance crisis. Countering this new reality requires more than just deploying additional carrier strike groups. It demands a total reimagining of global supply-chain resilience, a rapid acceleration toward localized and diversified energy grids, and the painful acceptance that the era of friction-free, perfectly timed global shipping is over.
Until the world economy can insulate itself from the asymmetric leverage of chokepoint disruption, the true balance of power will not be measured in ballistic missiles or stealth fighters. It will be measured in the terrifyingly fragile mathematics of freight rates, risk premiums, and the price of a barrel of crude. The world has been repriced. We are all just paying the toll.
Discover more from The Economy
Subscribe to get the latest posts sent to your email.
-

 Markets & Finance3 months ago
Top 15 Stocks for Investment in 2026 in PSX: Your Complete Guide to Pakistan’s Best Investment Opportunities
-

 Analysis2 months ago
Brazil’s Rare Earth Race: US, EU, and China Compete for Critical Minerals as Tensions Rise
-

 Banks3 months ago
Best Investments in Pakistan 2026: Top 10 Low-Price Shares and Long-Term Picks for the PSX
-

 Investment3 months ago
Top 10 Mutual Fund Managers in Pakistan for Investment in 2026: A Comprehensive Guide for Optimal Returns
-

 Analysis2 months ago
Top 10 Stocks for Investment in PSX for Quick Returns in 2026
-

 Asia3 months ago
China’s 50% Domestic Equipment Rule: The Semiconductor Mandate Reshaping Global Tech
-

 Global Economy3 months ago
15 Most Lucrative Sectors for Investment in Pakistan: A 2025 Data-Driven Analysis
-

 Global Economy3 months ago
What the U.S. Attack on Venezuela Could Mean for Oil and Canadian Crude Exports: The Economic Impact