
Markets & Finance
North Sea Oil Prices Hit Record High as Iran Keeps Hold Over Hormuz.

The Physical Market Is Screaming What Futures Won’t Admit
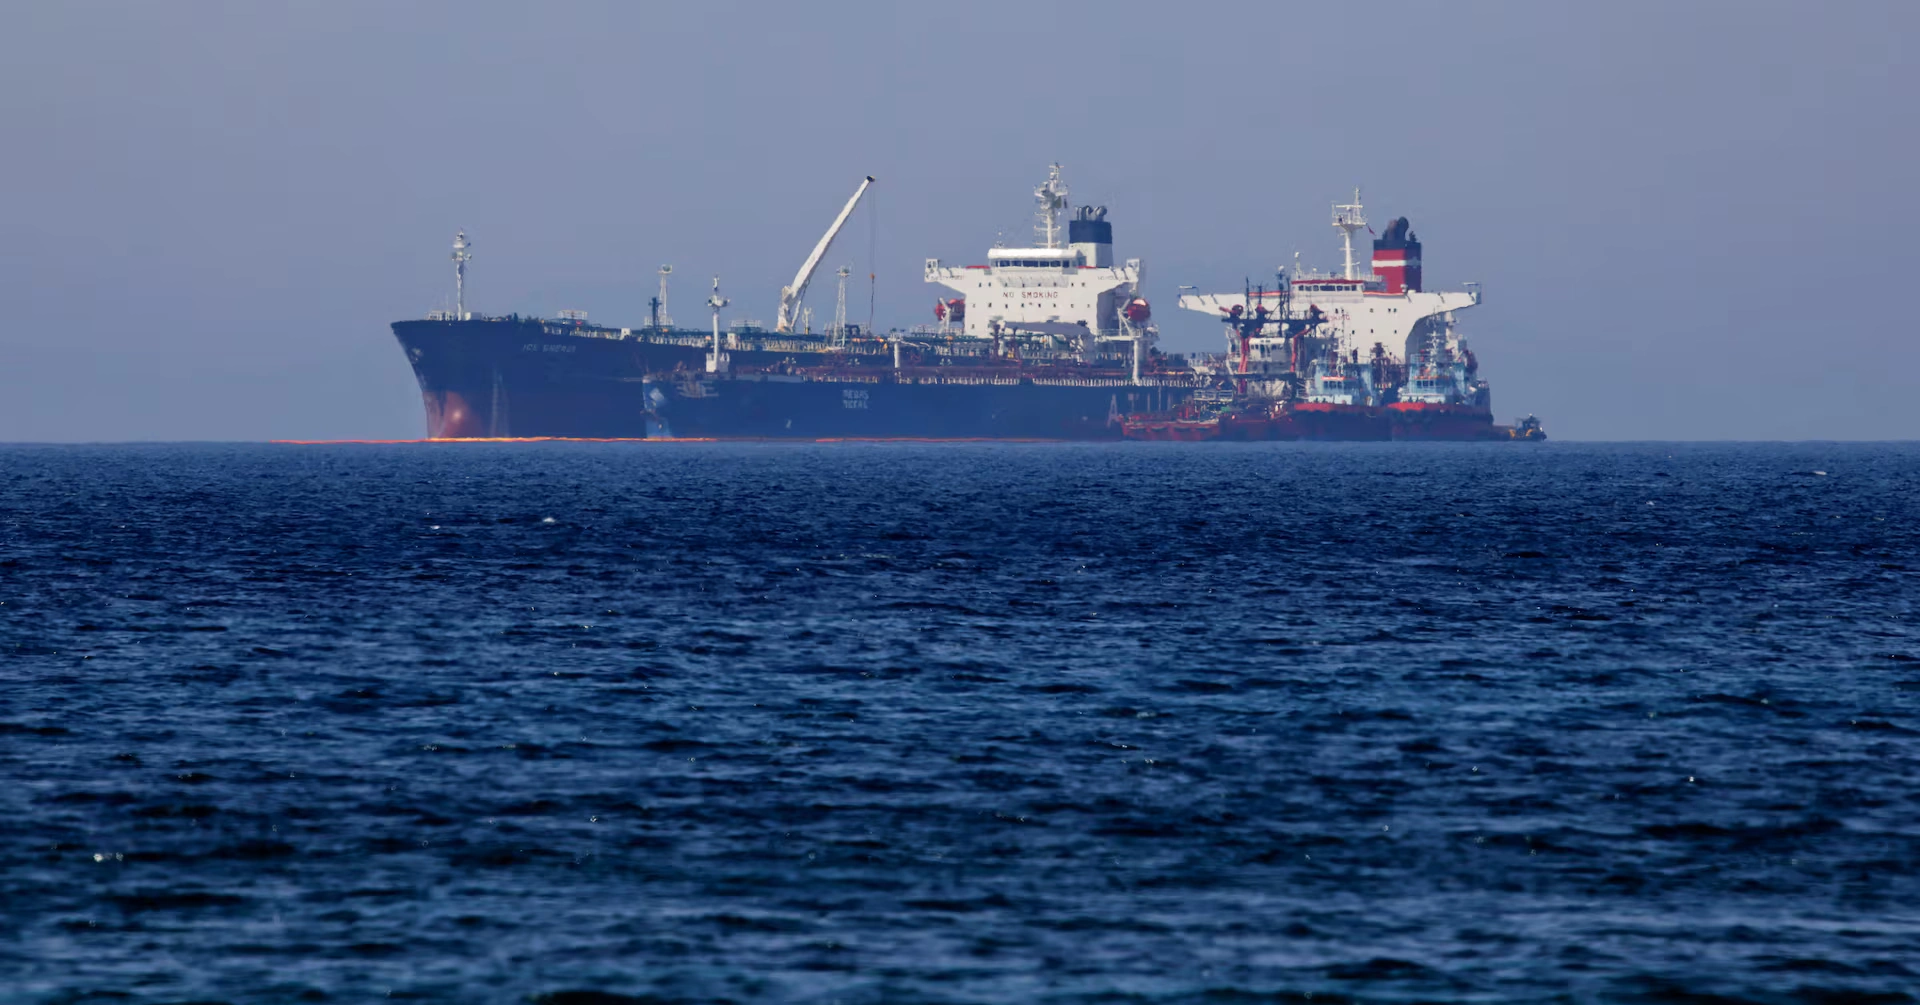
On the afternoon of April 7, 2026, as President Donald Trump’s 8:00 p.m. deadline for Iran loomed, something unprecedented happened in the North Sea. Dated Brent—the benchmark for physical cargoes of crude oil being loaded onto ships—touched $144.42 per barrel, surpassing the crisis peaks of Russia’s 2022 invasion of Ukraine and even the 2008 global financial crisis frenzy. By the following day, some North Sea Forties cargoes were effectively pricing north of $150 per barrel.
Meanwhile, Brent futures for June delivery—the paper contracts that dominate news tickers—hovered around $96.50 to $110 per barrel, creating a historic $32-per-barrel premium between physical spot markets and forward contracts. This is not merely a spread. This is a warning siren.
The message from the physical market is unambiguous: the ceasefire is theater, and the energy crunch is only beginning.
The Ceasefire That Isn’t: Iran’s De Facto Hormuz Control
The United States and Iran announced a two-week ceasefire on the evening of April 7, 2026, following nearly six weeks of conflict that began with U.S.-Israeli strikes on February 28. The agreement, brokered with Pakistani mediation, was meant to pause military operations and reopen the Strait of Hormuz—the chokepoint through which 20 million barrels per day of crude and products transited before the war, representing roughly 20% of global seaborne oil trade.
Yet by April 10, the strait remained effectively closed to normal commercial traffic. According to MarineTraffic data, only six ships transited the strait on April 9—including just two oil or chemical tankers—compared to 53 tankers on February 27, the day before hostilities began. The first non-Iranian oil tanker to pass since the ceasefire—a Gabon-flagged vessel carrying 7,000 tonnes of Emirati fuel oil—only transited on April 9, nearly 48 hours after the truce took effect.
The reason for the paralysis is simple: Iran has institutionalized control over the waterway. Under the ceasefire terms announced by Tehran, all vessels must coordinate passage with the Islamic Revolutionary Guard Corps (IRGC) Navy and navigate designated corridors—specifically routes between Qeshm and Larak islands that avoid Iranian-laid sea mines. Iran’s Ports and Maritime Organization explicitly stated that transit requires “coordination with Iran’s Armed Forces and with due consideration to technical limitations”.
This is not freedom of navigation. This is a toll system disguised as security protocol.
The $2 Million Question: Iran’s Economic Warfare
President Trump took to Truth Social on April 10 to warn Iran against charging “fees” to tankers: “They better not be and, if they are, they better stop now!”. But the reality on the water suggests otherwise.
According to maritime intelligence firm Lloyd’s List and multiple ship brokers, Iran has been using Larak Island as a tolling stop for tankers during the war, demanding payments of $1 million to $2 million per vessel—or approximately $1 per barrel—with fees collected in Chinese yuan or cryptocurrency. Iranian-flagged vessels and ships from “friendly” nations like Malaysia reportedly transit toll-free, while vessels from Western-aligned countries face exclusion or exorbitant charges.
If normalized at pre-war traffic levels of roughly 21.5 million barrels daily, a $1-per-barrel toll would generate approximately $645 million monthly—or $7.74 billion annually—for the Iranian regime. This is not incidental revenue; this is a strategic economic weapon that transforms Hormuz from a passive chokepoint into an active taxation regime on global energy flows.
The implications extend beyond immediate costs. As CIBC Private Wealth’s Rebecca Babin notes, “A toll structure effectively puts a straightjacket on flows… creating friction and likely reducing overall throughput”. Even if the ceasefire holds, Iran has demonstrated that it can constrain global supply at will—and profit handsomely from doing so.
The North Sea Premium: A Market Voting With Its Feet
While futures traders price in an optimistic resolution—Brent futures remain in steep backwardation, with front-month contracts commanding premiums over longer-dated ones—the physical market tells a different story. The backwardation structure itself signals acute near-term supply tightness; as Société Générale strategists warned, “The system is running out of buffer and the physical market is now signaling acute stress”.
Dated Brent’s surge to $144+ reflects a brutal scramble for prompt barrels among refiners who cannot wait for Hormuz to reopen. With at least 12 million barrels per day of Middle Eastern supply effectively shut in—roughly 12% of global output—European and Asian refiners are bidding aggressively for replacement cargoes from the North Sea, West Africa, and the Atlantic Basin.
The International Energy Agency has characterized the disruption as the “largest supply disruption in the history of the global oil market”. Gulf production cuts have exceeded 10 million barrels per day, including 8 million barrels of crude and 2 million barrels of condensates and NGLs, with major reductions in Iraq, Qatar, Kuwait, the UAE, and Saudi Arabia. Ras Laffan, the world’s largest liquefaction facility in Qatar, has been offline since March 2.
In response, IEA member countries agreed on March 11 to release 400 million barrels from emergency reserves—the largest coordinated stock release in history. Yet as the IEA itself acknowledged, this remains a “stop-gap measure.” Full restoration of flows, according to the U.S. Energy Information Administration, “will take months,” with modeling indicating fuel prices will continue rising until variables resolve.
The Futures-Physical Disconnect: What Traders Are Missing
The divergence between futures and physical markets reveals a dangerous complacency. Futures traders—betting on financial contracts settled months from now—appear to assume the Hormuz crisis will resolve swiftly. Physical buyers, needing barrels today, have no such luxury.
As Wood Mackenzie’s Alan Gelder observed, the Brent futures curve has shifted from pre-war contango (where future prices exceed spot) to pronounced backwardation extending through 2033, reflecting “the challenge on prompt barrel supply and availability as the market is scrambling for crude barrels in all geographies”. The M1-M3 backwardation has widened from roughly $2-3 per barrel pre-war to $20 per barrel currently.
This is not a market expecting a quick fix. This is a market pricing in sustained structural tightness.
The disconnect carries real-world consequences. When physical prices greatly exceed futures, fuel costs for consumers escalate rapidly. As IDX Advisors’ Ben McMillan noted, “Dated Brent is where the rubber meets the road,” and Brent futures surpassing $150 per barrel remains “certainly within the cards” if negotiations fail.
Washington’s Gambit: Theater Over Strategy
The ceasefire negotiations scheduled for April 10 in Islamabad, Pakistan—led by Vice President JD Vance, senior envoy Steve Witkoff, and Jared Kushner—carry the weight of global expectations. Yet the fundamental dynamics undermine optimism.
President Trump has declared that U.S. military forces will remain in place around Iran until a “REAL AGREEMENT” is reached, threatening that “the ‘Shootin’ Starts,’ bigger, and better, and stronger than anyone has ever seen before” if terms are violated. Simultaneously, he has mused about a U.S.-Iran “joint venture” on Hormuz tolls—a proposal that would effectively legitimize Iranian control over the waterway.
This incoherence reflects a deeper strategic failure. As the Council on Foreign Relations’ Steven A. Cook observed, “There has been no regime change in Iran, the current leadership is not any less radical than their predecessors, the Iranians still have the ability to menace their neighbors, and Iran has leverage over the Strait of Hormuz when it did not before the war began”. The war has not degraded Iran’s Hormuz capabilities; it has demonstrated and monetized them.
Israel’s continued strikes on Lebanon—targeting Hezbollah positions that both Iran and Pakistan claim are covered by the ceasefire—further complicate the truce’s viability. German Chancellor Friedrich Merz warned that “the severity with which Israel is waging war there could cause the failure of the peace process as a whole”. When Israeli Prime Minister Benjamin Netanyahu declares that Lebanon is excluded from the ceasefire while Iranian officials insist it is included, the agreement’s foundations appear sand-soft.
The New Energy Security Architecture
The Hormuz crisis has exposed vulnerabilities that will persist regardless of the ceasefire’s fate. The IEA’s emergency stock release, while unprecedented, cannot replace 20 million barrels per day of disrupted flows indefinitely. Global inventories—while currently at 8.2 billion barrels, their highest since February 2021—are being drawn down steadily as “early-March inventory cushions” thin and pre-conflict cargoes discharge.
More fundamentally, the crisis has shattered the assumption that major shipping chokepoints remain neutral infrastructure. Iran has proven that a mid-tier military power can, through asymmetric capabilities—naval mines, missile threats, and IRGC coordination regimes—effectively tax global trade and force superpowers to the negotiating table.
For energy markets, this means a permanent risk premium. The North Sea’s record premiums are not an anomaly; they are the new baseline for a world where physical availability trumps financial speculation. Refiners will pay whatever it takes to secure prompt cargoes, and producers outside the Hormuz zone—North Sea, West African, U.S. Gulf—will command structural premiums for their reliability.
The Verdict: Structural Risks Baked In
The Washington-Tehran ceasefire is not a resolution; it is a tactical pause in a broader confrontation over control of global energy arteries. Iran retains de facto sovereignty over Hormuz transit, complete with IRGC coordination requirements, toll demands, and the demonstrated capacity to close the strait at will. The North Sea’s record physical prices reflect market recognition that this leverage is not temporary—it is structural.
For sophisticated investors and policymakers, the implications extend beyond the immediate price spike. The energy transition narrative—already strained by years of underinvestment—faces a brutal reality check. As one analyst noted, after two decades and $5 trillion invested in renewable energy, the world remains “utterly dependent on crude oil” when supply tightens. The International Air Transport Association has warned that jet fuel shortages will persist for months even after the strait reopens.
The backwardation in futures curves suggests traders expect normalization eventually. The physical market’s screaming premiums suggest otherwise. When the world’s most liquid benchmark crude—North Sea Dated Brent—trades at $144+ per barrel while futures languish $30+ below, the market is voting with its wallet.
The ceasefire has failed to stem the global energy crunch because it was never designed to. It is a face-saving measure that leaves Iran in control, the strait constrained, and physical markets in acute stress. The North Sea premium is not a bug in the system—it is the system adjusting to a new reality where Hormuz is no longer a free passage, but a toll road run by the IRGC.
For energy security planners in Washington, Brussels, Beijing, and beyond, the message is clear: diversification is no longer optional, and strategic reserves are no longer sufficient. The Hormuz crisis has demonstrated that in an era of asymmetric warfare and economic coercion, the chokepoints that matter most are those that can be monetized by those willing to hold them hostage.
The North Sea’s record prices are the first verdict. They will not be the last.
Discover more from The Economy
Subscribe to get the latest posts sent to your email.


Markets & Finance
Indonesia’s Confidence Problem: Record Investment, a Sinking Rupiah, and a Widening Credibility Gap
Introduction
Indonesia’s economic story in mid-2026 is one of genuine contradiction. On one hand, the government posted a record Rp1,010.6 trillion ($56.1 billion) in realized investment for the first half of the year, up 7.2% from a year earlier and on pace to hit its full-year target (Antara News). On the other, the rupiah has been sliding toward Rp18,000 per US dollar, the state budget deficit has widened, and a growing chorus of domestic commentators is warning that Indonesia risks permanently losing what one Jakarta Post analysis called “the vital game of investor confidence” (The Jakarta Post).
The Investment Numbers Look Genuinely Strong
Indonesia’s Investment and Downstreaming Minister Rosan Roeslani reported that first-half 2026 investment realization reached 49.5% of the government’s full-year target of Rp2,041.3 trillion, creating 1.44 million jobs — a 15% increase in job creation compared to the first half of 2025 (Antara News). Domestic and foreign investment remained almost perfectly balanced, with foreign direct investment reaching Rp507.6 trillion (50.2% of the total) against Rp502.9 trillion in domestic investment (Antara News). Notably, investment outside the country’s most populous island, Java, exceeded inflows into Java itself for the first time in this dataset — Rp507.8 trillion versus Rp502.8 trillion — supporting the government’s long-standing goal of more balanced regional development (Antara News).
Singapore remained by far Indonesia’s largest source of foreign capital at $8.8 billion, followed by Hong Kong ($7.6 billion), China ($3.9 billion), Japan ($1.9 billion) and the United States ($1.7 billion) — together accounting for roughly 77.8% of all foreign direct investment into the country (Antara News). Second-quarter investment specifically rose 7.1% year-on-year to Rp511.8 trillion, with Minister Roeslani noting that investor commitment to Indonesia has held up despite significant “geopolitical and geoeconomic challenges” globally (The Jakarta Post).
But the Pace Is Slowing, and the Currency Is Under Pressure
Despite the record absolute figures, the Jakarta Post notes that investment growth in 2026 has been running at a distinctly slower pace than the country achieved in recent prior years, even as it remains on track to hit the annual target (The Jakarta Post). Meanwhile Bank Indonesia has had to actively respond to renewed rupiah weakness, attributing the currency’s slide toward Rp18,000 per dollar to hawkish signals from Federal Reserve officials and broader movements in the US dollar index (Samuel Sekuritas Daily Economic Insights). The state budget deficit reached Rp196.5 trillion in the first half of 2026, equivalent to 0.76% of GDP (Samuel Sekuritas Daily Economic Insights).
There has been some relief more recently: a 27.4% surge in second-quarter foreign direct investment helped strengthen the rupiah, with USD/IDR trading around 17,990 in mid-July as softer US inflation data reduced the odds of a near-term Fed hike (TMGM). Even so, the US dollar has retained broad support from escalating Middle East geopolitical tensions, keeping the rupiah’s recovery fragile rather than decisive (TMGM).
Why Growth Forecasts Keep Getting Trimmed
International lenders have grown more cautious about Indonesia’s growth trajectory for 2026. The OECD has held its outlook at 4.7% year-on-year — a clear deterioration from 2025’s realized 5.1% growth — with most major lending institutions clustering around the 5.0% threshold, implying a loss of momentum after Indonesia posted 5.61% growth in the first quarter of 2026 alone (Indonesia Investments). The deceleration is attributed to a softening labor market, weakening consumer confidence, and contracting retail sales in the second quarter (Indonesia Investments). High global oil prices are compounding the pressure on the government’s fiscal balance, since Indonesia continues to subsidize a significant portion of domestically sold fuel — a policy that transmits global energy volatility directly into the state budget rather than shielding consumers from it entirely (Indonesia Investments).
The Deeper Warning: A Confidence Problem, Not Just a Cyclical One
The most pointed recent critique comes from domestic commentary rather than foreign analysts. A Jakarta Post opinion piece published July 20, 2026 argues Indonesia must halt what it describes as erratic policymaking and institutional erosion before the country permanently damages its standing in the “vital game of investor confidence,” framing the rupiah’s weakness and shifting global market conditions as symptoms of a deeper credibility issue rather than purely external shocks (The Jakarta Post). That framing matters for how the strong headline investment numbers should be read: capital is still arriving, but the terms on which it arrives, and the confidence with which it stays, are visibly more fragile than the raw totals suggest.
Strategic Bright Spots
Not every recent development points toward strain. India secured access to Indonesian critical minerals through several major agreements signed during Prime Minister Narendra Modi’s visit to Jakarta, part of a broader push by Indonesia to leverage its resource base for deeper strategic partnerships (Samuel Sekuritas Daily Economic Insights). Indonesia is also pursuing energy independence through B50 biodiesel and compressed natural gas development, aimed explicitly at reducing reliance on imported LPG — a structural move that, if successful, would reduce exactly the kind of imported-energy vulnerability now straining the budget (Samuel Sekuritas Daily Economic Insights).
Key Takeaways
- Indonesia posted a record Rp1,010.6 trillion ($56.1 billion) in H1 2026 investment, up 7.2% year-on-year, with foreign and domestic capital nearly evenly split.
- The rupiah has weakened toward Rp18,000 per dollar on hawkish Fed signals, though a Q2 FDI surge has since provided partial relief.
- International lenders have trimmed Indonesia’s 2026 growth outlook to around 4.7–5.0%, down from 5.1% realized growth in 2025.
- The H1 2026 budget deficit reached 0.76% of GDP, pressured by continued fuel subsidies amid high global oil prices.
- Domestic commentary increasingly frames Indonesia’s challenge as a credibility and policymaking issue, not merely a cyclical external shock.
Sources: Antara News, The Jakarta Post — Investment Growth, The Jakarta Post — Confidence Game, Samuel Sekuritas Daily Economic Insights, Indonesia Investments, TMGM
Discover more from The Economy
Subscribe to get the latest posts sent to your email.
AI
Anthropic Offers Up to $600,000 Salary for Critical IPO Role as AI Giant Prepares for Wall Street Debut

As anticipation builds around what could become one of the largest technology listings in recent history, artificial intelligence company Anthropic is offering an eye-catching base salary of up to $600,000 for a key investor relations position, underscoring how seriously the company is preparing for its expected initial public offering (IPO).
The San Francisco-based AI developer, best known for its Claude family of AI models, has posted a vacancy for a Director of Investor Relations with a base compensation ranging from $425,000 to $600,000, making it one of the most strategically important hires ahead of its anticipated public market debut. According to a report by Business Insider, the company is expected to pursue an IPO as early as fall 2026, following a surge in valuation and extraordinary revenue growth.
A Strategic Hire Ahead of a Landmark IPO
The investor relations director will be responsible for shaping Anthropic’s investment narrative, maintaining relationships with institutional investors, and helping Wall Street understand the company’s long-term strategy and financial outlook.
According to the job description, the successful candidate will:
- Develop Anthropic’s investment story for public markets.
- Serve as a primary liaison between executive leadership and investors.
- Analyze AI industry developments and communicate their financial implications.
- Support earnings communications, investor presentations, and regulatory disclosures.
- Work closely with the company’s newly appointed Head of Investor Relations.
The position reports into Kenneth Dorell, who joined Anthropic earlier this year after previously leading investor relations at Meta. His appointment reflects the company’s broader effort to build an experienced leadership team capable of navigating public market expectations.
Why Investor Relations Matters More Than Ever
While investor relations roles are common among public companies, they become especially significant during the transition from private to public ownership.
For Anthropic, the challenge extends beyond explaining quarterly financial results. The company must convince investors that its massive investments in AI research, computing infrastructure, and talent acquisition can translate into sustainable long-term growth.
Unlike many traditional software companies, Anthropic operates as a public benefit corporation, meaning it is legally committed to balancing shareholder returns with the responsible development of advanced artificial intelligence. The company’s official mission emphasizes building reliable, interpretable, and safe AI systems for the long-term benefit of society, according to the company’s website.
This dual mandate creates a unique communication challenge for investor relations executives, who must explain how commercial success aligns with responsible AI development.
AI Boom Drives Extraordinary Compensation
The offered salary highlights the increasingly fierce competition for executive talent across the AI industry.
Although a base salary of $600,000 is exceptional by conventional corporate standards, compensation at leading AI companies frequently includes stock awards, bonuses, and long-term incentives that can substantially increase total earnings.
Anthropic has become one of Silicon Valley’s fastest-growing companies, with demand for its enterprise AI products accelerating rapidly. The company’s coding assistant, Claude Code, has gained significant traction among software developers and businesses seeking AI-powered programming tools.
Recent reporting indicates that Anthropic’s annualized revenue has expanded dramatically as enterprise adoption of generative AI continues to accelerate, strengthening investor expectations ahead of a potential IPO.https://www.businessinsider.com/anthropic-ipo-hiring-investor-relations-director-2026-7
Preparing Wall Street for an Unconventional AI Company
Anthropic’s investor relations team faces a unique assignment.
Unlike mature technology companies with decades of operating history, frontier AI companies remain difficult to value because they invest billions of dollars annually in computing infrastructure, model training, and research talent while operating in a rapidly evolving competitive environment.
Potential investors will likely seek clarity on several key questions:
- Future profitability.
- Infrastructure spending.
- AI safety governance.
- Regulatory risks.
- Competitive positioning against OpenAI, Google, Meta, and xAI.
- Long-term monetization strategy.
The investor relations director will play a central role in translating these complex issues into a compelling investment thesis.
Strong Financial Momentum Strengthens IPO Expectations
Anthropic has emerged as one of the world’s most valuable privately held AI companies.
Backed by major investors including Amazon and Google, the company has attracted substantial funding over the past several years while rapidly expanding its enterprise customer base.
Its Claude models have become widely used for coding, research, enterprise automation, and business productivity, placing Anthropic among the strongest competitors to OpenAI.
The company’s remarkable financial momentum has fueled growing speculation that its IPO could become one of the defining public offerings of the AI era.
Competition for AI Talent Intensifies
The generous compensation package also reflects the broader battle for experienced executives across the artificial intelligence sector.
Companies developing frontier AI systems increasingly compete not only for elite researchers and engineers but also for specialists in finance, public markets, communications, and regulatory affairs.
As valuations continue climbing into the hundreds of billions of dollars, experienced executives capable of guiding companies through IPOs have become increasingly valuable.
Industry observers expect executive compensation across AI firms to remain elevated as competition intensifies.
The Bigger Picture
Anthropic’s decision to offer a base salary reaching $600,000 for an investor relations executive sends a clear signal that preparations for public markets are accelerating.
Beyond the headline salary, the recruitment reflects a broader transformation within the AI industry. As companies mature from venture-backed startups into global technology leaders, success increasingly depends not only on breakthrough research but also on convincing investors that enormous AI investments can produce sustainable long-term returns.
If Anthropic proceeds with its widely anticipated IPO, this investor relations hire could become one of the most influential behind-the-scenes roles in shaping how one of the world’s most valuable AI companies is introduced to public investors.
Sources
- Business Insider, Anthropic is offering a $600,000 salary for one of its most important IPO hires: https://www.businessinsider.com/anthropic-ipo-hiring-investor-relations-director-2026-7
- Anthropic, Official Company Website: https://www.anthropic.com/
Discover more from The Economy
Subscribe to get the latest posts sent to your email.
Singapore is considering fresh tax incentives for hedge fund managers as it seeks to reinforce its position as Asia’s leading asset management hub amid an increasingly aggressive push by Hong Kong to attract global investment firms.
The discussions mark the latest chapter in an intensifying competition between Asia’s two premier financial centres, where governments are using tax policy, regulatory reforms, and business-friendly measures to win over international capital and top financial talent.
Singapore Examines New Incentives
According to recent reports, Singapore’s financial authorities have been consulting hedge funds and investment firms on possible measures to strengthen the country’s competitiveness.
Among the proposals under discussion are:
- Reducing tax rates applicable to eligible fund managers.
- Enhancing existing tax incentive schemes.
- Lowering operational costs for investment firms.
- Expanding incentives designed to attract new hedge funds to establish regional headquarters in Singapore.
While no final decision has been announced, the consultations suggest policymakers are carefully evaluating how to respond to shifting competitive pressures across Asia’s financial landscape.
Hong Kong Raises the Stakes
Singapore’s review comes only months after Hong Kong unveiled plans to broaden its own preferential tax regime for investment managers.
Hong Kong is seeking to extend tax benefits beyond traditional private equity structures, making zero-tax treatment on certain carried interest and investment profits available to a wider range of asset management activities.
The reforms are intended to encourage hedge funds, family offices and alternative investment firms to expand their operations in the city.
A Renewed Battle for Financial Leadership
For decades, Singapore and Hong Kong have competed for dominance as Asia’s gateway for global finance.
During the COVID-19 pandemic, Singapore gained momentum as several multinational firms relocated staff due to Hong Kong’s prolonged travel restrictions and political uncertainty.
Today, however, Hong Kong is mounting a determined comeback by introducing regulatory reforms and tax incentives aimed at reversing that trend.
Industry analysts say both cities now recognize that maintaining an attractive tax environment is essential in an industry where investment firms can relocate operations relatively quickly.
Why Hedge Funds Matter
Hedge funds contribute significantly beyond investment returns.
Their presence creates demand for:
- Investment banking services
- Legal and accounting firms
- Prime brokerage operations
- Technology providers
- Financial data companies
- Compliance specialists
The concentration of hedge funds also strengthens a city’s broader financial ecosystem, making it more attractive for institutional investors, sovereign wealth funds and family offices.
This explains why governments are increasingly willing to compete through targeted tax policies rather than broad corporate tax reductions.
Political and Fiscal Considerations
Although Singapore is widely regarded as one of the world’s most business-friendly economies, policymakers must balance competitiveness with domestic priorities.
Introducing additional tax breaks could face scrutiny at a time when residents remain sensitive to issues such as living costs and government spending.
As a result, analysts believe Singapore may opt for more targeted incentives, such as reducing compliance costs or refining existing tax schemes, instead of implementing sweeping tax cuts.
Industry Response
Investment professionals have welcomed the government’s willingness to engage with the sector.
Many argue that certainty, regulatory stability and efficient administration remain just as important as tax rates when deciding where to establish investment operations.
Some market participants also note that Singapore already enjoys advantages including political stability, strong rule of law, sophisticated financial infrastructure and an established ecosystem of global asset managers.
These strengths could help the city retain its leadership even if Hong Kong introduces more generous tax incentives.
Implications for Global Investors
The growing rivalry between Singapore and Hong Kong is expected to benefit global investors.
Competition between the two financial centres could lead to:
- Lower operating costs for investment firms.
- More attractive tax structures.
- Greater innovation in financial regulation.
- Increased investment flows into Asia.
- Expanded employment opportunities across financial services.
As institutional capital continues shifting toward Asian markets, both cities are positioning themselves as the preferred regional headquarters for international hedge funds and alternative asset managers.
Outlook
Singapore has not yet confirmed whether new tax measures will be implemented, but ongoing consultations indicate that policymakers are actively considering options.
The outcome could shape the competitive balance between Asia’s two largest international financial hubs for years to come.
With Hong Kong accelerating reforms and Singapore evaluating its response, the contest for global hedge fund capital is entering a new phase, one that is likely to influence investment decisions across the region and reinforce Asia’s growing importance in international finance.
Sources
- Financial Times. “Singapore weighs hedge fund tax cuts to rival Hong Kong.” https://www.ft.com/content/d3221c90-c2a4-4bdd-8e0d-6e069bf0ca25
- Reuters. “Hong Kong close to proposing tax cuts to lure asset and wealth managers.” https://www.reuters.com/world/asia-pacific/hong-kong-plans-tax-cuts-asset-managers-ft-reports-2026-03-26/
Discover more from The Economy
Subscribe to get the latest posts sent to your email.

Global Central Banks 2026: Fed, BoE and BoJ Decisions Could Reshape Markets

Gulf Capital Retreat From Pakistan 2026: UAE Loan Freeze & What It Means

Pakistan’s Most Reliable Export Is Its People: Remittances Hit $41.6 Billion, Overtaking Total Exports

Indonesia’s Confidence Problem: Record Investment, a Sinking Rupiah, and a Widening Credibility Gap

Down But Not Out: Inside the Slow Sinking of Russia’s War Economy

China’s Growth Slips to a Four-Year Low: Why Beijing Still Won’t Pull the Stimulus Trigger

The Johor-Singapore Corridor: How Malaysia Became Southeast Asia’s AI Infrastructure Powerhouse

Canada’s Economy ‘On Pause’: Inside the CUSMA Deadline That Passed Without a Deal

Dubai’s Millionaire Magnet: How the UAE Turned Middle East Turmoil Into a Capital Safe-Haven Boom

Britain’s Sixth Prime Minister in a Decade: What Starmer’s Exit Means for Gilts, Sterling and Your Portfolio

Anthropic Offers Up to $600,000 Salary for Critical IPO Role as AI Giant Prepares for Wall Street Debut

EU Readies Crisis Team for Potential China Rare Earths Stand-Off as Supply Chain Risks Mount

Singapore Weighs Hedge Fund Tax Cuts to Counter Hong Kong’s Growing Financial Challenge

Facebook and Instagram Experience Global Outage

Carry Trade Unwind 2026: How the Yen’s Snapback Triggered a Global Margin Call

AI Bubble Warning 2026: Why BIS, IMF and Bank of England Fear a Market Crash

BRICS De‑Dollarization Strategy Takes Shape with $15 Billion Local‑Currency Push

Male Labor Force Participation Rate 2026: Why Men Are Leaving & Economic Impact

The AI Super Bubble Is Ready to Burst

Russia Bans Diesel Exports 2026: Global Fuel Market Impact Explained

Strait of Hormuz Blockade 2026: Oil Prices Surge 9% as US-Iran Conflict Reignites

IMF Cuts Pakistan Growth Forecast, Raises Inflation to 8.4%

Private Credit Warning: Most BDCs Turn Unprofitable in 2026, Reuters Finds
Gulf Capital Retreat From Pakistan 2026: UAE Loan Freeze & What It Means

Bitcoin $150k Milestone Achieved as US Sovereign Crypto Pivot Looms

India Economic Rise 2026: How the Subcontinent Toppled Japan

Strait of Hormuz 2026: Why Markets Still Don’t Trust It’s Open

China Housing Market Turnaround: White‑List Model Stabilises Prices
-

 Markets & Finance7 months ago
Top 15 Stocks for Investment in 2026 in PSX: Your Complete Guide to Pakistan’s Best Investment Opportunities
-

 Analysis5 months ago
Johor’s Investment Boom: The Hidden Costs Behind Malaysia’s Most Ambitious Economic Surge
-

 Analysis5 months ago
Top 10 Stocks for Investment in PSX for Quick Returns in 2026
-

 Analysis6 months ago
Brazil’s Rare Earth Race: US, EU, and China Compete for Critical Minerals as Tensions Rise
-

 Banks6 months ago
Best Investments in Pakistan 2026: Top 10 Low-Price Shares and Long-Term Picks for the PSX
-

 Investment7 months ago
Top 10 Mutual Fund Managers in Pakistan for Investment in 2026: A Comprehensive Guide for Optimal Returns
-

 Global Economy7 months ago
15 Most Lucrative Sectors for Investment in Pakistan: A 2025 Data-Driven Analysis
-

 Global Economy7 months ago
Pakistan’s Export Goldmine: 10 Game-Changing Markets Where Pakistani Businesses Are Winning Big in 2025