
Markets & Finance
High-CPM Finance Niches 2026: Publisher Monetization Blueprint


The gap between the best- and worst-monetized content on the same platform, with the same traffic, is not a rounding error — it’s a 10x to 40x multiplier. A finance or insurance page earning $50–$80 RPM from 1,000 visitors sits next to an entertainment page earning $2–$5 from the identical traffic volume. For publishers building in wealth management, macroeconomics, and adjacent financial verticals, understanding — and deliberately engineering for — that gap is the single highest-leverage decision in the monetization stack.
The 2026 CPM Landscape, By Channel
| Channel | Finance-Niche CPM/RPM (2026) | Comparison Baseline |
|---|---|---|
| Display/AdSense (insurance) | $40–$80 RPM (US traffic) | Entertainment: $1–$4 RPM |
| Display/AdSense (finance, broad) | High-tier, comparable band | Recipe/cooking: $2–$5 RPM |
| YouTube (finance/credit cards) | $20–$50 CPM, $10–$25 RPM | Gaming/entertainment: $1–$8 CPM |
| Newsletter — Finance/Investing | $80–$180 CPM (direct), $30–$65 CPM (programmatic) | General-interest newsletters: materially lower |
| Newsletter — Legal | $55–$130 CPM | — |
| Newsletter — B2B SaaS | $50–$120 CPM | — |
The pattern holds across every channel: finance, insurance, legal, and B2B/SaaS content consistently occupies the top CPM tier, while entertainment, gossip, and general lifestyle content sits at the bottom, regardless of which ad platform or format is measured.
Why Financial Content Commands This Premium
Three structural factors explain the gap, and understanding them is what allows a publisher to deliberately position content to capture it rather than stumbling into it:
- High customer lifetime value on the advertiser side. Financial services, software, and B2B companies can justify significantly higher acquisition costs per click or impression because each converted customer is worth thousands of dollars in lifetime revenue — a fundamentally different unit economics than a consumer-goods or entertainment advertiser is working with.
- Purchase-intent signals embedded in the content itself. A reader consuming an article on “best high-yield savings accounts” or “how to open a Roth IRA” is, by definition, closer to a purchase decision than a reader consuming general entertainment content — and programmatic ad systems price that intent signal directly into the CPM.
- Affluent, professionally-engaged demographics. Content targeting professionals, business decision-makers, and active investors delivers an audience composition advertisers will pay a structural premium to reach, independent of the specific article topic.
Sub-Niche Stratification: Not All Finance Content Is Equal
The highest-leverage insight for publishers already operating in finance is that the finance vertical itself is not monolithic — sub-niche selection produces meaningful CPM variance:
- Specificity beats breadth. “Best credit cards for travel rewards 2026” attracts materially more advertiser competition than “general money tips” — the more precisely a piece of content maps to a specific purchase decision, the more advertisers bid to appear against it.
- Audience precision beats audience size. A newsletter serving 3,000 active options traders can command a higher CPM than a general personal-finance newsletter with 30,000 subscribers, because options-trading advertisers (brokerages, trading platforms, specialized data services) will pay a premium for a small, precisely-qualified audience over a large, diffuse one.
- High-value sub-niches within finance include independent registered investment advisors, high-net-worth investors, cryptocurrency traders, options traders, and real estate investors — each representing a distinct advertiser pool with its own premium pricing dynamics.
The Format and Length Lever
Content format materially affects realized CPM independent of topic:
- Longer-form content (8+ minutes on video; substantial word count on text) enables more ad placements per unit of content — on YouTube specifically, videos over 8–10 minutes qualify for mid-roll placements, and a 10-minute video can carry 3–4 mid-roll ad breaks versus a single pre-roll on shorter content.
- Short-form content dramatically underperforms in finance specifically. YouTube Shorts RPM in the finance niche runs 50–100x lower than long-form content — meaning a content strategy overly weighted toward short-form for audience-building purposes can actively suppress realized revenue if not balanced against long-form monetization content.
- This dynamic favors exactly the kind of deep, analytical, long-form content this publication produces — a genuine structural advantage for publishers investing in comprehensive rather than surface-level financial content.
Seasonal Timing: Q4 Concentration
Advertiser spending in financial verticals is not evenly distributed across the year:
- Q4 (October–December) represents the highest-CPM period, driven by advertiser budget cycles and year-end financial-decision content (tax planning, open enrollment, year-end investment moves).
- January consistently registers as the lowest-CPM month — publishers who concentrate their highest-effort content releases in Q1 rather than Q4 are systematically leaving realized revenue on the table.
- The optimal strategy publishes evergreen, audience-building content in Q1–Q3 while reserving peak-performing, highest-investment content for Q4 release, when the same traffic converts to meaningfully higher realized CPM.
E-E-A-T Signals for Financial Content Specifically
Google’s Experience, Expertise, Authoritativeness, and Trustworthiness framework carries outsized weight for financial content under the “Your Money or Your Life” (YMYL) content classification, which subjects financial publishing to stricter quality signals than general content categories:
- Author credentials and bylines matter more for financial content than almost any other vertical — content should be attributed to identifiable authors with relevant background, not published anonymously or under generic “Editorial Team” bylines where genuine expertise can be demonstrated.
- Sourcing to primary institutions — the IMF, World Bank, Federal Reserve, SEC, SSA — carries direct SEO and trust benefit for financial content specifically, both for search ranking and for advertiser brand-safety screening.
- Currency and update cadence matter disproportionately for financial content, since stale financial data (outdated interest rates, superseded tax brackets, old market data) both damages user trust and can trigger content-freshness penalties in search ranking.
Programmatic vs. Direct: The Allocation Decision
The newsletter-CPM data illustrates a broader principle applicable across channels: direct sponsorship deals consistently command 2–3x the CPM of programmatic fill in premium financial verticals ($80–$180 direct vs. $30–$65 programmatic for finance newsletters). The optimal monetization stack for a financial publisher therefore layers:
- Direct advertiser relationships for the highest-value inventory (top placements, dedicated sends, sponsored deep-dives), capturing the premium direct CPM.
- Programmatic/real-time bidding as a fill layer beneath direct sales, ensuring no inventory goes unmonetized while direct relationships are being built or between direct campaign flights.
- Affiliate and product-referral revenue stacked on top of ad revenue — particularly for content around specific financial products (credit cards, brokerages, savings accounts) where affiliate commissions can meaningfully exceed pure ad-impression revenue on high-intent content.
Finance and insurance content commands the highest CPMs of any digital publishing niche in 2026, with display RPMs of $40-80, YouTube CPMs of $20-50, and direct newsletter sponsorships reaching $80-180 CPM — a 10 to 40x premium over general-interest content, driven by high advertiser customer lifetime value and strong purchase-intent signals.”
Financial publishers who treat CPM optimization as a deliberate content-strategy input — not an afterthought handled purely by the ad-tech stack — can realistically capture a 10–40x revenue multiple over general-interest content with comparable traffic. The concrete levers are sub-niche specificity, long-form format (particularly given finance’s uniquely poor short-form monetization), Q4-weighted publishing calendars, direct-sales allocation for premium inventory, and E-E-A-T-aligned authorship and sourcing — all of which compound rather than operate independently.
Discover more from The Economy
Subscribe to get the latest posts sent to your email.


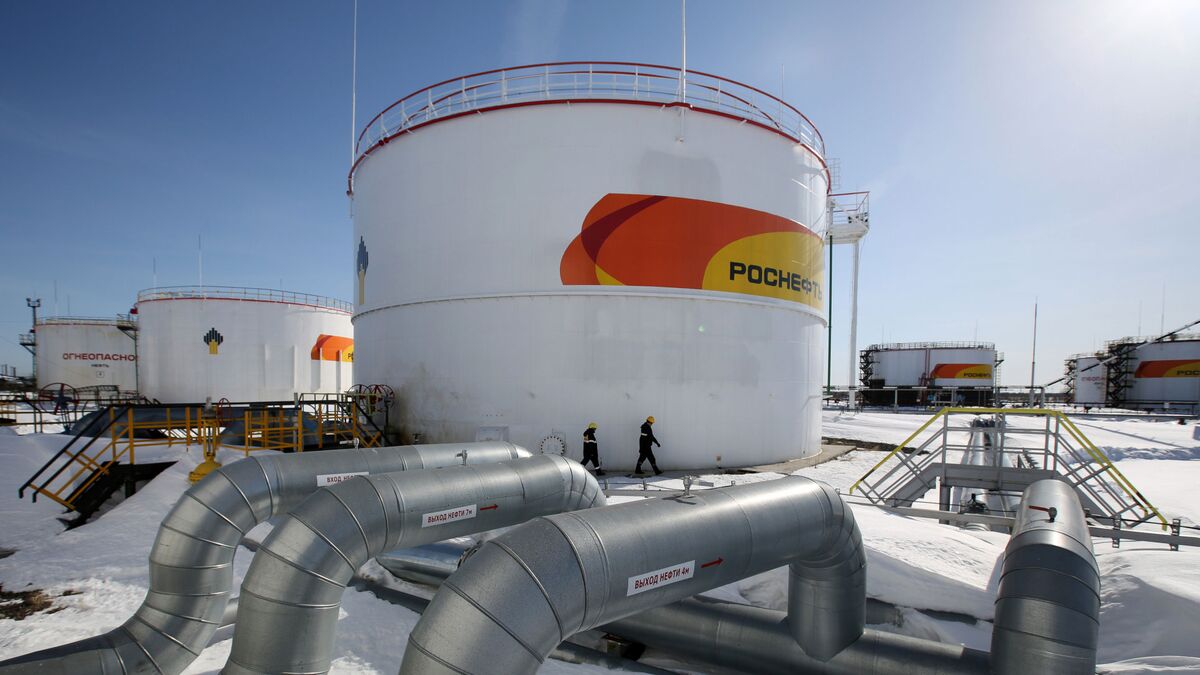
An unexpected shift in US sanctions policy has given Asian energy buyers a potentially important reprieve. It has also opened fresh questions about how importers should balance cheap fuel, diplomatic relationships and the risk that trading rules may change again.
On October 17, Reuters reported that President Donald Trump had issued an order waiving important Russia-related sanctions and tariffs before planned measures took effect. A subsequent Reuters account identified India as a significant beneficiary, given its role as a major Russian oil customer. The move reduces one category of immediate concern; it does not guarantee unlimited imports free of every restriction.
Why buyers in Asia care
Asia’s refineries compete for crude on price, quality, transport economics and availability. A sanction or tariff threat adds uncertainty to contracts even before it is implemented. Trading banks, insurers and shipowners may become more cautious; buyers may diversify supply or ask for discounts to compensate for risks.
A waiver can therefore matter before a single new tanker sails. It may improve the feasibility of existing contracts and ease pressure for rapid, expensive substitution. Still, the benefit depends on the precise terms of the waiver, the identity of the buyer and seller, the bank handling payment and the practical shipping route.
India is the immediate test case
India’s refining industry has cultivated access to discounted Russian crude, but its policymakers also value the trading relationship with Washington. The reported waiver potentially reduces friction between energy security and trade negotiations. Reuters’ October 19 analysis connected the decision to hopes for progress on a broader US–India trade deal.
Yet it would be a mistake to treat the waiver as permanent diplomatic alignment. Policy decisions may be reviewed, challenged or narrowed. India’s future purchases will still depend on relative crude prices and refinery requirements, not diplomatic headlines alone.
Why oil did not simply collapse
Market reports described some easing after the policy decision, but Middle East disruption and threats to physical energy infrastructure remained important. A Reuters oil-market report cautioned that implementation uncertainty limited confidence in sustained additional supply.
More Russian barrels accessible on paper may fail to solve problems caused by damaged refining equipment, disrupted shipping lanes or unusually tight diesel stocks elsewhere. Crude oil is also not a homogeneous product. Refineries are configured for specific blends; changing the input can increase costs or reduce efficiency.
Winners and losers are not obvious
| Stakeholder | Potential benefit | Important caveat |
|---|---|---|
| Indian refiners | Access to competitive crude | Compliance and financing |
| Other Asian importers | Some relief from global supply pressure | Eligibility differs by transaction |
| Tanker operators | More potential freight business | Insurance and security costs |
| Oil exporters competing with Russia | Demand can shift away | Overall prices and volumes still uncertain |
| Asian consumers | Possible easing in fuels | Taxes, FX and local distribution affect pump prices |
Smaller importers should not assume a waiver affecting one set of transactions automatically provides legal cover for every Russian energy purchase. Compliance teams must examine operative legal documents, not rely on a news summary as advice.
The geopolitical trade-off
Critics argue that relaxing pressure on Russia can weaken coercive leverage relating to the war in Ukraine. Supporters of relief emphasise the cost of energy scarcity and the need to stabilise prices. These perspectives reflect a genuine policy trade-off: reducing immediate energy stress may conflict with broader sanctions objectives.
A rigorous regional article should distinguish the economic effects of the waiver from an endorsement of its foreign-policy rationale. It should also avoid forecasting specific oil-price declines from a change whose practical effects are still being assessed.
What to watch in November
Importers and analysts should monitor official US rules, commercial purchase announcements, actual tanker arrivals, refinery throughput and the spread between competing crude grades. Other developments—including renewed conflict around Hormuz—could easily overwhelm the marginal supply effect of the waiver.
The paperwork behind a cheap barrel
A tanker purchase is not simply a quoted price multiplied by volume. The buyer must consider contract origin, payment route, shipping ownership, insurance, discharge location, refinery compatibility and applicable legal restrictions. Even when particular sanctions measures are waived, businesses should confirm whether related banking or export controls remain relevant to the proposed transaction.
The economic gain from a discounted crude grade also depends on refining yields. A barrel that produces a lower share of the products a refinery needs may be less valuable than a seemingly more expensive alternative. Freight routes, demurrage and quality specifications can erase an advertised discount. That is why refinery-level economics matter more than a headline claim that Russian oil is ‘cheap’.
Asian policymakers also need to distinguish short-term energy security from strategic dependence. Diversification across suppliers, fuels and transport routes generally provides resilience when a major trading partner or shipping corridor is disrupted. An importer that shifts too much procurement to one politically sensitive source may exchange today’s cheaper invoices for tomorrow’s concentrated risk.
A practical follow-up story should compare actual arrival data and refinery purchases after the waiver. Only then can readers distinguish a change in legal permission from a change in physical supply.
Are all Russian sanctions now removed?
No. Reporting describes waivers of specified measures. The exact surviving restrictions and compliance obligations must be checked against current official documents.
Will Indian petrol immediately become cheaper?
Not necessarily. Crude prices, refining margins, taxes and distribution costs intervene.
Does the waiver solve Asia’s energy security problem?
No. It can ease one bottleneck while leaving transport, geopolitical and market vulnerabilities intact.
For Asian buyers, the opportunity is flexibility—not certainty. The sensible response is to diversify procurement and understand the legal terms before betting a fuel strategy on a political announcement.
Discover more from The Economy
Subscribe to get the latest posts sent to your email.
Markets & Finance
Asia Markets Weekly: How Oil, US Yields and the Fed Reach Tokyo, Kuala Lumpur and Karachi

The global market’s biggest stories can look deceptively American: a Federal Reserve decision, a Treasury yield and a Wall Street earnings call. Yet the cost of these events is often felt most sharply across Asia, where energy import dependence, divergent monetary policies and unequal access to technology investment create different winners and losers.
The next scheduled Federal Reserve policy decision is October 28, according to its official calendar. The US 10-year Treasury yield was around 5.00% by October 23, down from higher levels earlier in the month. Oil was still elevated, while the IMF’s latest global outlook sees world growth slowing to 3.1% in 2026. These common shocks will not produce uniform Asian market returns.
Tokyo: currency moves complicate the equity story
Japan’s multinational exporters can be sensitive to yen movements because overseas revenue must be translated back into local currency, while domestic consumers and importers face different pressures when the yen weakens. The effect is not one-directional: a weaker currency may support export competitiveness but raise fuel and food import costs.
Investors should distinguish a broad index rally driven by a few large manufacturers or technology names from improving profits across the economy. Japanese government-bond yields and domestic monetary policy also matter. A US rate move may change yen-dollar incentives, but it does not dictate Japanese policy.
Kuala Lumpur: energy exposure is mixed
Malaysia’s place in the global energy system is different from that of a pure importer. Some businesses benefit from upstream prices, while manufacturers, transport operators and households can face higher costs. Currency and fiscal effects depend on domestic subsidy design, trade receipts and the balance between oil and gas revenues and imported refined products.
For equity investors, oil up should not be treated as a universal buy signal. Airlines, logistics companies, industrial users and energy-related firms can have opposing sensitivities. Malaysia’s electrical and electronics export exposure also links the country to the AI hardware cycle, but final demand and margins deserve scrutiny.
Karachi: the import bill dominates
Pakistan’s external vulnerability is sharper because energy prices can quickly affect dollar demand, local prices and business borrowing costs. The World Bank reported on October 22 that reforms and macro stabilisation had supported growth, but conflict-related pressures remained. Higher energy costs can erode these improvements even when the US equity market rises on technology earnings.
For the Pakistan Stock Exchange, sector analysis matters more than a generic Asian risk-on or risk-off label. Banks, energy firms, exporters, consumer businesses and highly leveraged industrial companies have distinct exposures to rates and exchange rates.
The regional transmission map
| Shock | Japan | Malaysia | Pakistan |
|---|---|---|---|
| US yields rise | Yen and valuation sensitivity | Funding costs, foreign flows | Dollar pressure and external borrowing context |
| Brent crude rises | Import cost pressure | Mixed effects across producers and users | Import bill, petrol and inflation pressure |
| AI investment accelerates | Capital goods and semiconductor ecosystem | Electronics supply chain opportunities | Selective digital services potential, energy constraints |
| Global demand softens | Exporters affected | Trade and tourism affected | Export and remittance channels |
These are transmission mechanisms, not guaranteed daily market movements. Political measures, domestic policies and company-specific developments can overwhelm them.
What to watch next week
The Fed’s statement and press conference will indicate how officials weigh inflation against growth. US technology earnings will test whether expensive AI infrastructure is translating into profitable demand. Oil-market shipping and security developments remain a separate source of risk that can upset even the strongest company results.
Investors should also check Asian market holidays, local economic releases and currency fixing times. Comparisons made across different trading-session cutoffs can create false narratives about which exchange responded first.
A sharper method than daily prediction
A regional investor can create a four-factor watchlist: oil, US yields, the dollar and domestic policy. For each market, identify companies with pricing power, foreign-currency debt, export income and energy-cost exposure. That framework is more durable than confident predictions about Monday’s opening index point.
How to read a cross-market comparison properly
A strong weekly comparison should fix each market’s closing date and reporting currency. If one exchange is closed for a holiday while another has traded through a major US event, their percentage changes cover different information sets. A reader can misinterpret this as one market being more resilient when the difference is mostly timing.
Currency conversion adds another complication. A stock index may gain in local currency but deliver a smaller return to an investor measuring wealth in dollars. This does not mean one series is incorrect; it means the investor’s benchmark is different. Analysts should label both local and dollar-adjusted comparisons and resist mixing them within a single ranking.
The regional supply-chain connection deserves the same precision. AI demand can benefit semiconductor and electrical-equipment producers, but the benefit is not evenly distributed across Tokyo and Kuala Lumpur, and it may have little immediate impact on a Pakistani small business facing higher power bills. A regional theme should identify channels rather than assume countries move together.
At the end of each weekly roundup, list the coming policy announcements and company results with local times. A reliable calendar may be more valuable to investors than an index-level prediction.
Will a Fed hike automatically trigger an Asian sell-off?
No. Expectations, positioning and the Fed’s message matter, alongside domestic fundamentals.
Which Asian markets benefit when oil rises?
The answer depends on the mix of producers, refiners, importers, subsidy arrangements and market valuations.
What is the most useful common comparison?
Compare earnings and cash-flow sensitivity to oil, currency and rates rather than comparing headline index changes alone.
The regional lesson: Asia is not one trade. From Tokyo to Kuala Lumpur to Karachi, the same global shock is filtered through a different currency, industrial structure and policy response.
Discover more from The Economy
Subscribe to get the latest posts sent to your email.

Gold’s biggest trap is its reputation. Investors often describe the metal as a haven that should rise whenever markets become nervous. Yet gold can fall during a risk-off episode when investors need cash, bond yields rise or expectations about inflation and the dollar change.
That contradiction was on display in late October. Reuters reported that spot gold slipped below $4,000 per troy ounce intraday on October 23, after trading above $4,100 earlier in the week. The widely circulated gold at $4,100+ framing is therefore outdated as a timeless present-tense headline.
How global gold turns into a Pakistan tola price
The basic translation is straightforward. One troy ounce is approximately 31.1035 grams, while one traditional tola is about 11.664 grams. For a benchmark theoretical price:
PKR per tola ≈ (international USD price per troy ounce × USD/PKR × 11.664) ÷ 31.1035.
For illustration only, at $4,000/oz and Rs280 per dollar, the raw 24-karat equivalent is approximately Rs420,000 per tola before local premiums, taxes, fabrication, dealer margins and price differences. This is not an assertion of today’s actual Pakistan bullion-market quotation. Buyers must confirm a live local quote with a reputable dealer and specify purity.
The formula also explains why a falling international gold price does not guarantee a lower Pakistan rate. If the rupee weakens sufficiently, the local-currency price may stay flat or rise. A jeweller’s making charges can further separate the price of a finished ornament from bullion value.
Why the metal is under pressure
Gold pays no interest. When US Treasury yields rise, some investors find interest-bearing assets more attractive relative to metal. A stronger dollar can also pressure dollar-priced bullion. But this is not an iron law: reserve diversification, central-bank purchases, geopolitical concern and inflation fear can support gold even when real yields are high.
The World Gold Council’s data hub is useful for historical gold-price reference, while the Federal Reserve’s September rate decision provides context for the interest-rate side of the equation. Investors should not rely on a single screenshot or quote that fails to specify time zone, spot versus futures and unit.
Buy, hold or wait: choose the question first
A wedding buyer with a near-term obligation does not face the same decision as a long-term investor. If the metal must be purchased for a known event, price risk can be managed by spreading purchases over scheduled intervals rather than hoping to identify the exact bottom. Such a schedule reduces timing concentration but does not eliminate loss risk.
An investor using gold for diversification should determine what share of overall assets it occupies, how easily it can be sold, whether storage and authenticity are manageable, and what would cause a rebalancing. A speculative trader needs a different discipline: clear position sizing, loss limits and an understanding that highly volatile intraday moves can defeat confident price targets.
Physical jewellery versus investment bullion
| Feature | Jewellery | Certified bars or coins |
|---|---|---|
| Purpose | Wearable and cultural | Primarily investment exposure |
| Extra charges | Often significant making costs | Premiums and dealer spreads |
| Purity | Varies; verify hallmark | Verify assay and certification |
| Resale | Making charges usually not recovered | Buy/sell spreads still apply |
| Security | Storage and theft concerns | Storage and theft concerns |
Ask for a written invoice showing metal weight, purity, current per-gram or per-tola pricing, making charges and buyback terms. The bid–ask spread matters. A dealer may advertise one number for selling to customers and quote a materially lower number when repurchasing.
Three drivers of the next move
US real interest rates: if inflation expectations and Treasury yields shift, gold’s opportunity cost changes. Central-bank and private demand: persistent accumulation can support the market, but it should be documented rather than assumed. Pakistan’s exchange rate: the domestic outcome may differ sharply from global dollar returns.
The IMF’s October world outlook warns of geopolitical and inflation risks. Those risks can make gold valuable as a diversifier without making it a guaranteed hedge at any entry price.
The difference between a gold quote and an investment return
An investor can buy a physical gold item at one price and discover that its instant resale value is lower because of the dealer’s spread and making charges. The spread may be particularly important during volatile trading or for small pieces of jewellery. Measuring performance from the purchase invoice to the international spot quote exaggerates gains if the actual available buyback price is lower.
Purity is equally important. A 22-karat item contains less pure gold by weight than a 24-karat bar, while gemstones and decorative components make gross jewellery weight a misleading basis for a bullion valuation. A reliable invoice should record the relevant metal weight, fineness and separate charges. For inherited jewellery, an independent assay may be necessary before using a headline market rate to estimate value.
Gold also has portfolio opportunity costs. Cash and bonds may pay income; gold does not. That does not make either universally superior. It means a buyer should specify whether the objective is a cultural purchase, a short-term trade, inflation diversification or a long-term store of value. Each calls for a different view of transaction costs and holding period.
A disciplined buyer can document the dealer’s selling rate and repurchase policy on the same day. That small step often provides more useful information than another bold forecast of where the metal will trade next month.
Is the gold rate in Pakistan the international dollar price multiplied by USD/PKR?
Not exactly. You must convert the unit into tolas or grams and account for local premiums, taxes and trading spreads.
Is 22-karat jewellery worth the 24-karat rate?
No. Gold content differs. Check actual purity and weight, plus any stones or charges that complicate resale.
Could gold revisit its earlier highs?
Yes, but it could also fall further. An investment plan should consider both possibilities without assigning a fabricated probability.
Bottom line: a better decision begins with the purpose of the purchase, the correct unit conversion and a known exit cost. A price target is less useful than understanding what you actually own.
Discover more from The Economy
Subscribe to get the latest posts sent to your email.

Russia Sanctions Waiver: What Asian Oil Buyers Gain

Asia Markets Weekly: How Oil, US Yields and the Fed Reach Tokyo, Kuala Lumpur and Karachi

Gold Near $4,000: Buy, Hold or Wait? A Pakistan Tola Price Guide

US 10-Year Treasury Yield Near 5%: The Hidden Cost for Pakistani Investors

Fed Meeting on October 28: Hike or Hold—and Why Pakistan Investors Should Care

Can Pakistan Turn US–Iran Mediation Into an Economic Dividend?

Oil Above $100: How Higher Crude Prices Reach Pakistan’s Rupee, Petrol and Imports

SBP Interest Rate at 11.5%: What Will Decide Pakistan’s Next Policy Move?

The Global South: Debt, Climate Finance and Investment in 2026

Energy Security Is the New Economic Security

Can Global Tourism Survive Geopolitical Shocks?

Global Maritime Hegemony: How China Secured Over 81% of All New Shipbuilding Orders

The Coming Battle Over AI, Jobs and Wages

Why Developing Economies Face a Sharper Inflation Problem

Crude Oil & Petroleum Market Analysis: OPEC+ Decisions and Price Forecasts

Silver Price Today: Why the Xi-Trump AI Standoff Is Fueling a Safe-Haven Rally

Algorithmic Dogfights: Why the U.S. and China Must Establish Rules of Engagement for Autonomous Air Power

Top US Convenience Store Chains: Store Counts, EV Charging, and Sales Trends

Who Is Shivon Zilis? The Neuralink Executive at the Center of the Musk–OpenAI Trial

Social Security Extra $90 Deposit: Who Qualifies for the October 2026 Medicare Rebate?

Corporate America Faces a New Debt Test as US Borrowing Costs Surge

Global Economic Outlook 2026: 7 Forces Reshaping Markets, Trade and Business

Gold Falls 3.7% as Yields Surge: Is Gold Still a Safe Haven in 2026?

Stock Market Today: Dow, S&P 500, and Nasdaq Retreat as Treasury Yields

MAS Allocates S$1.45 Billion to Five Asset Managers in Third EQDP Batch: Total Deployment Reaches S$5.4 Billion

Anthropic Bans Sustained Abuse of Claude AI Under New Usage Policy Effective November 12, 2026

Gold Price Outlook 2026: The Forces Behind the Forecasts—and What Could Reverse Them

US 10-Year Yield Hits 5.24%: What the Historic Bond Market Sell off Means for Mortgages and Investors
-

 Markets & Finance10 months ago
Top 15 Stocks for Investment in 2026 in PSX: Your Complete Guide to Pakistan’s Best Investment Opportunities
-

 Analysis8 months ago
Johor’s Investment Boom: The Hidden Costs Behind Malaysia’s Most Ambitious Economic Surge
-

 Analysis8 months ago
Top 10 Stocks for Investment in PSX for Quick Returns in 2026
-

 Banks9 months ago
Best Investments in Pakistan 2026: Top 10 Low-Price Shares and Long-Term Picks for the PSX
-

 Analysis9 months ago
Brazil’s Rare Earth Race: US, EU, and China Compete for Critical Minerals as Tensions Rise
-

 Investment10 months ago
Top 10 Mutual Fund Managers in Pakistan for Investment in 2026: A Comprehensive Guide for Optimal Returns
-

 Global Economy10 months ago
15 Most Lucrative Sectors for Investment in Pakistan: A 2025 Data-Driven Analysis
-

 Global Economy10 months ago
Pakistan’s Export Goldmine: 10 Game-Changing Markets Where Pakistani Businesses Are Winning Big in 2025