
Global Trade
Digitally Deliverable Services: 56% of Global Trade in 2026


Global trade policy debates in 2026 remain heavily focused on tariffs, container shipments, and factory reshoring — the visible, physical mechanics of international commerce. Beneath that debate, a quieter and arguably more consequential shift has already occurred: services that can be delivered remotely over computer networks — everything from IT consulting and financial services to creative and professional work — now account for 56% of all global services exports, according to UN Trade and Development (UNCTAD) data for 2024. For global business strategy, trade policy, and cross-border investment planning, this is no longer an emerging trend to monitor. It is the dominant structural fact of modern services trade.
Key Takeaways
- Digitally deliverable services accounted for 56% of all global services exports in 2024, per UNCTAD, up from a much smaller base a decade earlier — a share that has grown consistently over most of the last ten years.
- Global exports of digitally deliverable products rose 10% in 2025, continuing a similarly strong pace from the prior year, with developed economies exporting roughly $4.1 trillion and developing economies exporting an estimated $1.3 trillion.
- Developing economies’ exports of digitally deliverable services grew 12% in 2025, outpacing developed economies’ 9% growth — even as developing economies crossed the $1 trillion export threshold in this category for the first time in 2023.
- In Least Developed Countries (LDCs), digitally deliverable services represent just 16-20% of services exports — roughly a third of the global average — highlighting a widening digital trade divide even as the category grows globally.
- The WTO forecasts overall services trade growth slowing to 4.4% in 2026 (down from 6.8% in 2024), even as digitally delivered services growth remains comparatively resilient at 5.6%, reinforcing the category’s role as the more durable engine of services trade growth.
What “Digitally Deliverable” Actually Means
The 56% figure requires a precise definition to be useful for strategic planning. UNCTAD and the WTO define digitally deliverable services as those services that can be delivered remotely over information and communications technology (ICT) networks such as the internet — a category distinct from, though closely related to, the narrower measure of services actually delivered digitally in a given transaction. The digitally deliverable category encompasses ICT services themselves, along with sales and marketing services, financial services, professional and technical services, insurance services, intellectual-property-related services, and education and training services, among others.
This matters for trade strategy because it captures structural potential for remote delivery across an entire services category, not merely transactions that happened to occur digitally in a given year — making it a more forward-looking indicator of which service sectors are positioned to continue shifting toward borderless, low-marginal-cost delivery models.
The Ten-Year Trend: A Structural, Not Cyclical, Shift
The growth in digitally deliverable services’ share of total services trade has been remarkably consistent rather than a pandemic-era anomaly. While the COVID-19 pandemic did produce a temporary spike — with some measures of digitally delivered services trade briefly exceeding 60% of total services trade in 2020 — the subsequent partial normalization in 2021 and 2022 did not erase the underlying structural trend. By 2024, the 56% figure represented a continuation of growth that has been sustained over most of the past decade, with the strongest regional gains recorded in Asia (a 7.9 percentage point increase in the digitally deliverable share of total services exports over ten years) and North America (7.6 percentage points over the same period).
Global exports of digitally deliverable products continued this trajectory into 2025, rising approximately 10% year-on-year — matching the prior year’s growth rate and confirming this is a sustained trend rather than a one-time post-pandemic adjustment.
The Developed-Developing Divide: Converging, But Unevenly
The distribution of digitally deliverable services trade in 2025 illustrates both genuine progress and a persistent structural gap. Developed economies accounted for roughly three-quarters of digitally deliverable exports in 2025, worth approximately $4.1 trillion, while developing economies exported an estimated $1.3 trillion — a meaningful and growing share, but still a fraction of the developed-economy total. Developing economies’ growth rate in this category (12% in 2025) outpaced developed economies (9%), suggesting a genuine, if gradual, convergence trend.
However, this aggregate convergence masks a widening gap within the developing world. The distance between a relatively small number of highly successful developing-economy exporters and the much larger group of countries struggling to build export share in this category has widened, not narrowed, even as the overall developing-economy total has grown. Least Developed Countries illustrate this divide most starkly: digitally deliverable services represent only 16-20% of their total services exports — roughly a third of the 56% global average — and LDCs’ share of global digitally deliverable services exports has actually declined from 0.24% to 0.19% over the 2015-2023 period, despite a 43% increase in the absolute value of their exports in this category over the same window. UNCTAD’s own assessment is direct on this point: without targeted intervention, the digital economy risks entrenching existing global trade inequalities rather than alleviating them.
Sector Composition: Where the Value Concentrates
Within digitally deliverable services trade, value is heavily concentrated in a handful of sub-sectors. Computer services and financial services together represent the largest components of digitally delivered trade specifically, with other business services (encompassing diverse professional, management, and technical services) forming a substantial share of the “Other commercial services” category that dominates global services trade composition more broadly — that broader category accounted for roughly 60% of total global services trade in 2024, with Europe alone contributing about 40% of those exports.
Regional trade-flow patterns within this category also reveal distinct structural differences: European digitally deliverable service exports are heavily intra-regional, with 62% of exports remaining within the region, while North America is overwhelmingly externally oriented, exporting 82% of its digitally deliverable services outside the region — a divergence with direct implications for how trade policy shifts in one bloc ripple into the other.
Why This Matters for 2026 Trade Policy and Business Strategy
The WTO’s 2026 outlook for overall commercial services trade shows deceleration — growth is projected to slow to roughly 4.4%, down sharply from 6.8% in 2024, driven primarily by weaker transport services growth (a direct casualty of the broader merchandise trade slowdown linked to elevated 2026 tariff activity) and softer travel growth. Digitally delivered services, by contrast, are forecast to grow at a comparatively resilient 5.6% in 2026 — meaningfully outpacing the broader services trade average and reinforcing the category’s role as the more durable growth engine within global services trade during a period of broader trade policy uncertainty.
This resilience has a structural explanation directly relevant to 2026’s tariff environment: digitally deliverable services are not directly subject to tariffs in the way merchandise trade is, though they remain vulnerable to indirect spillover effects through their links to goods trade and broader economic output. For businesses and policymakers navigating an increasingly tariff-affected trade environment, this relative insulation is a meaningful strategic consideration — a services-export strategy weighted toward digitally deliverable categories carries structurally different tariff exposure than a goods-export strategy.
Strategic Implications by Stakeholder
- For exporters in developing and emerging markets: The 12% growth rate in digitally deliverable services exports from developing economies in 2025 suggests genuine, executable opportunity — but the widening gap between top-performing and struggling exporters within the developing world means market access, digital infrastructure investment, and skills development remain binding constraints rather than solved problems.
- For multinational trade and tax strategy teams: The sharp divergence in regional trade orientation (Europe’s 62% intra-regional share versus North America’s 82% extra-regional share) should directly inform where digitally deliverable service lines are structured and where cross-border service agreements are domiciled.
- For trade policymakers, including in Pakistan and similar emerging markets: The LDC data point — a declining global export share despite rising absolute export value — is a cautionary signal that digital services export growth alone does not guarantee improved relative competitive position without deliberate, targeted digital trade infrastructure investment.
- For portfolio and country-risk analysts: Given digitally deliverable services’ comparative tariff insulation and stronger 2026 growth forecast relative to transport and travel services, economies with services-export mixes weighted toward this category may exhibit somewhat greater resilience to an escalating tariff environment than goods-export-dependent economies.
Frequently Asked Questions
What percentage of global trade is digitally deliverable services?
Digitally deliverable services accounted for 56% of all global services exports in 2024, according to UNCTAD — a share that has grown consistently over the past decade and continued rising into 2025 with roughly 10% annual export growth.
Are digitally deliverable services affected by tariffs?
Not directly — digitally deliverable services are not subject to tariffs in the same way goods are, though they remain vulnerable to indirect spillover effects from broader merchandise trade slowdowns and economic uncertainty linked to tariff activity.
Is the digital services trade gap between rich and poor countries closing?
Only partially. Developing economies grew digitally deliverable services exports faster than developed economies in 2025 (12% versus 9%), but Least Developed Countries’ share of global digitally deliverable exports actually declined from 2015 to 2023, despite rising absolute export values.
Conclusion
The 56% figure represents one of the more consequential, if underdiscussed, structural facts in global trade today: more than half of all services traded internationally can now be delivered without a ship, a truck, or a border crossing in the traditional sense. For businesses and policymakers focused on 2026’s tariff-dominated trade headlines, the digitally deliverable services trend offers both a note of resilience — a growth engine comparatively insulated from tariff policy — and a note of caution, as the data makes clear that this resilience and growth are not being distributed evenly across the global economy.
Discover more from The Economy
Subscribe to get the latest posts sent to your email.


The WTO sees expanding goods trade but an uneven recovery in services. Pakistan needs to distinguish rising global transaction volumes from guaranteed demand for its own export mix. This feature explains the mechanisms, risks and practical decisions that matter through 2027, with particular attention to Pakistan’s different exposure to energy prices, external financing, global trade and AI investment.
At a glance
- World output is forecast to rise, but opportunities and costs are uneven across countries.
- Global inflation forecasts do not predict household prices in Pakistan.
- The AI capital expenditure cycle lifts trade in electronics but may not translate into productivity gains everywhere.
- Pakistan’s IMF staff-level agreement is a milestone, not final Board approval.
- Stronger exports, competitive energy, fiscal credibility and skills are essential to durable growth.
The verified starting point: what the numbers actually say
The IMF October 2026 World Economic Outlook projects global growth of 3.1% in calendar 2026 and 3.4% in calendar 2027, alongside global headline inflation of 4.7% and 4.1%, respectively. Its statistical cutoff is 1 October 2026. The WTO October 2026 trade outlook projects merchandise trade volume growth of 3.9% in 2026 and 4.1% in 2027, versus commercial-services trade volume growth of 3.3% and 6.4%. These are forecasts from different statistical systems, not interchangeable growth measures.
For Pakistan, the IMF Pakistan October 7 staff-level agreement estimated FY2026 growth of 3.6%, September headline inflation of approximately 10.3%, and gross reserves near $21.5 billion at end-September. The fourth EFF review and third RSF review had reached staff-level agreement only, pending IMF Executive Board approval as of the release. Pakistan’s fiscal years run July–June; IMF global growth figures refer to calendar years.
| Indicator | 2026 | 2027 | Important distinction |
|---|---|---|---|
| IMF world GDP growth | 3.1% | 3.4% | Calendar-year projection |
| IMF world headline inflation | 4.7% | 4.1% | Global estimate, not Pakistan CPI |
| WTO goods trade volume growth | 3.9% | 4.1% | Real volume, not nominal trade value |
| WTO commercial services volume growth | 3.3% | 6.4% | Conditional rebound, not guaranteed |
The World Bank June 2026 Global Economic Prospects provides an earlier comparison framework, but its publication date and methodology differ from the October IMF and WTO releases. A thoughtful analysis should compare like with like and should never treat projections as realized outcomes. For a Pakistan-focused story, the crucial question is how global conditions enter domestic economic life.
Why this story matters now
The WTO October 2026 executive summary says AI-enabling goods accounted for 47% of year-on-year growth in the value of world merchandise trade during the first half of 2026. That does not mean 47% of all merchandise trade was AI-related. It identifies a contribution to growth, and in nominal value terms. The same source notes that AI-enabling goods trade rose 67% year-on-year in that period. These figures show how a narrow technology cycle can make global trade appear stronger even as other sectors struggle.
Meanwhile the Reuters October 2026 IMF annual meetings reports persistent concern about global financial risks, geopolitical disruptions and the uneven sharing of AI gains. The Reuters October 2026 Asian growth describes a region where technology investment supports some exporters while energy costs and higher yields challenge others. Pakistan is therefore exposed simultaneously to a potential technology opportunity and to more conventional fuel, financing and trade vulnerabilities.
Why the WTO raised its goods forecast
For why the wto raised its goods forecast, Trade resilience is not evenly shared. Diversion can reward suppliers with dependable shipping, certifications and capacity, while uncompetitive producers may see no benefit at all. The relevance of a global rebound depends on what a country makes and whether buyers can switch suppliers.
This matters for economic decision-making because firms and households cannot adjust instantaneously when conditions shift. Prices, contracts, worker skills and financial obligations move on different schedules. Analysts should identify the timetable, who bears the immediate cost, and who may capture the longer-term benefit.
A credible implementation plan requires named institutions, measurable indicators and regular public reporting. The point is not to promise an effortless transition; it is to make policy options concrete enough to compare their benefits and trade-offs.
Pakistan-specific decision test. For why the wto raised its goods forecast, ask four questions: (1) Which import cost, export opportunity, credit channel or productivity constraint is affected? (2) Which groups face the first-round effects? (3) What could policymakers or firms change within six months? (4) Which published indicator would demonstrate improvement rather than merely announce activity?
What to monitor: (i) official monthly or quarterly data; (ii) movements in export receipts and import bills; (iii) price changes versus changes in physical volumes; (iv) borrowing and working-capital costs; and (v) job quality and household purchasing power. A single monthly reading can be noisy. Comparing several releases helps distinguish a trend from a short-lived disturbance.
Services are a different story
For services are a different story, Pakistan must distinguish nominal export revenue, which can rise because of price changes, from real production volume and domestic value added. A stronger textile invoice is less meaningful if expensive imported energy and materials absorb the gain.
This matters for economic decision-making because firms and households cannot adjust instantaneously when conditions shift. Prices, contracts, worker skills and financial obligations move on different schedules. Analysts should identify the timetable, who bears the immediate cost, and who may capture the longer-term benefit.
A credible implementation plan requires named institutions, measurable indicators and regular public reporting. The point is not to promise an effortless transition; it is to make policy options concrete enough to compare their benefits and trade-offs.
Pakistan-specific decision test. For services are a different story, ask four questions: (1) Which import cost, export opportunity, credit channel or productivity constraint is affected? (2) Which groups face the first-round effects? (3) What could policymakers or firms change within six months? (4) Which published indicator would demonstrate improvement rather than merely announce activity?
What to monitor: (i) official monthly or quarterly data; (ii) movements in export receipts and import bills; (iii) price changes versus changes in physical volumes; (iv) borrowing and working-capital costs; and (v) job quality and household purchasing power. A single monthly reading can be noisy. Comparing several releases helps distinguish a trend from a short-lived disturbance.
Trade diversion versus real competitiveness
For trade diversion versus real competitiveness, Frequent data on delivery times, rejected shipments and repeat orders can help policymakers determine whether export incentives translate into durable commercial relationships rather than short-lived volume spikes.
This matters for economic decision-making because firms and households cannot adjust instantaneously when conditions shift. Prices, contracts, worker skills and financial obligations move on different schedules. Analysts should identify the timetable, who bears the immediate cost, and who may capture the longer-term benefit.
A credible implementation plan requires named institutions, measurable indicators and regular public reporting. The point is not to promise an effortless transition; it is to make policy options concrete enough to compare their benefits and trade-offs.
Pakistan-specific decision test. For trade diversion versus real competitiveness, ask four questions: (1) Which import cost, export opportunity, credit channel or productivity constraint is affected? (2) Which groups face the first-round effects? (3) What could policymakers or firms change within six months? (4) Which published indicator would demonstrate improvement rather than merely announce activity?
What to monitor: (i) official monthly or quarterly data; (ii) movements in export receipts and import bills; (iii) price changes versus changes in physical volumes; (iv) borrowing and working-capital costs; and (v) job quality and household purchasing power. A single monthly reading can be noisy. Comparing several releases helps distinguish a trend from a short-lived disturbance.
Tariffs and the limits of headline access
For tariffs and the limits of headline access, Trade resilience is not evenly shared. Diversion can reward suppliers with dependable shipping, certifications and capacity, while uncompetitive producers may see no benefit at all. The relevance of a global rebound depends on what a country makes and whether buyers can switch suppliers.
This matters for economic decision-making because firms and households cannot adjust instantaneously when conditions shift. Prices, contracts, worker skills and financial obligations move on different schedules. Analysts should identify the timetable, who bears the immediate cost, and who may capture the longer-term benefit.
A credible implementation plan requires named institutions, measurable indicators and regular public reporting. The point is not to promise an effortless transition; it is to make policy options concrete enough to compare their benefits and trade-offs.
Pakistan-specific decision test. For tariffs and the limits of headline access, ask four questions: (1) Which import cost, export opportunity, credit channel or productivity constraint is affected? (2) Which groups face the first-round effects? (3) What could policymakers or firms change within six months? (4) Which published indicator would demonstrate improvement rather than merely announce activity?
What to monitor: (i) official monthly or quarterly data; (ii) movements in export receipts and import bills; (iii) price changes versus changes in physical volumes; (iv) borrowing and working-capital costs; and (v) job quality and household purchasing power. A single monthly reading can be noisy. Comparing several releases helps distinguish a trend from a short-lived disturbance.
Trade reform priorities through 2027
For trade reform priorities through 2027, Pakistan must distinguish nominal export revenue, which can rise because of price changes, from real production volume and domestic value added. A stronger textile invoice is less meaningful if expensive imported energy and materials absorb the gain.
This matters for economic decision-making because firms and households cannot adjust instantaneously when conditions shift. Prices, contracts, worker skills and financial obligations move on different schedules. Analysts should identify the timetable, who bears the immediate cost, and who may capture the longer-term benefit.
A credible implementation plan requires named institutions, measurable indicators and regular public reporting. The point is not to promise an effortless transition; it is to make policy options concrete enough to compare their benefits and trade-offs.
Pakistan-specific decision test. For trade reform priorities through 2027, ask four questions: (1) Which import cost, export opportunity, credit channel or productivity constraint is affected? (2) Which groups face the first-round effects? (3) What could policymakers or firms change within six months? (4) Which published indicator would demonstrate improvement rather than merely announce activity?
What to monitor: (i) official monthly or quarterly data; (ii) movements in export receipts and import bills; (iii) price changes versus changes in physical volumes; (iv) borrowing and working-capital costs; and (v) job quality and household purchasing power. A single monthly reading can be noisy. Comparing several releases helps distinguish a trend from a short-lived disturbance.
Policy options: three alternative paths, not numerical forecasts
| Scenario | Assumptions | Implications for Pakistan | Early warning or confirmation |
|---|---|---|---|
| More favorable | Energy costs stabilize; export markets remain open; AI use generates measurable efficiency | Space for investment, steadier purchasing power and stronger services exports | Export orders, real income and private investment improve together |
| Central case | Global growth follows the broad institutional outlook; commodity and funding pressures fluctuate | Gradual recovery with uneven gains across sectors | Stable external balances without a broad productivity surge |
| Adverse | Energy disruptions persist; financing costs rise; AI investment is repriced | Imports become more costly, credit tighter and fiscal choices harder | Reserves, inflation expectations and financing costs weaken at once |
These are qualitative editorial scenarios, not probabilities assigned by an econometric model. Their value lies in clarifying which evidence would require an updated judgment. The IMF October 2026 World Economic Outlook explicitly emphasizes downside risks involving conflict, trade tension, debt and reassessment of AI expectations.
A practical action agenda
For policymakers, the first responsibility is to protect hard-won macroeconomic stability while removing barriers to productivity. Regulatory predictability, tax administration, targeted social protection and transparent energy decisions are more useful than shifting incentives that are impossible for businesses to plan around. The IMF Pakistan 2026 country report identifies revenue mobilization, reform of state enterprises, energy-sector viability and improvements in human capital as linked policy priorities.
For exporters, resilience means identifying where demand is growing, investing in reliable delivery and obtaining credible certifications. Export strategies should track volumes, domestic value added and customer retention; gross receipts alone do not disclose profitability. For small businesses, the practical priority is to map exposure to fuel, electricity, imports and foreign-exchange requirements and to stress-test cash flows before making expansion commitments.
For households, risk management begins with an affordable budget, attention to debt servicing and a realistic distinction between nominal wage gains and purchasing power. For workers, portable skills and credible training can expand options across changing industries. None of this makes external shocks harmless; it simply offers concrete ways to be less exposed.
How this analysis differs from generic global coverage
Major international reporting is indispensable for establishing what happened. The Reuters October 2026 WTO briefing emphasizes the boost from AI to merchandise trade and the pressure of geopolitical disruption. Institutional releases provide detailed projections. This article goes a step further by asking how those macroeconomic signals might translate into local import costs, export competitiveness, employment, household budgets and reform choices. It is an interpretation of attributed evidence, not a claim of exclusive interviews or original field reporting.
The difference is particularly relevant for Pakistan because a global technology boom may coincide with higher costs for countries that import fuel but do not manufacture the equipment in highest demand. No serious strategy should assume that a worldwide headline rate automatically delivers the same benefits locally.
Frequently asked questions
What is the IMF’s global growth forecast for 2027?
The IMF’s October 2026 World Economic Outlook projects 3.4% global GDP growth in 2027, following 3.1% in 2026. These are calendar-year forecasts and may be revised as new data becomes available. See the IMF October 2026 World Economic Outlook.
Is global inflation expected to fall in 2027?
Yes, the October IMF forecast projects global headline inflation easing from 4.7% in 2026 to 4.1% in 2027. That describes the world aggregate and does not imply that prices in Pakistan will fall in absolute terms.
Is Pakistan’s latest IMF financing already approved?
The 7 October 2026 IMF release announced staff-level agreement for the fourth EFF and third RSF reviews, subject to Executive Board approval. The release should not be described as a completed Board decision. See the IMF Pakistan October 7 staff-level agreement.
Will AI investment create jobs in Pakistan?
It could create demand for implementation, software services and specialist support, while also changing tasks in existing occupations. The result depends on skills, investment, electricity reliability and competitive access to customers. No credible source guarantees a particular employment gain.
Does the WTO predict rapid growth in all kinds of trade?
No. Its October outlook differentiates merchandise volume growth from commercial-services volume growth and notes uneven performance by sector and region. Read the WTO October 2026 executive summary.
What should Pakistani companies monitor through 2027?
Export order books, input costs, electricity reliability, financing terms, exchange-rate conditions and customer demand are more operationally useful than a single global growth figure. Businesses should compare these against their own cash flows and margins.
Conclusion: the decisive issue is transmission, not the headline
The WTO sees expanding goods trade but an uneven recovery in services. Pakistan needs to distinguish rising global transaction volumes from guaranteed demand for its own export mix. The balance of risks is mixed: advanced technology can expand world production and trade, but it does not neutralize an energy shock or a financing squeeze. For Pakistan, policy credibility, internationally competitive exports and productivity-enhancing investment will determine how much of a fragile global expansion becomes better living standards at home.
Discover more from The Economy
Subscribe to get the latest posts sent to your email.
Global growth is not the same as broad prosperity. Pakistan’s outcomes will depend less on the global average than on the channels through which external demand, energy, financing, and technology influence local firms. This feature explains the mechanisms, risks and practical decisions that matter through 2027, with particular attention to Pakistan’s different exposure to energy prices, external financing, global trade and AI investment.
At a glance
- World output is forecast to rise, but opportunities and costs are uneven across countries.
- Global inflation forecasts do not predict household prices in Pakistan.
- The AI capital expenditure cycle lifts trade in electronics but may not translate into productivity gains everywhere.
- Pakistan’s IMF staff-level agreement is a milestone, not final Board approval.
- Stronger exports, competitive energy, fiscal credibility and skills are essential to durable growth.
The verified starting point: what the numbers actually say
The IMF October 2026 World Economic Outlook projects global growth of 3.1% in calendar 2026 and 3.4% in calendar 2027, alongside global headline inflation of 4.7% and 4.1%, respectively. Its statistical cutoff is 1 October 2026. The WTO October 2026 trade outlook projects merchandise trade volume growth of 3.9% in 2026 and 4.1% in 2027, versus commercial-services trade volume growth of 3.3% and 6.4%. These are forecasts from different statistical systems, not interchangeable growth measures.
For Pakistan, the IMF Pakistan October 7 staff-level agreement estimated FY2026 growth of 3.6%, September headline inflation of approximately 10.3%, and gross reserves near $21.5 billion at end-September. The fourth EFF review and third RSF review had reached staff-level agreement only, pending IMF Executive Board approval as of the release. Pakistan’s fiscal years run July–June; IMF global growth figures refer to calendar years.
| Indicator | 2026 | 2027 | Important distinction |
|---|---|---|---|
| IMF world GDP growth | 3.1% | 3.4% | Calendar-year projection |
| IMF world headline inflation | 4.7% | 4.1% | Global estimate, not Pakistan CPI |
| WTO goods trade volume growth | 3.9% | 4.1% | Real volume, not nominal trade value |
| WTO commercial services volume growth | 3.3% | 6.4% | Conditional rebound, not guaranteed |
The World Bank June 2026 Global Economic Prospects provides an earlier comparison framework, but its publication date and methodology differ from the October IMF and WTO releases. A thoughtful analysis should compare like with like and should never treat projections as realized outcomes. For a Pakistan-focused story, the crucial question is how global conditions enter domestic economic life.
Why this story matters now
The WTO October 2026 executive summary says AI-enabling goods accounted for 47% of year-on-year growth in the value of world merchandise trade during the first half of 2026. That does not mean 47% of all merchandise trade was AI-related. It identifies a contribution to growth, and in nominal value terms. The same source notes that AI-enabling goods trade rose 67% year-on-year in that period. These figures show how a narrow technology cycle can make global trade appear stronger even as other sectors struggle.
Meanwhile the Reuters October 2026 IMF annual meetings reports persistent concern about global financial risks, geopolitical disruptions and the uneven sharing of AI gains. The Reuters October 2026 Asian growth describes a region where technology investment supports some exporters while energy costs and higher yields challenge others. Pakistan is therefore exposed simultaneously to a potential technology opportunity and to more conventional fuel, financing and trade vulnerabilities.
Why the headline growth rate hides divergence
For why the headline growth rate hides divergence, Growth averages blur distribution. A country manufacturing sought-after electronics can gain from a technology upcycle while an energy importer faces a larger fuel invoice. That contrast explains why Pakistan needs an exposure-weighted reading of international forecasts rather than simply celebrating a higher headline GDP projection.
This matters for economic decision-making because firms and households cannot adjust instantaneously when conditions shift. Prices, contracts, worker skills and financial obligations move on different schedules. Analysts should identify the timetable, who bears the immediate cost, and who may capture the longer-term benefit.
A credible implementation plan requires named institutions, measurable indicators and regular public reporting. The point is not to promise an effortless transition; it is to make policy options concrete enough to compare their benefits and trade-offs.
Pakistan-specific decision test. For why the headline growth rate hides divergence, ask four questions: (1) Which import cost, export opportunity, credit channel or productivity constraint is affected? (2) Which groups face the first-round effects? (3) What could policymakers or firms change within six months? (4) Which published indicator would demonstrate improvement rather than merely announce activity?
What to monitor: (i) official monthly or quarterly data; (ii) movements in export receipts and import bills; (iii) price changes versus changes in physical volumes; (iv) borrowing and working-capital costs; and (v) job quality and household purchasing power. A single monthly reading can be noisy. Comparing several releases helps distinguish a trend from a short-lived disturbance.
Pakistan’s four exposure channels
For pakistan’s four exposure channels, The most useful indicator is not one number but a sequence: orders received by exporters, import bills, financial inflows, electricity charges and jobs created. These measures reach families at different speeds, which is why apparently stable GDP figures can coexist with a sense of economic pressure.
This matters for economic decision-making because firms and households cannot adjust instantaneously when conditions shift. Prices, contracts, worker skills and financial obligations move on different schedules. Analysts should identify the timetable, who bears the immediate cost, and who may capture the longer-term benefit.
A credible implementation plan requires named institutions, measurable indicators and regular public reporting. The point is not to promise an effortless transition; it is to make policy options concrete enough to compare their benefits and trade-offs.
Pakistan-specific decision test. For pakistan’s four exposure channels, ask four questions: (1) Which import cost, export opportunity, credit channel or productivity constraint is affected? (2) Which groups face the first-round effects? (3) What could policymakers or firms change within six months? (4) Which published indicator would demonstrate improvement rather than merely announce activity?
What to monitor: (i) official monthly or quarterly data; (ii) movements in export receipts and import bills; (iii) price changes versus changes in physical volumes; (iv) borrowing and working-capital costs; and (v) job quality and household purchasing power. A single monthly reading can be noisy. Comparing several releases helps distinguish a trend from a short-lived disturbance.
What the latest IMF agreement does and does not mean
For what the latest imf agreement does and does not mean, Economic resilience is the capacity to manage adverse shocks without repeatedly disrupting investment and consumption. Predictable policy, transparent fiscal choices and adequate external liquidity matter alongside short-term growth acceleration.
This matters for economic decision-making because firms and households cannot adjust instantaneously when conditions shift. Prices, contracts, worker skills and financial obligations move on different schedules. Analysts should identify the timetable, who bears the immediate cost, and who may capture the longer-term benefit.
A credible implementation plan requires named institutions, measurable indicators and regular public reporting. The point is not to promise an effortless transition; it is to make policy options concrete enough to compare their benefits and trade-offs.
Pakistan-specific decision test. For what the latest imf agreement does and does not mean, ask four questions: (1) Which import cost, export opportunity, credit channel or productivity constraint is affected? (2) Which groups face the first-round effects? (3) What could policymakers or firms change within six months? (4) Which published indicator would demonstrate improvement rather than merely announce activity?
What to monitor: (i) official monthly or quarterly data; (ii) movements in export receipts and import bills; (iii) price changes versus changes in physical volumes; (iv) borrowing and working-capital costs; and (v) job quality and household purchasing power. A single monthly reading can be noisy. Comparing several releases helps distinguish a trend from a short-lived disturbance.
What businesses should prepare for
For what businesses should prepare for, Growth averages blur distribution. A country manufacturing sought-after electronics can gain from a technology upcycle while an energy importer faces a larger fuel invoice. That contrast explains why Pakistan needs an exposure-weighted reading of international forecasts rather than simply celebrating a higher headline GDP projection.
This matters for economic decision-making because firms and households cannot adjust instantaneously when conditions shift. Prices, contracts, worker skills and financial obligations move on different schedules. Analysts should identify the timetable, who bears the immediate cost, and who may capture the longer-term benefit.
A credible implementation plan requires named institutions, measurable indicators and regular public reporting. The point is not to promise an effortless transition; it is to make policy options concrete enough to compare their benefits and trade-offs.
Pakistan-specific decision test. For what businesses should prepare for, ask four questions: (1) Which import cost, export opportunity, credit channel or productivity constraint is affected? (2) Which groups face the first-round effects? (3) What could policymakers or firms change within six months? (4) Which published indicator would demonstrate improvement rather than merely announce activity?
What to monitor: (i) official monthly or quarterly data; (ii) movements in export receipts and import bills; (iii) price changes versus changes in physical volumes; (iv) borrowing and working-capital costs; and (v) job quality and household purchasing power. A single monthly reading can be noisy. Comparing several releases helps distinguish a trend from a short-lived disturbance.
The policy choices that determine resilience
For the policy choices that determine resilience, The most useful indicator is not one number but a sequence: orders received by exporters, import bills, financial inflows, electricity charges and jobs created. These measures reach families at different speeds, which is why apparently stable GDP figures can coexist with a sense of economic pressure.
This matters for economic decision-making because firms and households cannot adjust instantaneously when conditions shift. Prices, contracts, worker skills and financial obligations move on different schedules. Analysts should identify the timetable, who bears the immediate cost, and who may capture the longer-term benefit.
A credible implementation plan requires named institutions, measurable indicators and regular public reporting. The point is not to promise an effortless transition; it is to make policy options concrete enough to compare their benefits and trade-offs.
Pakistan-specific decision test. For the policy choices that determine resilience, ask four questions: (1) Which import cost, export opportunity, credit channel or productivity constraint is affected? (2) Which groups face the first-round effects? (3) What could policymakers or firms change within six months? (4) Which published indicator would demonstrate improvement rather than merely announce activity?
What to monitor: (i) official monthly or quarterly data; (ii) movements in export receipts and import bills; (iii) price changes versus changes in physical volumes; (iv) borrowing and working-capital costs; and (v) job quality and household purchasing power. A single monthly reading can be noisy. Comparing several releases helps distinguish a trend from a short-lived disturbance.
Policy options: three alternative paths, not numerical forecasts
| Scenario | Assumptions | Implications for Pakistan | Early warning or confirmation |
|---|---|---|---|
| More favorable | Energy costs stabilize; export markets remain open; AI use generates measurable efficiency | Space for investment, steadier purchasing power and stronger services exports | Export orders, real income and private investment improve together |
| Central case | Global growth follows the broad institutional outlook; commodity and funding pressures fluctuate | Gradual recovery with uneven gains across sectors | Stable external balances without a broad productivity surge |
| Adverse | Energy disruptions persist; financing costs rise; AI investment is repriced | Imports become more costly, credit tighter and fiscal choices harder | Reserves, inflation expectations and financing costs weaken at once |
These are qualitative editorial scenarios, not probabilities assigned by an econometric model. Their value lies in clarifying which evidence would require an updated judgment. The IMF October 2026 World Economic Outlook explicitly emphasizes downside risks involving conflict, trade tension, debt and reassessment of AI expectations.
A practical action agenda
For policymakers, the first responsibility is to protect hard-won macroeconomic stability while removing barriers to productivity. Regulatory predictability, tax administration, targeted social protection and transparent energy decisions are more useful than shifting incentives that are impossible for businesses to plan around. The IMF Pakistan 2026 country report identifies revenue mobilization, reform of state enterprises, energy-sector viability and improvements in human capital as linked policy priorities.
For exporters, resilience means identifying where demand is growing, investing in reliable delivery and obtaining credible certifications. Export strategies should track volumes, domestic value added and customer retention; gross receipts alone do not disclose profitability. For small businesses, the practical priority is to map exposure to fuel, electricity, imports and foreign-exchange requirements and to stress-test cash flows before making expansion commitments.
For households, risk management begins with an affordable budget, attention to debt servicing and a realistic distinction between nominal wage gains and purchasing power. For workers, portable skills and credible training can expand options across changing industries. None of this makes external shocks harmless; it simply offers concrete ways to be less exposed.
How this analysis differs from generic global coverage
Major international reporting is indispensable for establishing what happened. The Reuters October 2026 WTO briefing emphasizes the boost from AI to merchandise trade and the pressure of geopolitical disruption. Institutional releases provide detailed projections. This article goes a step further by asking how those macroeconomic signals might translate into local import costs, export competitiveness, employment, household budgets and reform choices. It is an interpretation of attributed evidence, not a claim of exclusive interviews or original field reporting.
The difference is particularly relevant for Pakistan because a global technology boom may coincide with higher costs for countries that import fuel but do not manufacture the equipment in highest demand. No serious strategy should assume that a worldwide headline rate automatically delivers the same benefits locally.
Frequently asked questions
What is the IMF’s global growth forecast for 2027?
The IMF’s October 2026 World Economic Outlook projects 3.4% global GDP growth in 2027, following 3.1% in 2026. These are calendar-year forecasts and may be revised as new data becomes available. See the IMF October 2026 World Economic Outlook.
Is global inflation expected to fall in 2027?
Yes, the October IMF forecast projects global headline inflation easing from 4.7% in 2026 to 4.1% in 2027. That describes the world aggregate and does not imply that prices in Pakistan will fall in absolute terms.
Is Pakistan’s latest IMF financing already approved?
The 7 October 2026 IMF release announced staff-level agreement for the fourth EFF and third RSF reviews, subject to Executive Board approval. The release should not be described as a completed Board decision. See the IMF Pakistan October 7 staff-level agreement.
Will AI investment create jobs in Pakistan?
It could create demand for implementation, software services and specialist support, while also changing tasks in existing occupations. The result depends on skills, investment, electricity reliability and competitive access to customers. No credible source guarantees a particular employment gain.
Does the WTO predict rapid growth in all kinds of trade?
No. Its October outlook differentiates merchandise volume growth from commercial-services volume growth and notes uneven performance by sector and region. Read the WTO October 2026 executive summary.
What should Pakistani companies monitor through 2027?
Export order books, input costs, electricity reliability, financing terms, exchange-rate conditions and customer demand are more operationally useful than a single global growth figure. Businesses should compare these against their own cash flows and margins.
Conclusion: the decisive issue is transmission, not the headline
Global growth is not the same as broad prosperity. Pakistan’s outcomes will depend less on the global average than on the channels through which external demand, energy, financing, and technology influence local firms. The balance of risks is mixed: advanced technology can expand world production and trade, but it does not neutralize an energy shock or a financing squeeze. For Pakistan, policy credibility, internationally competitive exports and productivity-enhancing investment will determine how much of a fragile global expansion becomes better living standards at home.
Discover more from The Economy
Subscribe to get the latest posts sent to your email.
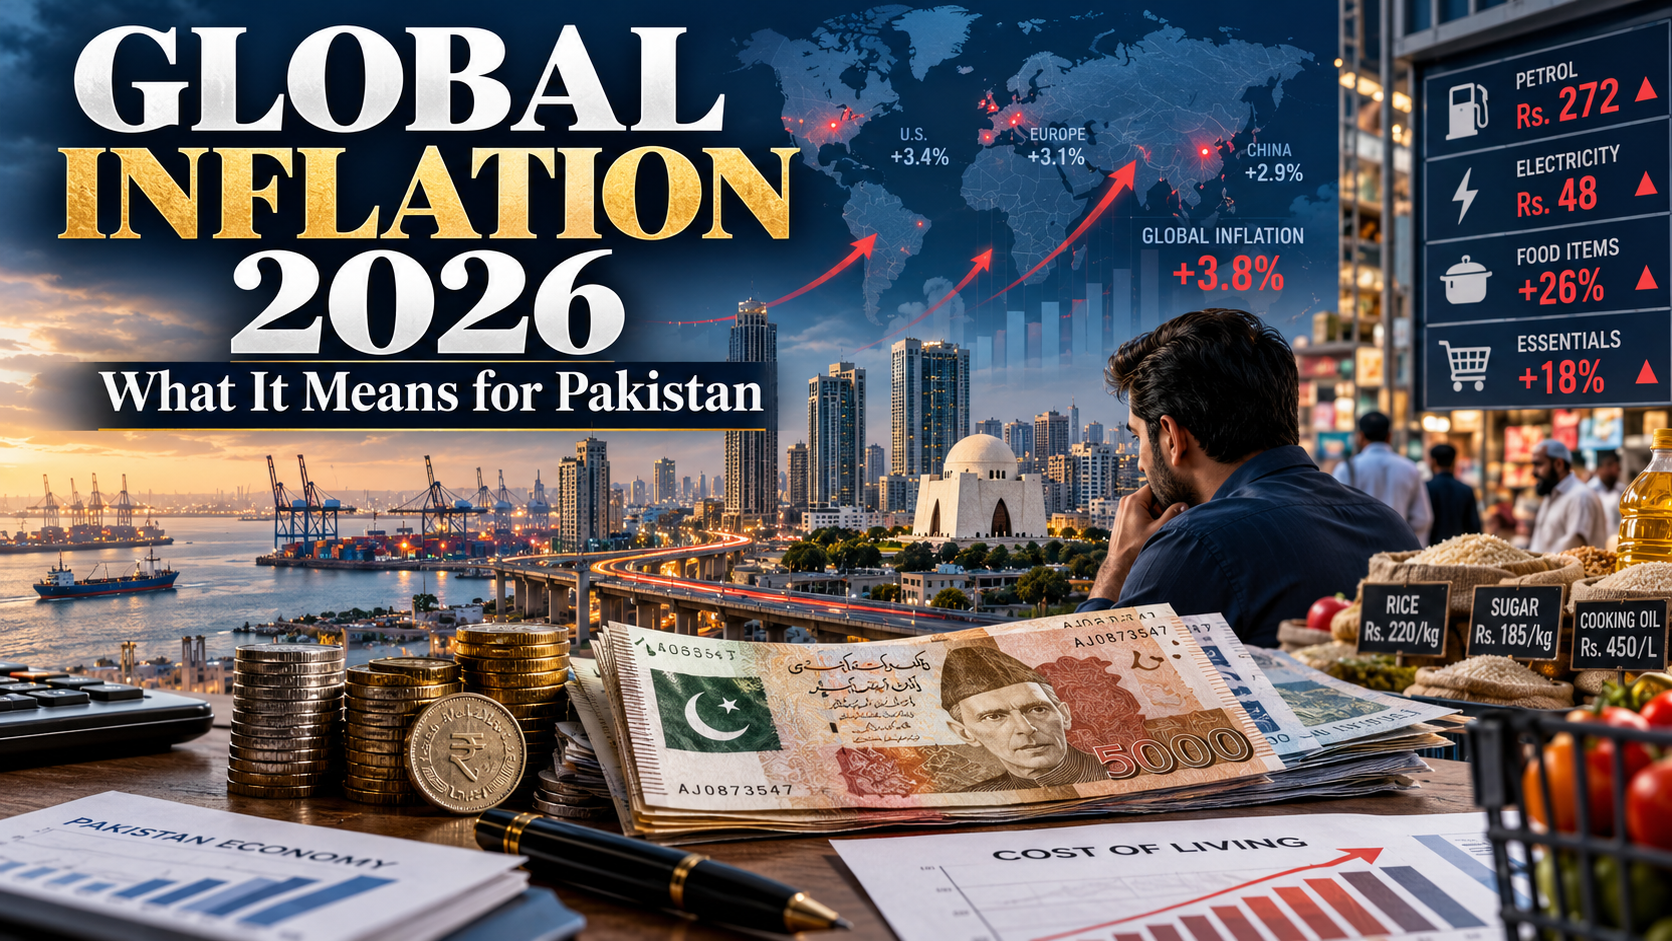
Global inflation is rising again in 2026, and energy is the main cause. The International Monetary Fund expects global headline inflation to climb to 4.7% this year, up from 4.1% in 2025, mainly because of higher energy and food prices (IMF, World Economic Outlook, October 2026). For import-dependent countries such as Pakistan, the shock arrives through fuel pumps, transport fares and the cost of imported goods.
Key Takeaways
- The IMF projects global inflation of 4.7% in 2026, easing to 4.1% in 2027.
- Energy and food prices are the main drivers, linked to the Middle East conflict and supply disruptions.
- Global growth is slowing at the same time, to about 3.1% in 2026, which makes the trade-off harder for central banks.
- Pakistan’s headline inflation was 10.26% year on year in September 2026, well above the State Bank’s 5 to 7% target range.
- Households and businesses should plan for higher transport and import costs, and should not assume a quick return to lower inflation.
The IMF numbers in brief
The IMF sees global growth slowing from 3.5% in 2025 to 3.1% in 2026, before recovering to 3.4% in 2027 (Trend.az, reporting the IMF release). The more worrying signal is that inflation is rising while growth slows. When an economy slows and prices rise together, policymakers have fewer good options.
The IMF has also said the global economy is resilient but increasingly uneven. Countries that benefit from the AI investment boom or favourable terms of trade are doing relatively well. Many energy-importing and low-income countries face much harder conditions (Trend.az).
Why energy is doing the damage
Energy feeds into almost everything: freight, fertiliser, food processing, manufacturing and electricity. One press summary of the IMF analysis reports that energy prices remain roughly a quarter higher than before the shock (Outlook India).
This is why interest rates alone cannot solve the problem. Higher borrowing costs reduce demand, but they do not produce more oil or gas. Central banks can slow second-round effects, where higher fuel costs feed into wages and expectations. They cannot lower the price of a barrel.
Supply shock or demand boom?
Demand-driven inflation comes from too much spending chasing too few goods. Supply-driven inflation comes from higher input costs that squeeze output. The 2026 episode is mostly supply-driven, and that changes the policy answer. Rate rises work well against demand-driven inflation. Against supply-driven inflation, they work more slowly and at a higher cost to growth.
A Pakistani analysis published in April made this point directly: inflation there is no longer driven solely by excess demand, yet policy still relies heavily on high interest rates (Bol News).
Our reading is that global inflation in 2026 is a supply problem that central banks will try to treat with demand tools. A prolonged period of high rates looks more likely than a sharp reversal.
Pakistan: inflation above 10% and the rate dilemma
Headline inflation in September 2026 was 10.26% year on year, and the monthly rise of 1.27% was driven by energy costs (ARY News, citing PBS data). Electricity and fuel offset a sharp slowdown in food prices. Core inflation, which excludes food and energy, ran between 8.1% and 8.6% (The Express Tribune).
The State Bank kept its policy rate at 11.5% in September, by a seven-to-three vote (The Express Tribune). It had raised rates by 100 basis points in April, the first hike in nearly three years (Bol News).
The government has told the IMF that inflation could fall to 7.5% if the Middle East situation normalises and Brent averages $80 a barrel in the current fiscal year. That is a conditional assumption, not a forecast. The IMF has urged Pakistan to adjust both exchange-rate and interest-rate policy to keep inflation and the current account deficit under control (The Express Tribune).
How the shock travels
For a Pakistani household, the chain is short. Petrol and diesel prices move first. Transport fares follow within weeks. Food prices rise through freight and packaging. Imported goods become more expensive as the rupee comes under pressure.
Food complicates the picture. Tomato prices fell about 25% month on month in the September data, and chicken prices fell about 8% (ARY News). Seasonal food swings can hide energy pressure for a month or two, which is why economists watch core inflation alongside headline figures.
What this means for households and businesses
Households: Treat transport and utility costs as fixed for budgeting purposes. If you carry variable-rate debt, remember that the policy rate feeds directly into repayments.
Small businesses and importers: Build fuel and freight surcharges into quotes where possible. Review supplier contracts for currency clauses. Keep working capital buffers, because higher rates raise the cost of bridging cash gaps.
Investors: A prolonged hold at high rates is a different environment from a rapid easing cycle. This is general information, not investment advice.
Risks, limitations and uncertainties
- IMF figures are projections. They will change as conflict and energy prices evolve, and the October outlook flags downside risks.
- The government’s 7.5% assumption depends on Brent averaging $80 a barrel. A sustained spike would push inflation higher.
- Pakistan’s monthly CPI and policy-rate figures are subject to revision.
- Pakistan can diverge from the global average because of the rupee, administered prices and food supply.
This article is for general information and is not personalised financial or economic advice.
FAQ
Will global inflation rise in 2026? The IMF expects global headline inflation to rise to 4.7% in 2026, from 4.1% in 2025 (IMF).
Why is inflation rising again? Energy and food costs are the main drivers, with supply disruptions linked to the Middle East conflict pushing fuel prices up.
Will inflation fall in 2027? The IMF projects global inflation easing to 4.1% in 2027. That could change quickly if energy supply worsens.
Why is Pakistan’s inflation above the global average? Pakistan imports much of its fuel, so energy shocks pass through quickly. Electricity and fuel rose in the latest data, and the rupee adds pressure.
Will the State Bank raise rates again? It has kept rates at 11.5% and has signalled it will tighten further if needed to prevent second-round effects. Future decisions depend on inflation, the exchange rate and energy prices.
Conclusion
Global inflation is rising in 2026 because energy and food costs have jumped, and the IMF expects it to ease only gradually. For Pakistan, the challenge is sharper, with inflation above 10% and limited room to cut rates. Watch oil prices, the State Bank’s next decision and monthly CPI releases. Those signals will show whether the shock is fading or becoming entrenched.
Discover more from The Economy
Subscribe to get the latest posts sent to your email.

Global Banking Trends 2026: Digital Banks, AI and Compliance

Gold vs US Dollar vs Bitcoin in 2026: Inflation Hedge Compared

How Global Interest Rates Affect Savings, Loans and Investments

How to Invest During High Inflation: A Global Guide

Best Global Stocks to Watch in 2026: Four Sectors to Research

Pakistan’s 2027 Growth Strategy: Exports, AI, Energy and Jobs

Pakistan Economy FY2027: IMF Reform, Debt and Recovery Outlook

Global Interest Rates 2027: Risks for Pakistan’s Rupee and Debt

Energy Shock 2026–2027: Oil, Gas and Pakistan’s Economy

World Trade 2027: Tariffs, Supply Chains and Pakistan Exports

AI Investment Boom 2026–2027: Can Pakistan Capture the Upside?

Global Economy 2026–2027: What Slower Growth Means for Pakistan

Why Global Inflation Is Rising Again in 2026, and What It Means for Pakistan

Raast Pakistan 2026: Digital Payments, Fintech

Crude Oil & Petroleum Market Analysis: OPEC+ Decisions and Price Forecasts

World’s Largest Economies: Ranking the Top Global Powers

Pakistan Economy 2026: Inside the SBP’s Balancing Act

Silver Price Today: Why the Xi-Trump AI Standoff Is Fueling a Safe-Haven Rally

Oil Prices 2026: Inside the Hormuz Crisis That Won’t End

SpaceX IPO 2026: History’s Biggest Stock Debut?

Algorithmic Dogfights: Why the U.S. and China Must Establish Rules of Engagement for Autonomous Air Power

Top US Convenience Store Chains: Store Counts, EV Charging, and Sales Trends

Who Is Shivon Zilis? The Neuralink Executive at the Center of the Musk–OpenAI Trial

Business Insurance: What Coverage You Actually Need and What It Costs in 2026

Global Economic Outlook 2026: 7 Forces Reshaping Markets, Trade and Business

Corporate America Faces a New Debt Test as US Borrowing Costs Surge

Is AI a Stock Bubble in 2026? What the Data Shows

US 10-Year Yield Hits 5.24%: What the Historic Bond Market Sell off Means for Mortgages and Investors
-

 Markets & Finance10 months ago
Top 15 Stocks for Investment in 2026 in PSX: Your Complete Guide to Pakistan’s Best Investment Opportunities
-

 Analysis8 months ago
Johor’s Investment Boom: The Hidden Costs Behind Malaysia’s Most Ambitious Economic Surge
-

 Analysis8 months ago
Top 10 Stocks for Investment in PSX for Quick Returns in 2026
-

 Banks9 months ago
Best Investments in Pakistan 2026: Top 10 Low-Price Shares and Long-Term Picks for the PSX
-

 Analysis9 months ago
Brazil’s Rare Earth Race: US, EU, and China Compete for Critical Minerals as Tensions Rise
-

 Investment9 months ago
Top 10 Mutual Fund Managers in Pakistan for Investment in 2026: A Comprehensive Guide for Optimal Returns
-

 Global Economy10 months ago
15 Most Lucrative Sectors for Investment in Pakistan: A 2025 Data-Driven Analysis
-

 Global Economy10 months ago
Pakistan’s Export Goldmine: 10 Game-Changing Markets Where Pakistani Businesses Are Winning Big in 2025