
Markets & Finance
Oil Surges as Strait of Hormuz Traffic Collapses Again

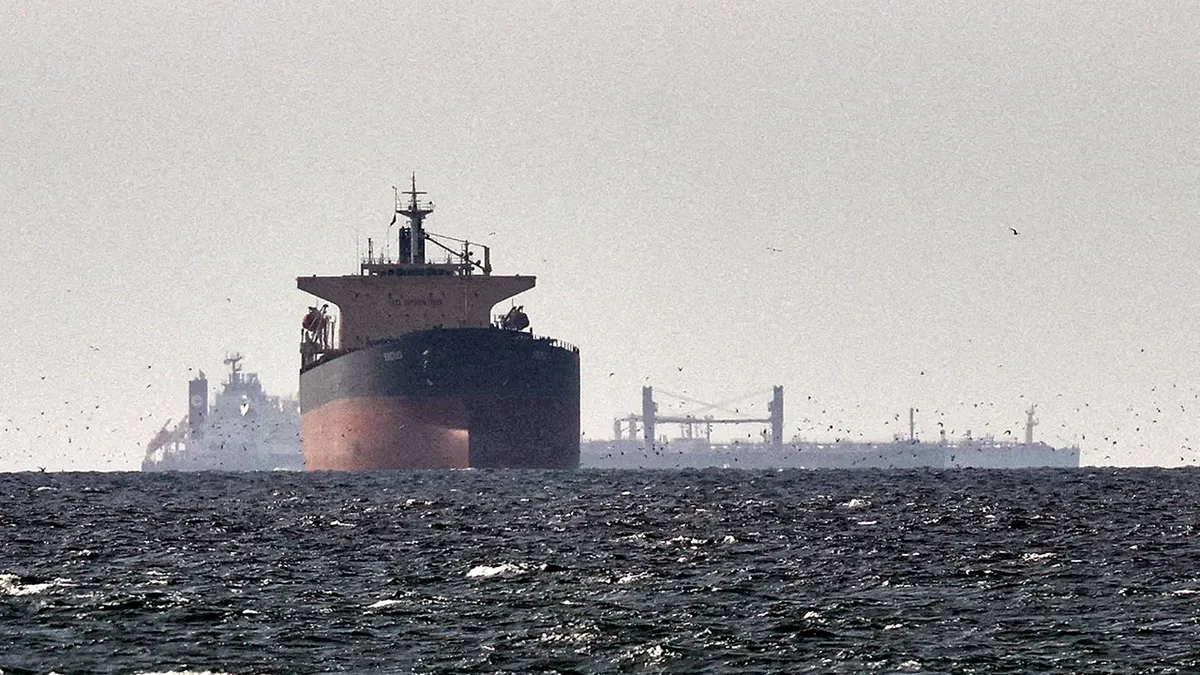
Brent crude is near $90 a barrel as tanker transits through the Strait of Hormuz collapse and the US-Iran interim deal expires. Here’s what it means for global energy costs.
Oil prices are climbing again as one of the world’s most important energy chokepoints grinds nearly to a halt. Per IranWire, Brent crude climbed to $89.40 a barrel in Monday, August 17 trading, driven by fading hopes for renewed US-Iran talks and a sharp drop in Strait of Hormuz tanker traffic. Shipping analytics firm Kpler data cited in the same report shows only five cargo vessels transited the strait on one Saturday, with zero on Sunday — down from 31 the previous weekend.
Key Takeaways
- Brent crude climbed to $89.40 a barrel on August 17 as tanker transits through the Strait of Hormuz collapsed to near zero.
- Only five cargo vessels crossed the strait on one recent Saturday, and zero on Sunday, versus 31 the previous weekend.
- The interim US-Iran memorandum of understanding, which set a 60-day negotiating window, has expired without a permanent agreement.
- The EIA does not expect Middle East oil production to return to near pre-conflict levels until early 2027.
- Gulf producers, including Saudi Arabia, are increasingly rerouting crude through alternative loading points to bypass the strait.
The immediate trigger is the expiration of the interim framework that had briefly stabilized the situation. Per TradingEconomics, crude rose above $85 a barrel as President Trump said Washington was not currently holding or planning talks with Tehran, while confirming a naval blockade remains in place — even as he claimed the strait was open and mines cleared. The same report notes a vessel was attacked while leaving the strait, suffering engine-room damage and a crew casualty, and that the memorandum of understanding signed in June — meant to give both sides 60 days to negotiate a longer-term deal — officially expired without a follow-on agreement.
The scale of the disruption is historic. Per Al Jazeera, shipping through the strait — a conduit for about one-fifth of global oil supply before the war — has effectively collapsed since the conflict began in late February, prompting the largest energy disruption in recorded history; between eight and 15 vessels crossed on August 4-6, versus roughly 130 transits before the conflict, according to ship-tracker MarineTraffic.
Iranian Foreign Minister Abbas Araghchi has tied any reopening to conditions Washington hasn’t met, including sanctions relief and war reparations, per the same Al Jazeera report. A separate CNBC report details a restrictive draft plan Iranian state media published for strait traffic — banning US and Israeli vessels outright and penalizing others at 20% of cargo value — even as Iran and Oman continued separately negotiating a managed-transit arrangement.
The price path has been genuinely volatile rather than a one-way spike. Per a CNBC analysis, Brent fell more than 7% in one week following signals of an imminent deal that then failed to materialize, before rebounding as attacks resumed. CNBC’s most recent update notes both major contracts gained more than 5% in the most recent week following attacks on ADNOC-operated tankers in the strait and a Saudi Aramco refinery, with a Phillip Nova analyst noting prices “have now rebounded almost completely from the lows seen in early August” as hopes for a lasting resolution fade.
Gulf producers are adapting rather than absorbing the disruption passively. The same Al Jazeera reporting notes Saudi Arabia has begun offering crude sourced from outside the chokepoint, following a pattern the UAE established earlier, while the EIA’s latest outlook — cited by Yahoo Finance — does not expect Middle East oil production to return to near pre-conflict levels until early 2027, forecasting Brent to average $79 a barrel for 2026, up sharply from a pre-conflict $58 forecast.
Why It Matters
Every day the strait remains constrained adds cost to energy-importing economies across the nine markets this operation covers, most directly Pakistan, Singapore and the UK, all of which import the bulk of their energy. It also directly explains part of the Bank of England’s rate-hold calculus detailed in Article 3.
Data and Evidence
- Brent crude: $89.40/barrel (Aug 17); recent trading above $85-90 range
- Strait transits: as low as 0 vessels on some days, versus ~130/day pre-conflict
- Pre-war share of global oil flows through Hormuz: approximately one-fifth
- EIA 2026 Brent forecast: $79/barrel average, up from a pre-conflict $58 estimate
Global Impact
Beyond direct energy-import costs, prolonged Hormuz disruption raises shipping insurance premiums globally and adds to inflation risk for every economy in this nine-market portfolio — a throughline connecting this story to the UK rate story, Pakistan’s inflation outlook, and global aviation fuel costs (Article 12).
What Happens Next
Watch for whether Iran and Oman finalize a managed-transit arrangement, and whether Washington re-engages given Trump’s stated reluctance to extend the interim deal. The EIA’s early-2027 normalization timeline is the baseline scenario barring a breakthrough.
Frequently Asked Questions
Why did oil prices rise again in August?
Tanker transits through the Strait of Hormuz collapsed toward zero as the US-Iran interim deal expired without a follow-on agreement.
Is the Strait of Hormuz fully closed?
Not officially, but transit volumes have fallen to a small fraction of pre-conflict levels on many days.
When might the situation normalize?
The EIA doesn’t expect near-pre-conflict production levels until early 2027.
Are alternative routes available?
Saudi Arabia and the UAE have begun rerouting some crude through non-strait loading points. How much oil normally flows through Hormuz?
About one-fifth of global oil supply before the conflict began.
Discover more from The Economy
Subscribe to get the latest posts sent to your email.


Markets & Finance
Oil Price Outlook 2026: How Supply Risks Reach Fuel Bills, Inflation and Business Costs

Oil prices matter because their effects spread well beyond the energy market. A change in crude costs can alter airline economics, freight charges, farm expenses and household budgets. Yet the route from an oil headline to a local petrol price is neither immediate nor uniform.
The US Energy Information Administration’s October 2026 Short-Term Energy Outlook forecasts Brent crude averaging $105 per barrel in the fourth quarter, $14 above its previous projection. Published on 6 October, the forecast assumes continuing constraints on Middle Eastern flows alongside gradual improvements in production and exports.
The revision shows why a single price target needs context. Oil forecasts depend on physical supply, transport access, inventories and demand. Change one of those assumptions materially, and a forecast that looked reasonable a month earlier may need substantial revision.
A forecast average is not today’s oil price
The most common comparison error is treating a quarterly average forecast as a live market quotation. A quarter can contain sharp rises and falls while still producing an average near the forecast. A year-end target answers a different question again.
Benchmark differences matter too. Brent and West Texas Intermediate represent different crude markets and delivery arrangements. Their prices are related but not identical. An article using one benchmark in the headline and another in the comparison can confuse readers about the size of a move.
Always check the unit, benchmark, time period and publication date. A forecast completed before a major disruption should not be presented as though it incorporates that disruption. The EIA identifies both the release date and forecast completion date, a useful practice for interpreting any time-sensitive energy projection.
Physical supply is more than production capacity
Having oil underground or even at a producing facility is not the same as delivering it to a refinery. Pipelines, ports, tankers, insurance and navigation routes all form part of effective supply.
A disruption at a narrow transport point can therefore matter disproportionately. Alternative routes may exist but lack enough capacity, require longer journeys or introduce additional costs. Longer voyages also tie up vessels, affecting the amount of transport available for other cargoes.
The International Energy Agency’s August 2026 Oil Market Report highlights the importance of disrupted flows in its supply assessment. That report is a dated analysis rather than an October update. Its broader relevance is the distinction between nominal production potential and oil that can actually reach buyers when needed.
Inventories provide a buffer, not an unlimited solution
Stored oil can help bridge a temporary gap between supply and demand. Commercial inventories support normal operations, while government-held reserves may be used under specific policy decisions. Neither should be treated as a permanent substitute for reliable production and transport.
The rate of inventory change can matter as much as the absolute level. Repeated withdrawals suggest that the market is meeting demand partly by using previously accumulated supply. If that continues, the capacity to absorb another disruption may diminish.
Inventory data also require interpretation. Stocks in one location or product category may not solve a shortage elsewhere. Crude oil cannot instantly substitute for unavailable diesel, and transport constraints can prevent stocks from reaching the region where they are most valuable. The practical question is usable supply in the right place and form.
Refining explains why diesel and petrol can behave differently
Crude must be processed into usable products, and refineries have different capabilities. Maintenance, unexpected outages and the composition of demand can affect the supply of individual fuels.
Consequently, petrol and diesel prices do not have to move by the same amount as crude or as each other. A shortage of a particular product can widen its price relative to the underlying oil benchmark. Seasonal changes in transport and heating demand can add further variation.
For businesses, this means a crude forecast may be an incomplete budgeting tool. A logistics operator cares about delivered diesel costs, while an airline is exposed to jet fuel. Their relevant prices include refining, transport and contractual factors that an international crude quotation does not fully capture.
Currency movements change the local result
Oil is widely priced in dollars, but most households and many businesses pay fuel bills in another currency. A weaker local currency can amplify an international price rise or erase the benefit of a decline.
Consider a hypothetical 10% fall in the dollar oil price combined with a 10% increase in the local-currency price of dollars. The combined effect is approximately a 1% decline before other costs, rather than the full 10% saving suggested by the commodity headline.
Taxes, administered prices, subsidies and distribution charges create additional differences between countries. Readers should therefore be cautious about explanations that attribute every pump-price movement to crude alone. In markets such as Pakistan, the exchange rate and domestic pricing decisions can materially influence the final bill.
The inflation effect arrives through several channels
Fuel has a direct place in household expenditure, but energy also enters the cost of producing and delivering other goods. A business facing higher transport bills may raise prices, reduce its margin, alter routes or renegotiate contracts.
How much reaches consumers depends on competition and demand. Companies may find it difficult to pass through costs when customers are already reducing purchases. In that case, the pressure can appear in profitability, hiring or investment instead.
This is why an energy shock can create a difficult economic combination: upward pressure on prices and downward pressure on activity. The size and persistence of each effect depend on the shock’s duration, the structure of the economy and the response of businesses, households and policymakers.
What could pull oil prices lower?
A more reliable flow of supply could reduce the premium associated with disruption. Better transport access, recovering output or additional deliveries from other producers might ease pressure, depending on their scale and timing.
Demand can also weaken. Slower industrial activity, reduced travel or greater efficiency can lower consumption relative to expectations. A falling oil price is therefore not automatically positive news about the global economy; it may reflect improving supply, deteriorating demand or both.
These possibilities should be treated as scenarios. A price decline caused by restored supply would have different implications from one caused by a sharp economic downturn. Readers assessing a market move should ask which side of the supply-demand balance changed and what evidence supports that interpretation.
What could keep prices elevated?
Persistent transport restrictions, damage to infrastructure or uncertainty over reliable deliveries could sustain pressure even if some production recovers. A market with limited spare buffers may react strongly to relatively small additional problems.
Demand can also prove more resilient than expected. Businesses may have limited short-term substitutes for certain fuels, while households still need to commute and transport essential goods. Adjustment often takes time because vehicles, industrial equipment and logistics networks cannot be replaced overnight.
The bullish scenario is therefore not simply that something bad happens. It is that available supply fails to keep pace with consumption for long enough to draw down buffers and change expectations. The strength of that argument depends on measurable flows and inventories, rather than dramatic language alone.
How businesses can plan without predicting perfectly
A useful budget tests several fuel-cost assumptions. The aim is to identify when margins become uncomfortable, which contracts allow adjustments and which operations are most exposed. Scenario planning can reveal vulnerabilities without requiring a precise forecast of the next price peak.
Operational measures may include consolidating deliveries, reducing avoidable mileage and reviewing energy-intensive processes. Their usefulness depends on the business; they are not substitutes for understanding contractual obligations or customer-service requirements. Financial hedging involves separate risks and requires expertise appropriate to the organisation.
The oil outlook in 2026 is best read as a changing assessment of physical flows and economic responses. Forecasts help organise the evidence, but the final effect on a household or company depends on the fuel it buys, the currency it uses and the flexibility it has to adapt.
Discover more from The Economy
Subscribe to get the latest posts sent to your email.
Markets & Finance
Gold Price Outlook 2026: The Forces Behind the Forecasts—and What Could Reverse Them

Gold forecasts attract attention because they offer a simple number for an uncertain world. Yet a price target is the end of an argument, not its beginning. Understanding why an analyst expects gold to rise—and what would invalidate that expectation—is more useful than collecting the highest prediction.
In an outlook published on 28 August 2026, Goldman Sachs Research projected gold at $4,900 per troy ounce by year-end. That is a dated institutional forecast, not a guaranteed outcome or today’s market price. The World Gold Council’s second-quarter outlook also describes supportive investment demand alongside the constraint posed by higher real yields.
Those competing forces explain why gold can remain attractive without moving upward in a straight line. Its price reflects several kinds of buyers, different economic fears and the changing opportunity cost of holding an asset that does not pay interest.
Start by separating the price from the prediction
A spot quotation, a quarterly average forecast and a year-end target answer different questions. The spot price describes a market at a particular moment. A quarterly forecast describes an expected average across many trading sessions. A year-end target refers to a point near the end of the period.
An article that compares these without explanation can make ordinary differences look contradictory. It can also exaggerate expected returns by measuring a forecast against an outdated starting price.
Any meaningful comparison should record the forecast’s publication date, currency, unit and horizon. Gold is commonly quoted in US dollars per troy ounce, but retail buyers may transact in grams, tolas or another local unit. Conversion, purity and dealer charges must be handled separately from the international benchmark.
Why real interest rates matter
Gold does not generate contractual interest income. When investors can obtain a more attractive inflation-adjusted return from high-quality bonds or cash instruments, the opportunity cost of holding gold can rise.
The relevant concept is the real interest rate: broadly, the nominal rate adjusted for inflation expectations. A rise in nominal yields does not always mean the real return has improved. If expected inflation rises even faster, the relationship changes.
This is one reason simplistic rules fail. Gold does not have to fall after every rate increase or rise after every rate cut. Markets may already have anticipated the decision. Currency changes, financial stress and investor positioning can also dominate the reaction. The useful question is what changed relative to expectations, rather than whether the policy announcement sounds hawkish or dovish.
Central banks and private investors have different objectives
Central banks can purchase gold as part of reserve diversification. Their priorities may include liquidity, resilience and reducing dependence on particular financial assets. Their decisions do not necessarily follow the same time horizon as those of a household investor or short-term trader.
Goldman Sachs’ August analysis identifies central bank demand as part of its bullish case. That supports the importance of monitoring official-sector activity, but it does not mean central banks establish a guaranteed minimum price.
Private demand is more fragmented. Jewellery buyers respond to affordability and cultural preferences. Investors in funds respond to portfolio considerations and market momentum. Buyers of bars and coins may focus on wealth preservation or local currency concerns. A strong overall market can therefore contain weakness in one demand segment and strength in another.
The dollar changes the experience for different buyers
A person outside the United States faces two price movements: gold’s dollar price and the exchange rate between dollars and the local currency. A weaker domestic currency can make local gold more expensive even when the international benchmark is unchanged.
Consider a hypothetical example. Gold rises 5% in dollars while the dollar becomes 10% more expensive in the buyer’s currency. Before costs, the combined local-currency increase is approximately 15.5%, because the two changes multiply rather than simply replace each other.
The reverse can happen too. A stronger local currency can reduce the domestic return from a global gold rally. For readers in Pakistan or other import-dependent gold markets, a dollar forecast alone therefore cannot explain the full retail price. Local premiums and transaction costs add another layer.
Geopolitical risk is supportive only under certain conditions
Gold is often described as a safe haven, but that phrase can imply more certainty than markets provide. Investors may seek it during uncertainty, yet prices can still fall during periods when cash is urgently needed or leveraged positions are being reduced.
The sequence of events matters. An initial shock may produce strong demand, followed by profit-taking or a shift into other assets. A prolonged crisis may influence inflation, exchange rates and monetary policy in different directions.
The EIA’s October energy outlook highlights continuing uncertainty around Middle Eastern oil flows. The implication for gold is analytical rather than automatic: an energy shock can increase inflation concerns, but it may also encourage tighter monetary conditions. Those channels can pull gold in opposite directions.
Physical gold, funds and mining shares are different exposures
Physical bullion involves purchase premiums, storage decisions, authenticity checks and a resale spread. Jewellery adds workmanship and design costs that may not be recovered on sale. The metal content is only one component of the purchase price.
A gold-backed investment fund offers another structure, with product-specific fees, custody arrangements and trading characteristics. Its practical suitability depends on the investor’s market access, tax position and the terms of the particular fund.
Mining shares are businesses rather than substitutes for a bar of gold. Their performance depends on production costs, management, financing, political conditions and operational execution. A rising metal price can help revenues while a mine still encounters serious difficulties. Comparing these exposures requires more than asking which one has recently delivered the largest return.
A scenario framework is better than one target
A constructive gold scenario would combine sustained investment demand with conditions that reduce the appeal of competing assets. Examples could include lower real yields, a weaker dollar or greater demand for portfolio diversification. These are conditional drivers, not predictions that all will occur together.
A less supportive scenario would include firmer real yields, improving confidence in other assets and weakening investment flows. Strong earlier gains could also encourage selling. None of these factors needs to eliminate long-term demand to produce a meaningful price correction.
A mixed scenario may be the hardest for headline readers. Official-sector purchases could remain supportive while fund flows fluctuate and jewellery demand softens. The result could be a volatile trading range rather than the dramatic breakout or collapse suggested by competing online forecasts.
How to evaluate a forecast before using it
Look for the assumptions behind the number. Does the analyst expect monetary easing, continuing reserve purchases or a particular currency trend? Does the target require demand to accelerate, or simply remain strong? Is there an alternative scenario?
Then examine whether the forecast was revised. A target published before a major shift in rates or energy markets may no longer reflect the institution’s current view. Articles that preserve old forecasts under a newly updated headline can mislead readers even if the original quotation was accurate.
Finally, distinguish the institution’s analysis from the publisher’s interpretation. A cautious scenario can become an overconfident headline when repackaged. Reading the original source makes it easier to identify qualifications that disappear in summaries and social posts.
What the outlook means for a real financial decision
The right starting point is the purpose of the money. Funds needed for near-term living costs behave differently from long-term savings intended to diversify a broader portfolio. An asset can have a plausible long-term role while still being unsuitable for an imminent expense.
Transaction costs also establish a hurdle. A buyer paying a premium on entry and accepting a discount on exit needs a larger market move merely to break even. Frequent trading can magnify those costs and make the headline price an incomplete guide to the actual result.
Gold’s 2026 outlook is therefore a question of competing forces, time horizons and purchase structure. A bullish institutional target is evidence of one analytical view. It is not a substitute for understanding volatility, liquidity needs and the possibility that the forecast will be wrong. This article provides general market education, not a personal allocation recommendation.
Discover more from The Economy
Subscribe to get the latest posts sent to your email.

President Donald Trump’s decision to allow Russian diesel supplies to reach American and international markets has opened a new dispute between Washington and Kyiv, raising difficult questions about energy security, sanctions policy and the future of US support for Ukraine.
The agreement, announced after Trump’s conversation with Russian President Vladimir Putin, comes at a particularly sensitive moment. Ukraine is continuing its fight against Russia’s invasion, global fuel markets are facing severe supply pressures, and diplomatic efforts to end the war remain uncertain.
Ukrainian President Volodymyr Zelensky has criticized sanctions relief that is not tied to reciprocal de-escalation, arguing that Russian petroleum revenue could help Moscow sustain its military campaign. The Trump administration, meanwhile, has presented additional fuel supplies as a potential way to ease pressure on consumers.
But the central question is whether the arrangement can deliver meaningful economic benefits without weakening Washington’s leverage over the Kremlin.
Why Trump Reached a Diesel Agreement With Putin
According to an October 10 report by Axios, a US official said Trump’s decision followed repeated Ukrainian refusals to halt attacks on Russian oil refineries despite US requests.
The report adds a significant diplomatic dimension to the agreement. Rather than being solely an energy transaction, the decision appears connected to disagreements over military strategy, energy infrastructure and Washington’s approach to negotiations with Moscow.
Trump announced the arrangement after speaking with Putin and argued that additional Russian diesel would help bring fuel prices down. His announcement also coincided with discussions involving US, Ukrainian and European representatives seeking progress toward ending the war.
According to The Associated Press, Trump announced an initial supply exceeding 300,000 metric tons, followed by 500,000 tons in November and further shipments afterward.
The precise delivery schedule, payment arrangements and ultimate volumes remain important unanswered questions. Announced commitments should not be confused with completed deliveries.
The distinction matters because the agreement’s economic and political consequences will depend on what actually reaches the market and under what conditions.
Why Zelensky Objects to Easing Russian Oil Sanctions
Kyiv’s opposition reflects a longstanding concern: energy exports provide Russia with revenue that can support its economy during the war.
Zelensky has argued that allowing Russian petroleum products to be sold without a lasting de-escalation agreement risks rewarding Moscow without securing meaningful concessions in return.
In a Reuters report published October 9, Zelensky described the decision as an investment in a war that should be brought to an end rather than prolonged.
Ukraine has also proposed reciprocal restraint involving attacks on energy infrastructure. Under the principle outlined by Zelensky, Ukraine would refrain from striking Russian oil refineries if Russia stopped attacking Ukrainian energy facilities.
Such a proposal highlights an alternative approach: treating energy infrastructure as part of a negotiated de-escalation framework instead of relaxing sanctions without corresponding commitments.
The broader challenge is verification. Any energy truce would need clear definitions of prohibited attacks, monitoring arrangements and consequences for violations. Without those safeguards, either side could accuse the other of exploiting restraint while continuing military operations.
The Center for Strategic and International Studies, in an analysis published September 29, examined the potential for an energy truce and the difficulty of separating de-escalation from disputes over sanctions.
For Kyiv, therefore, the issue extends beyond the immediate diesel shipments. It concerns whether economic relief for Moscow is being exchanged for concrete steps toward peace.
Can Russian Diesel Really Lower US Fuel Prices?
The agreement’s economic case depends on supply, timing, transportation costs and conditions across international fuel markets.
Diesel is particularly important because it powers much of the freight and agricultural equipment that moves goods through the US economy. Higher prices can increase operating costs for trucking companies, farms, construction businesses and other industries, potentially feeding into consumer prices.
However, additional imports do not automatically translate into a substantial reduction at the pump.
The US Energy Information Administration reports that American refineries produced approximately 1.76 billion barrels of ultra-low-sulfur distillate in 2025, while US consumption totaled approximately 1.42 billion barrels. Imports represented about 4% of consumption, and Canada supplied approximately 84% of those imports.
These figures illustrate an important distinction: the United States has considerable domestic refining capacity, but regional shortages, export demand, logistics and international prices can still influence what consumers pay.
The initial Russian shipment, if delivered as announced, could provide additional flexibility in a tight market. Yet the overall effect will depend on how much fuel is available, where it is delivered and whether the supplies add to global availability or simply redirect existing trade.
The Associated Press reported that energy experts expected the agreement to have a limited effect on overall US and global diesel prices. Their concern is that shifting supplies between buyers does not necessarily resolve the underlying shortage.
That assessment is consistent with the broader market pressures described in the International Energy Agency’s September 2026 Oil Market Report. The agency documented severe disruption to oil flows, reduced refining activity and unusually tight markets for refined fuels.
In other words, the agreement may offer some relief at the margin, but it should not be treated as a guaranteed solution to elevated fuel costs.
Why the Global Energy Crisis Matters
The diesel dispute is unfolding against a wider backdrop of geopolitical disruption.
The conflict involving the United States, Israel and Iran has affected energy supplies and shipping routes, while the Strait of Hormuz remains a critical concern for international oil trade. Reduced exports from the Middle East, alongside disruption to Russian refining operations, have tightened markets for diesel and other petroleum products.
The IEA’s September assessment described substantial declines in regional oil exports and severe pressure on refined-product availability. These conditions help explain why governments are looking for alternative sources of fuel.
But energy markets are interconnected. A shipment purchased by one country may displace another buyer, particularly when available supply is limited. The final effect depends on whether the transaction increases net supply, improves distribution or merely changes the destination of existing barrels.
The IEA’s analysis of Russia’s refining sector also describes how Ukrainian attacks on Russian refineries have contributed to lower diesel production and export availability.
This creates a difficult policy dilemma for Washington. Additional Russian exports might help ease supply constraints, but the revenue and commercial opportunities could also benefit Moscow.
What the Deal Means for Russia’s War Economy
For Russia, access to additional export opportunities could provide a commercial benefit at a time when refinery disruptions and sanctions have complicated energy sales.
The scale of that benefit remains uncertain. It will depend on the volumes actually exported, the prices received, the costs of transporting the fuel and the terms of the applicable sanctions relief.
The Center for Strategic and International Studies has examined the continuing importance of Russian fossil-fuel exports to the country’s wartime finances and the challenges Western governments face in restricting those revenues.
Sanctions do not operate in isolation. Their effectiveness depends on enforcement, access to buyers, shipping arrangements, financial channels and the availability of alternative suppliers.
A temporary license can therefore have consequences beyond the immediate shipment. It may create a precedent for further exceptions, alter market expectations or affect how allies interpret US policy toward Moscow.
At the same time, the existence of a commercial transaction does not by itself establish that a broader diplomatic settlement has been reached.
The critical questions are whether the relief is limited, whether it is reversible, and whether Russia makes any verifiable concessions in return.
A Diplomatic Test for Trump, Putin and Zelensky
The diesel agreement exposes competing priorities among the three leaders.
For Trump, the immediate argument centers on fuel availability and prices, alongside his administration’s efforts to advance negotiations. For Putin, expanded access to energy markets could offer economic opportunities and diplomatic leverage. For Zelensky, the danger is that Russia could receive financial relief while Ukraine is pressed to limit military operations without equivalent guarantees.
These objectives do not necessarily align.
A sustainable agreement would require more than an announcement of fuel shipments. It would need clarity on the sanctions framework, delivery terms, enforcement and the relationship between energy cooperation and progress toward peace.
Washington also faces an alliance-management challenge. European governments and Ukraine may question the credibility of a policy that relaxes economic pressure on Russia without measurable progress on the battlefield or at the negotiating table.
Conversely, US officials may argue that narrowly defined energy measures can help stabilize markets and create opportunities for diplomatic engagement.
The outcome will depend on whether the arrangement remains a limited commercial measure or develops into a broader shift in US policy toward Russia.
What Happens Next?
Three developments will help determine the agreement’s significance.
First, actual deliveries. Confirmation of shipment volumes, timing and destinations will establish whether the announced supplies materially affect the market.
Second, the price response. Diesel prices will continue to depend on refining capacity, inventories, transportation constraints and geopolitical risk. A short-term market reaction would not, by itself, demonstrate lasting consumer savings.
Third, diplomatic conditions. Any further sanctions relief, energy truce or progress in peace talks will indicate whether the agreement is connected to reciprocal concessions.
Until these details become clearer, claims that the deal will rapidly reduce fuel prices or transform the course of the war should be treated cautiously.
Conclusion
Trump’s Russian diesel agreement brings together two urgent policy challenges: controlling energy costs and ending the war in Ukraine.
Additional supplies could offer some flexibility to fuel markets, but the scale of any consumer benefit remains uncertain. At the same time, easing restrictions on Russian petroleum exports raises legitimate questions about sanctions enforcement, wartime revenue and the leverage available to negotiators.
For Zelensky, the central issue is whether economic cooperation with Moscow will be accompanied by meaningful de-escalation. For Washington, it is whether a short-term energy measure can deliver practical benefits without undermining its wider diplomatic objectives.
The decisive test will not be the announcement itself. It will be the volume of fuel delivered, the effect on prices and whether the arrangement produces measurable progress toward reducing the conflict.
This article is based on reporting and analysis available as of October 10, 2026. The agreement’s ultimate economic and diplomatic effects remain uncertain.
Frequently Asked Questions
1. What is the Trump–Putin diesel deal?
Trump announced an agreement for Russia to supply diesel to US and international markets, with additional shipments planned after an initial delivery. The final volumes and delivery schedule require confirmation.
2. Why is Zelensky criticizing the agreement?
Zelensky argues that easing restrictions on Russian petroleum exports without reciprocal de-escalation could increase Moscow’s revenue while prolonging its war against Ukraine.
3. Will the deal lower diesel prices in the United States?
It could add supply, but the overall impact is uncertain. Energy experts have warned that the announced volumes may be insufficient to materially lower prices across the United States or globally.
4. Does the agreement mean US sanctions against Russia have ended?
No. The reported measure involves temporary, limited sanctions relief related to Russian diesel supplies. It should not be interpreted as the end of the broader sanctions framework.
5. What should readers watch next?
The key indicators are confirmed deliveries, changes in diesel prices and inventories, the scope of sanctions relief, and any reciprocal commitments involving attacks on energy infrastructure or peace negotiations.
Discover more from The Economy
Subscribe to get the latest posts sent to your email.

Social Security Extra $90 Deposit: Who Qualifies for the October 2026 Medicare Rebate?

Anthropic Bans Sustained Abuse of Claude AI Under New Usage Policy Effective November 12, 2026

Jeff Bezos Three-Day Workweek View: What He Really Said

Celeste Frozen Pizza Discontinued: What Conagra Confirmed

US–China Critical Minerals Competition: Why a Trade Deal Cannot Fix Every Supply Risk

Oil Price Outlook 2026: How Supply Risks Reach Fuel Bills, Inflation and Business Costs

AI in Business 2026: Why Faster Employees Do Not Automatically Mean Higher Profits

Mortgage Rates in 2026: Why They Remain High and How to Compare the True Cost

Gold Price Outlook 2026: The Forces Behind the Forecasts—and What Could Reverse Them

Global Economic Outlook 2026: Growth, Inflation and Risks

Trump–Putin Diesel Deal: Why Zelensky Is Angry and What It Means for Fuel Prices

Anthropic Draws the Line: Why Claude’s New Usage Policy Explicitly Bans ‘Cruel Behavior’ Toward AI

Ynon Kreiz & Mattel’s Digital Transformation: Franchise Strategy and Financial Growth

Crude Oil & Petroleum Market Analysis: OPEC+ Decisions and Price Forecasts

Oil Prices Break $100 in 2026: Middle East Conflict & Energy Markets

Middle East War Economics 2026: Oil Prices & Energy Markets

China Stocks Today: Are Big Economies in Asia Nearing a Market Bottom?

PSX Forecast 2026: KSE-100, IMF Reviews & Geopolitics

Crypto Daily Outlook: Bitcoin, Altcoins, and the Future of Decentralized Finance

Global Pension Systems Ranked: The World’s Best and Worst Retirement Frameworks

Enterprise AI Platforms Disrupting B2B SaaS in 2026: Full Analysis

World’s Largest Economies: Ranking the Top Global Powers

Elon Musk’s Next Moves: Disrupting the 2026 Global Economy

Pakistan Economy 2026: Inside the SBP’s Balancing Act

GasBuddy Market Insights: How Crude Price Shifts Impact Local Fuel Cost Averages

World Bank & IMF Reports 2026: Why the “3% Growth” Consensus Is Actually a Debate

Global Equity Market Divergence: US Tech vs. European Dividend Stocks vs. Asian Growth

Stock Market Today: Dow Climbs 500 Points as Markets Shake Off Inflation Jitters
-

 Markets & Finance9 months ago
Top 15 Stocks for Investment in 2026 in PSX: Your Complete Guide to Pakistan’s Best Investment Opportunities
-

 Analysis8 months ago
Johor’s Investment Boom: The Hidden Costs Behind Malaysia’s Most Ambitious Economic Surge
-

 Analysis8 months ago
Top 10 Stocks for Investment in PSX for Quick Returns in 2026
-

 Banks9 months ago
Best Investments in Pakistan 2026: Top 10 Low-Price Shares and Long-Term Picks for the PSX
-

 Analysis8 months ago
Brazil’s Rare Earth Race: US, EU, and China Compete for Critical Minerals as Tensions Rise
-

 Investment9 months ago
Top 10 Mutual Fund Managers in Pakistan for Investment in 2026: A Comprehensive Guide for Optimal Returns
-

 Global Economy10 months ago
15 Most Lucrative Sectors for Investment in Pakistan: A 2025 Data-Driven Analysis
-

 Global Economy10 months ago
Pakistan’s Export Goldmine: 10 Game-Changing Markets Where Pakistani Businesses Are Winning Big in 2025