
Business
Celeste Frozen Pizza Discontinued: What Conagra Confirmed

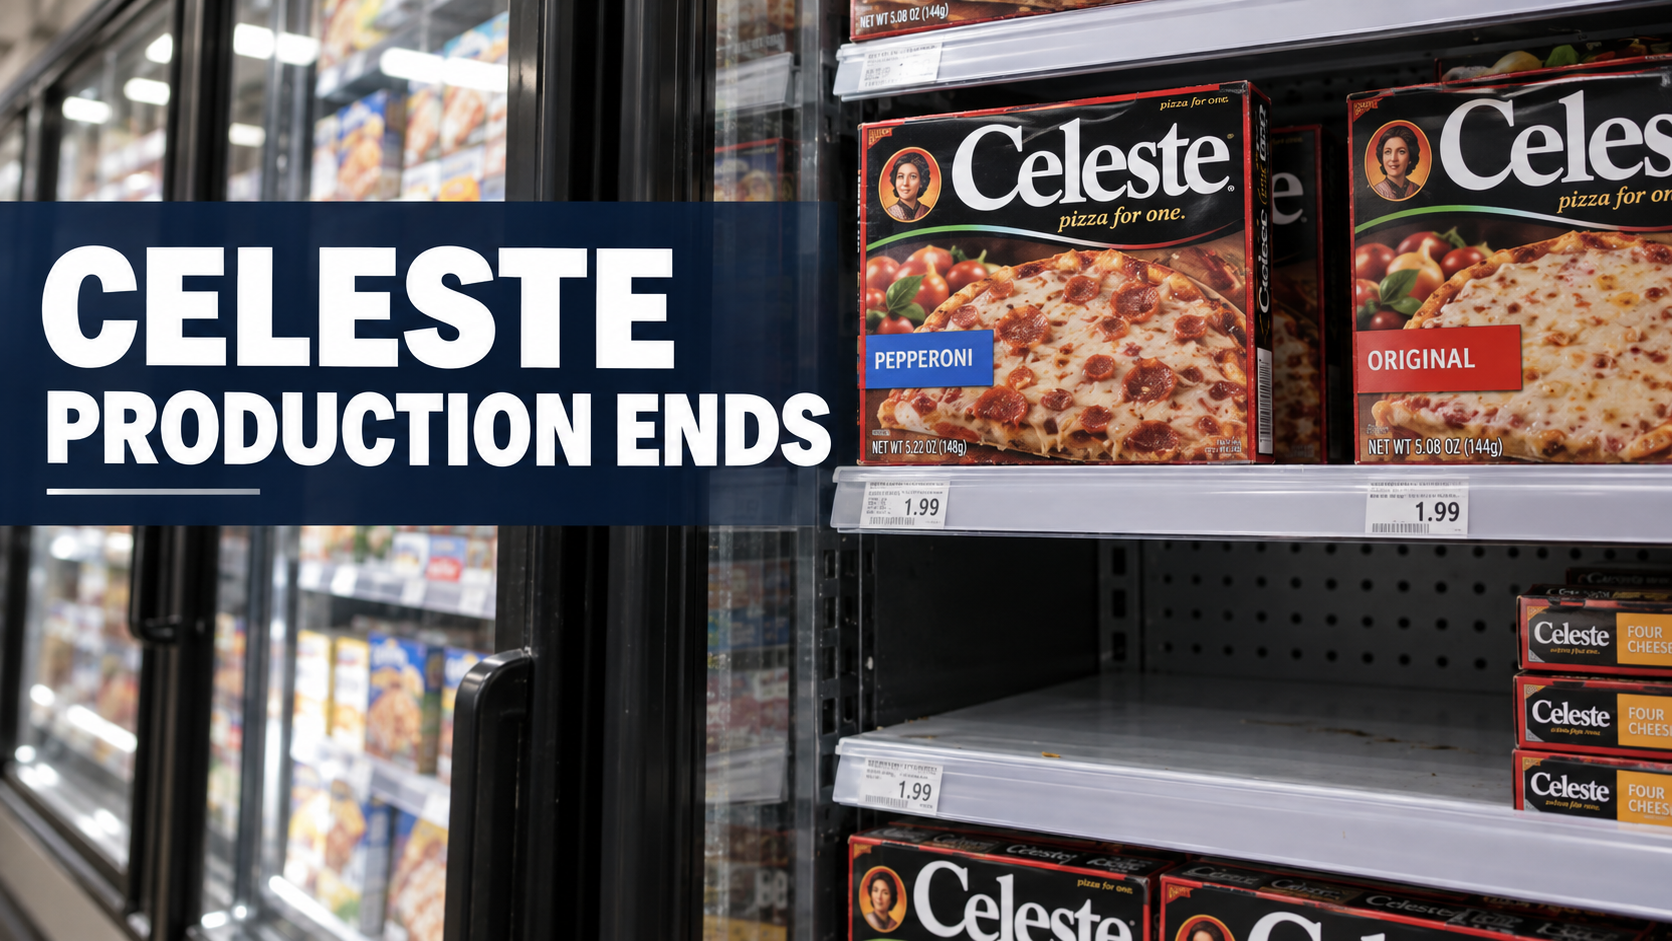
Conagra Brands has stopped producing Celeste frozen pizza, bringing an end to the familiar budget-friendly product line. The company disclosed its decision as part of a wider simplification of its food portfolio during its fiscal first-quarter 2027 earnings cycle. A Conagra representative subsequently confirmed that existing retail inventory can continue to sell, but the company is no longer manufacturing new Celeste pizzas. That means a shopper may still spot a box in a freezer, even though production has ceased. Conagra’s quarterly results and Fox Business’s confirmation from the company establish the basic facts.
Key takeaways:
- The decision is a confirmed discontinuation, not a social-media rumor or temporary nationwide recall.
- Existing products may remain on shelves until inventories run out; availability is local and cannot be guaranteed.
- Conagra’s management presented Celeste as part of a broader effort to simplify underperforming brands and individual product lines.
- A brand’s devoted following does not necessarily make it profitable to produce and distribute nationally.
Did Celeste frozen pizza really stop production?
Yes. During the September 30, 2026 earnings discussion, management identified the exit from Celeste as one example of simplifying Conagra’s assortment. In a statement reported by Fox Business, the company said it had stopped making Celeste and would sell remaining inventory. The same report said Conagra viewed the exit as positive for future margins, despite a small negative contribution to reported quarterly sales.
Two distinctions matter. Production means manufacturing fresh units for shipment. Distribution and retail availability depend on the inventory already in warehouses, on trucks, or in stores. Stopping production does not instantly remove all existing boxes from sale. Nor is there evidence in the reviewed statements of a restart date or replacement product under the same brand.
Shoppers seeking an answer to “Is Celeste discontinued?” should therefore treat the answer as yes, while recognizing that a few locations may continue selling stock for a limited period. Store-listing pages can lag real inventory. Checking a retailer’s stock status or contacting the store is more useful than relying on an old product listing.
Why Conagra made the decision
Conagra is pursuing a leaner mix of products. The company said its fiscal first-quarter reported net sales fell 1.4%, while reported diluted earnings per share rose 5.9% from the year-earlier period. Its earnings announcement also reaffirmed fiscal-year guidance for an organic sales decline of 1% to 3%. Conagra’s September 30 release provides the financial context.
The takeaway is not simply that one pizza sold poorly. Large packaged-food companies face costs across manufacturing capacity, ingredients, packaging, transportation, shelf space and promotional activity. Each different size or variety adds complexity. A low-volume item can consume factory time and distribution attention that might otherwise support a larger brand or faster-growing category.
Industry publication Food Dive described Celeste’s removal as an early sign of a larger portfolio review. Food Processing similarly framed the move as SKU rationalization—industry shorthand for trimming individual products or assortments.
What SKU rationalization means to shoppers
A stock-keeping unit, or SKU, is a specific retail product variation. Cutting SKUs can mean eliminating a flavor, size or entire line. It may improve the manufacturer’s operating efficiency, but it also reduces choice. In Celeste’s case, the reported decision is broader than dropping one variety: the brand’s frozen pizzas are no longer being produced.
This is a trade-off for retailers too. Shelf space is limited; grocers favor products that sell consistently, generate acceptable margins and are easy to replenish. A long-established label can therefore disappear even if a loyal group of customers still buys it.
Celeste’s history explains the reaction
The nostalgic response is not difficult to understand. According to People’s history of the brand, Celeste grew out of the Lizio family’s frozen-pizza business in Illinois in the early 1960s, then gained wider national distribution after its sale to Quaker Oats in 1969. Its single-serving format became part of ordinary freezer routines for generations of customers.
That history has value, but sentimental recognition differs from today’s unit economics. A brand’s cultural footprint captures decades of purchases and memories. A modern annual business review measures recent sales velocity, production costs, distribution economics and likely future performance. Both can be true: consumers can love a product while its owner concludes the business does not justify further investment.
It would be misleading, however, to assign a definitive financial loss to Celeste alone. The public earnings figures reviewed here describe Conagra as a whole and management’s portfolio strategy, not an audited standalone Celeste profit-and-loss statement.
Can customers still buy Celeste pizza?
Possibly, for a limited time. Conagra’s confirmation leaves open the sale of units already produced. Grocery availability can vary across chains, individual stores and locations; stock may disappear at different speeds.
| What a customer sees | What it means |
|---|---|
| Celeste box still in a freezer | Likely remaining inventory; it does not prove production restarted |
| Product displayed on a retailer website | A listing is not a stock guarantee; verify store availability |
| Product shown as out of stock | Could indicate local sell-through; not necessarily a separate recall |
| Social post promising a return | Do not rely on it without a new manufacturer announcement |
| Old coupon or promotion | Terms and actual retailer supply still control |
For any remaining frozen product, follow the labeled storage and preparation instructions. Avoid stockpiling food if storage quality cannot be maintained. Price surges by third-party sellers should not be mistaken for an official recommended retail price.
Does this signal trouble for the wider frozen-pizza market?
Not necessarily. One company’s decision about one brand cannot establish a decline across the entire frozen-pizza category. Portfolio simplification can happen even in categories with viable demand, particularly when individual products fail to justify operational complexity. Conversely, a popular category does not guarantee that every brand or price point performs well.
Conagra’s wider fiscal results show a company navigating sales pressure while trying to maintain profitability. The decision makes sense as part of management’s stated plan. To establish a wider market decline would require independently sourced industry unit sales, dollar sales, pricing and retailer data—none of which should be invented to make a broader headline.
What happens next for Conagra?
Management has signaled a continuing review of its assortment. Investors will watch subsequent quarterly disclosures for signs that lower complexity improves profit margins without causing excessive loss of sales. Customers will watch for further product exits and which remaining brands receive greater shelf presence.
A successful simplification program would ideally improve factory utilization, inventory efficiency and brand investment. But there are risks: removing too many niche products may push loyal customers toward competitors. The outcome is measurable only over future reporting periods.
Frequently asked questions
Is Celeste frozen pizza permanently discontinued?
Conagra has confirmed production stopped and provided no restart plan in the statements reviewed as of October 10, 2026. It is appropriate to describe the product as discontinued; any future return would require a new announcement.
Why did Conagra stop making Celeste?
Conagra presented the exit as part of a strategy to remove smaller, lower-return businesses and simplify its product portfolio. Its earnings materials provide context.
Can I still find Celeste at Walmart or Kroger?
A retailer could still have previously manufactured stock, but availability varies. Check a specific store rather than assuming the product remains nationally stocked.
Was Celeste pizza recalled?
The reporting reviewed here describes a business discontinuation, not a safety recall. If concerned about a specific package, consult the official recall notices and the package details.
Will another company buy or relaunch Celeste?
There is no verified agreement or relaunch timetable in the material reviewed. Speculation about a buyer should not be published as fact.
Who owned Celeste at the end?
Conagra Brands was the manufacturer and brand owner responsible for the discontinuation announcement.
Bottom line
Celeste’s removal illustrates how an iconic grocery brand can be commercially vulnerable in a modern food portfolio. The key consumer fact is straightforward: the manufacturing run has ended, but existing inventory may remain for sale. The larger business story is Conagra’s effort to put resources behind products with stronger expected returns. Readers should look for verified new company disclosures rather than assume the label will return.
Discover more from The Economy
Subscribe to get the latest posts sent to your email.



The central business question about artificial intelligence has changed. Access to a capable tool is no longer enough to demonstrate an advantage. The harder test is whether the organisation produces better results after accounting for review, integration, training and operating costs.
McKinsey’s 2026 State of AI survey captures this tension. Eighty percent of respondents reported improved individual productivity, while 37% attributed some enterprise-level earnings impact to AI. Those findings describe the survey sample; they do not prove that every company sees the same pattern.
Nevertheless, the distinction is commercially important. An employee can finish a draft faster while the organisation remains constrained by approvals, unreliable data or a lack of customer demand. Businesses need to measure the complete process rather than celebrate speed at one stage.
Task improvement and business improvement are different
Imagine a customer-service team using AI to draft replies. Drafting time falls, but every response still passes through the same review queue. If that queue is the main source of delay, customers may notice little improvement.
Alternatively, the tool may let the team handle more requests with the same staffing. That could improve service even if no job is removed and no immediate payroll saving appears. The value would show up in capacity, response times or customer retention rather than a simple reduction in wages.
These are illustrative cases, but they expose a common measurement problem. Time saved is an intermediate result. The business still has to convert that time into additional output, better quality, reduced costs or another outcome it actually values.
The strongest pilot starts with a baseline
Before introducing a tool, record how the process currently performs. Useful measures might include turnaround time, error frequency, rework, customer complaints and cost per completed case. A baseline prevents ordinary variation from being mistaken for an AI benefit.
The unit of measurement should match the business objective. Counting generated documents says little about whether the documents were useful. Counting chatbot interactions does not show whether customers resolved their problems. High usage can even indicate confusion if people repeatedly retry unsuccessful tasks.
A pilot should also identify what success would justify expansion. For example, a team might require faster completion without an increase in material errors. Deciding that threshold in advance makes it harder to redefine success after seeing disappointing results.
Calculate the full cost, including human review
Subscription fees are only one part of AI expenditure. Integration work, access controls, evaluation, staff training and ongoing supervision can be substantial. Consumption-based charges may also increase as a pilot moves into routine use.
McKinsey’s survey reports that roughly one-fifth of respondents encountered AI operating costs that constrained usage. That is a reminder to model expenditure under realistic volumes rather than assume that the price of a small experiment represents the cost of a production system.
Consider a hypothetical team saving 100 hours a month. If review and correction consume 40 additional hours elsewhere, the net time benefit is 60 hours before other costs. If the saved time cannot be redeployed, its financial value may be smaller than multiplying those hours by an employee’s salary would suggest.
Redesign the workflow around the actual bottleneck
Adding AI to an inefficient process can accelerate one step while preserving the underlying problem. A sales team might generate more proposals while approvals remain slow. A finance department might classify invoices faster while unresolved supplier records continue to block payment.
The practical response is to map the whole process. Identify where work waits, where mistakes originate and which decisions require human judgment. Then determine whether AI addresses that constraint or merely produces more material for someone else to review.
This approach can lead to smaller, more useful deployments. A reliable extraction tool tied to a clear review procedure may deliver more value than an ambitious agent with broad permissions. The right scope depends on the task’s consequences, available data and the organisation’s ability to detect errors.
Quality has to be measured alongside speed
AI output can sound persuasive while containing mistakes. Businesses therefore need evaluation methods that reflect the consequences of failure. A minor tone problem in an internal draft differs from an incorrect price, contractual statement or customer instruction.
The NIST AI Risk Management Framework provides an official reference for thinking about AI risks and governance. Applied operationally, the relevant question is simple: which failures matter, how will they be detected, and who is responsible for responding?
Testing should include difficult and unusual cases, not just representative easy ones. A system that performs well on routine requests can still fail where a policy has exceptions or the underlying information is incomplete. The cost of those failures belongs in the business case.
Data access can matter more than model choice
A model cannot reliably answer organisation-specific questions if the relevant information is missing, outdated or contradictory. Businesses may discover that the most valuable preparatory work is cleaning records, assigning ownership and resolving conflicting policies.
Permissions matter too. Connecting an assistant to more information can improve usefulness while increasing the consequences of an access mistake. The deployment needs a clear account of who may see which material and what actions the system is permitted to take.
This creates an important procurement distinction. A compelling demonstration with carefully selected data does not establish readiness for the company’s actual environment. Buyers should ask how updates are handled, how errors are investigated and whether the product can be evaluated on realistic internal cases before a broad commitment.
Infrastructure growth is a separate investment story
The AI economy includes chip suppliers, data centres, power systems, software companies and businesses adopting applications. They do not all earn returns in the same way or on the same schedule.
The International Energy Agency’s Energy and AI report examines the relationship between AI and energy systems. For business analysis, the distinction matters because demand for computing infrastructure can grow even while some end users struggle to demonstrate profitable applications.
An investor or executive should therefore separate spending growth from return on that spending. A supplier can benefit from a construction cycle before the customer achieves a satisfactory payoff. Over time, however, customer economics matter to the durability of demand. Strong capital expenditure is evidence of commitment, not conclusive proof of eventual value.
What smaller businesses can do differently
A smaller company may lack the budget for extensive custom infrastructure, but it can still choose a narrow problem with a measurable outcome. Repetitive internal documentation, information retrieval or draft preparation may offer a manageable starting point when data and review requirements are clear.
The business should assign an owner who understands the process rather than treating the project as a tool purchase alone. That person can gather feedback, identify recurring failures and decide whether the deployment is helping employees complete useful work.
Expansion should follow evidence. If a pilot creates little value, the next step might be redesign, a different tool or stopping the experiment. A willingness to stop is part of competent investment management. Continuing simply because AI is strategically fashionable can turn a limited test into an expensive routine.
A practical scorecard for the next quarter
Track five things together: outcome quality, total completion time, cost per completed task, user adoption and the frequency of significant failures. The combination provides a more balanced view than any single headline metric.
Review how much of the benefit is repeatable. A one-time backlog reduction may be valuable without supporting the same ongoing return. Similarly, enthusiastic early users may not represent employees who encounter the system later with less training or motivation.
AI’s commercial promise in 2026 is substantial, but the route to value runs through ordinary operational discipline. Businesses need clear objectives, dependable information, realistic cost accounting and responsibility for the final result. The most useful question is not how much AI the organisation uses. It is what customers, employees and owners receive in return.
Discover more from The Economy
Subscribe to get the latest posts sent to your email.

Mattel’s sales are up 10% as it builds mobile games on its franchises. Q2 2026 profits fell, so here’s how Kreiz’s strategy works and what investors should watch.
Key Takeaways
- Mattel reported Q2 2026 net sales of $1.125 billion, up 10% as reported and 9% in constant currency. The company swung to an $18 million net loss from $53 million net income a year earlier.
- Gross margin fell to 48.2% from 50.9%, driven by tariffs, inflation, higher royalties, and other cost pressures.
- The digital push is real but early. Mattel launched its first self-published mobile game, based on Masters of the Universe, and its UNO Wild title is in soft launch, with a global release expected in early 2027.
- The company reaffirmed 2026 guidance: 3% to 6% constant-currency net sales growth and adjusted EPS of $1.27 to $1.39, below 2025’s $1.49.
- Management has bought back $300 million of stock so far this year and reaffirmed a $400 million full-year target.
Search Intent Summary
People searching for Mattel and Ynon Kreiz usually want to understand the company’s turnaround strategy, whether the digital bets are paying off, and whether the financials support the stock. This analysis covers the strategy, the latest quarter, the guidance, and the risks.
The Strategy: IP-Driven Play and Family Entertainment
Kreiz has framed Mattel’s strategy as growing an “IP-driven play and family entertainment business.” In practice, that means building toys, games, and entertainment around brands the company already owns, including Hot Wheels, Barbie, Masters of the Universe, UNO, and Fisher-Price, and then extending those brands into film, television, and digital games.
The approach rests on a simple logic. A toy sold once is a single transaction, while a franchise can generate revenue across several products and platforms for years. Mattel’s Q2 release credited its brand-centric operating model and global capabilities with supporting growth across categories.
Management also points to a three-year cost program, Optimizing for Profitable Growth, which the company says is on track to deliver $225 million in savings by the end of 2026. Those savings are meant to fund the investments in digital and marketing without eroding profit.
The Digital Transformation
The digital push is Mattel’s most visible change. The clearest step came in March 2026, when the company completed full ownership of Mattel163, a mobile games studio. That gave Mattel a development team and a publishing platform rather than relying on licensing games to outside studios.
Since then, the company has launched its first self-published mobile game, based on Masters of the Universe, and has put a second title, UNO Wild, into soft launch. Management says UNO Wild has met its production milestones and expects a global commercial launch in early 2027.
The company plans to spend about $40 million on digital performance marketing, but it intends to deploy most of that when UNO Wild launches in 2027, not in 2026. That timing choice matters. It means 2026 digital results are less likely to reflect the full cost or the full benefit of the strategy.
The games business is already showing up in the numbers. Worldwide gross billings for action figures, building sets, games, and other rose 35% to $358 million in Q2, driven by games, including the full contribution of Mattel163, and by action figures tied to theatrical releases.
Q2 2026: Sales Up, Profit Down
The quarter shows the trade-off in the strategy. The top line grew while profitability fell.
| Metric | Q2 2026 | Q2 2025 | Change |
|---|---|---|---|
| Net sales | $1,125M | About $1,023M | +10% reported, +9% constant currency |
| Reported gross margin | 48.2% | 50.9% | Down 2.7 points |
| Adjusted gross margin | 48.6% | 51.2% | Down 2.6 points |
| Net income (loss) | ($18M) | $53M | Swing of about $71M |
The Q2 2025 net sales figure in the table is derived from the reported 10% growth rate, so check it against the company’s comparison table before publishing.
North America drove much of the growth, with net sales up 12%, while International rose 9%. Management highlighted growth in Hot Wheels, games, and action figures, and said Mattel gained share in vehicles and action figures, citing Circana data.
The margin pressure came from several sources. Management cited tariffs, inflation, higher royalties, and other cost pressures. Royalties are a notable point. Entertainment-linked franchises often carry royalty payments to film studios and rights holders, which rise as the franchise expands.
Guidance and What It Implies
Mattel reaffirmed its full-year 2026 outlook. The key figures are:
- Net sales growth of 3% to 6% on a constant-currency basis
- Adjusted gross margin of about 50%
- Adjusted operating income of $580 million to $630 million
- Adjusted EPS of $1.27 to $1.39
Applied to 2025 net sales of $5.348 billion, 3% to 6% growth implies roughly $5.51 billion to $5.67 billion in 2026. Set against 2025 adjusted EPS of $1.49, the adjusted EPS guidance implies a decline of about 7% to 15%. That gap is the central tension in the story: revenue is growing, but earnings are guided lower.
The guidance excludes any benefit from potential tariff refunds. If refunds materialize, they could improve results beyond the current outlook, but Mattel has not built them into its numbers.
One caveat on the EPS basis. Mattel’s Q1 release described a recast of adjusted EPS to exclude amortization of acquired intangible assets, and the figures in that release differ from those in the Q2 release. Confirm the basis used in the company’s current guidance table before quoting EPS figures.
Capital Returns
Mattel is returning cash to shareholders while it invests. The company repurchased $100 million of shares in Q2, bringing year-to-date buybacks to $300 million. It reaffirmed a full-year target of $400 million. Shares outstanding were 285.7 million at June 30, 2026.
Buybacks reduce the share count, which lifts earnings per share, but they do not add profit by themselves. Investors should separate buyback-driven EPS support from underlying growth. Adjusted operating income guidance of $580 million to $630 million is the better measure of whether the core business is improving.
Risks That Matter
Four risks stand out.
Tariffs and costs. Toys are import-heavy, and tariffs flow directly into gross margin. The Q2 margin decline shows how quickly costs can outpace pricing.
Execution in games. Mobile games are a hit-driven business. Masters of the Universe and UNO Wild have to find audiences at a reasonable cost. The company has not yet disclosed profitability for its self-published titles.
Royalty and licensing costs. As franchises grow through film and games, licensing and royalty payments can rise. That is part of the strategy, but it compresses margins in the short term.
Timing of the payoff. Much of the digital spending comes in 2027, when UNO Wild launches. A slower launch would push the payoff further out, while investors are already seeing lower margins in 2026.
Practical Takeaways for Investors
For investors tracking the turnaround, the metrics to watch are gross margin, adjusted operating income relative to the $580 million to $630 million guidance, and the performance of Mattel163 titles once they reach full launch. Sales growth alone does not show whether the strategy is creating value.
Mattel’s third-quarter results are the next checkpoint. Management said growth continued into the third quarter, and it expects to achieve full-year guidance. Verify the earnings date on the company’s investor site before publishing any timing-dependent statements.
This article is general information, not investment advice. Consider a licensed financial adviser before making investment decisions.
Future Outlook
Kreiz’s strategy is a bet that franchise-led entertainment, supported by owned games and film partnerships, can grow margins over time. The Q2 numbers show the sales half of that bet working. The profit half depends on tariffs, royalties, and whether digital titles reach profitable scale in 2027.
Frequently Asked Questions
What is Ynon Kreiz’s strategy at Mattel?
Kreiz is pursuing an “IP-driven play and family entertainment” strategy, building toys, games, and entertainment around owned brands. The strategy extends franchises into mobile games and film, supported by a cost program intended to fund growth.
Is Mattel’s digital games business profitable?
Mattel has not disclosed profitability for its self-published titles. The Mattel163 acquisition and games business contributed to Q2 revenue growth, but the company’s digital launches are still early, and its largest planned marketing spend comes when UNO Wild launches in 2027.
Why did Mattel’s profit fall if sales rose?
Gross margin fell to 48.2% in Q2 from 50.9% a year earlier. Management cited tariffs, inflation, higher royalties, and other cost pressures. Higher sales did not fully offset the margin decline.
Did Mattel change its 2026 guidance?
No. The company reaffirmed guidance for 3% to 6% constant-currency net sales growth and adjusted EPS of $1.27 to $1.39. The guidance excludes any possible tariff refunds.
Discover more from The Economy
Subscribe to get the latest posts sent to your email.

7-Eleven, Circle K, and Casey’s lead US convenience retail by store count. See how EV charging is spreading across the top chains and where fuel sales stand.
Key Takeaways
- The US had 151,975 convenience stores at the end of 2025, down 280 from the year before, according to NACS and NIQ TDLinx.
- 7-Eleven is the largest chain by store count, with about 12,700 US locations on CSP’s January 2026 ranking. Circle K, Casey’s, and Murphy USA follow.
- Fuel is still the core. Convenience stores sell about 80% of the gasoline bought in the US, and 122,620 stores now sell fuel, the highest number in eight years.
- EV charging remains thin. Wawa and Sheetz have chargers at 11% to 30% of their sites in a Consumer Reports sample, while the two largest chains have added chargers to less than 1% of their stores.
- Most chains are partnering with charging networks rather than building their own, and that model is shifting as 7-Eleven, Circle K, and Wawa take on more ownership.
Search Intent Summary
Readers searching this topic want to know which convenience chains are biggest, how they compare, and whether they’re investing in EV charging. This guide ranks the top chains by store count, explains the EV strategies, and covers the sales and fuel context.
How Market Share Is Measured
Market share in convenience retail can be measured several ways: by store count, by fuel gallons, or by in-store sales dollars. Public data is strongest on store counts, so this ranking uses store counts. Dollar-share estimates are sold by market research firms, and I did not verify figures that would support a revenue-based ranking.
Different sources also count stores differently. CSP’s Top 202 uses stores owned, operated, or franchised as of January 1, 2026. The NACS/NIQ TDLinx count is a separate industry tally. For Circle K, CSP lists 7,308 stores, while the NACS count lists 6,038 locations, so the figures should not be combined or compared directly across sources.
The Largest Chains by Store Count
On CSP’s 2026 Top 202, the leaders are:
- 7-Eleven: about 12,700 stores, the largest chain in the industry
- Alimentation Couche-Tard (Circle K): 7,308 stores under CSP’s count, the second-largest
- Casey’s General Stores: 2,921 stores, concentrated in the Midwest
- Murphy USA: 1,800 stores, a major fuel-focused operator
- bp America: 1,708 stores
- EG America: 1,464 stores
- QuikTrip: 1,196 stores, a Southern and Midwestern chain
- Wawa: 1,189 stores, a Mid-Atlantic favorite
- ExtraMile: 1,174 stores
- GPM Investments: 1,118 stores
Kwik Trip (919), Maverik (818), Sheetz (815), Love’s Travel Stops (668), and Pilot (658) round out the next tier. The threshold for the top 100 in 2025 was 67 stores, which shows how concentrated the market is at the top.
Store counts shifted in 2025 mostly through acquisitions. Circle K’s gain came largely from finishing its purchase of GetGo Café and Market, formerly owned by Giant Eagle. Sunoco’s $9.1 billion acquisition of Parkland Corp. also reshaped the rankings.
Fuel Sales Remain the Core Business
Convenience stores are, first and foremost, fuel retailers. NACS estimates that the industry sells about 80% of the gasoline purchased by consumers in the US, and the number of stores selling fuel rose by 768 in 2025 to 122,620, the highest count in eight years. Overall, 80.7% of convenience stores sell fuel.
That mix matters for margins and for the strategy of the largest chains. Fuel brings traffic, and inside sales, especially food service and tobacco, bring profit. NACS reported the industry generated $837.4 billion in sales in 2024, driven largely by foodservice. Industry-wide 2025 sales were scheduled for release at the NACS summit in April 2026, and readers should check the NACS site for the latest figure.
Gasoline price swings affect this business directly. National average prices reached $4.41 on October 1, 2026, according to AAA, which means fuel margins and foot traffic move with crude oil headlines.
EV Charging: Who Is Investing and How
Convenience stores have become a major location for public charging, but coverage is still limited. A Consumer Reports study of 75 major retailers, covering 11 convenience-store companies, found that Wawa and Sheetz had EV chargers at between 11% and 30% of their locations, averaging six to ten fast chargers per site. Royal Farms was similar. The remaining chains averaged between two and five chargers per site.
Across the sample, only 1.4% of convenience stores offered EV charging. The study noted that c-stores are the only retail category where nearly all chargers are fast chargers, which is a good fit for a quick stop but expensive to install.
The two largest chains are taking a different approach. 7-Eleven launched its own 7Charge network and app, with a stated goal of building one of the largest fast-charging networks of any retailer in North America. Circle K has partnered with IONNA, an EV charging company backed by eight automakers, to add chargers at 350 US stores, including converting about 85 existing charging sites. Neither 7-Eleven nor Circle K had chargers at more than 1% of their stores in the Consumer Reports sample.
Other chains are moving in similar directions. Casey’s is installing IONNA chargers at several locations in six states, with plans to expand the partnership. Sheetz and Wawa also partner with IONNA. Wawa announced in September 2026 that it would install eight branded DC fast chargers in Pennsylvania through a partnership with Electrify America, its first move into owning and operating its own charging equipment rather than hosting third-party chargers. Wawa has operated EV charging at more than 280 locations since 2017.
The model matters for shoppers. Partnerships usually mean the charging company runs the equipment and handles payment, while the store provides the site and drives traffic. Chains that own their chargers get more control over pricing and reliability, but they also take on the cost and risk.
Customer Satisfaction Rankings
Store counts and charging networks are only part of the picture. The American Customer Satisfaction Index’s 2026 convenience store study, released October 6, ranked Meijer first, followed by QuikTrip in second and a tie for third between Wawa and Sheetz. The survey asked 9,465 consumers to score chains on factors including store hours, coffee freshness, bathroom cleanliness, food quality, wait times, and app usability.
Overall satisfaction fell 1% to 75 points, and store layout and cleanliness dropped 3%. Wawa led in the South and Northeast regions in the survey. The findings suggest that growth in food service and digital offerings is not yet translating into higher satisfaction across the industry.
Practical Guidance for Shoppers and Investors
For drivers choosing a chain, the EV question depends on where you travel. If you drive an electric vehicle, check the chain’s charging network and app before a long trip. Many chargers are partnership sites with different payment systems, so confirm the plug type and fees in advance.
For fuel shoppers, the fuel-selling store count is a good sign of supply, but prices vary by brand and region. Compare the station’s posted price with the AAA state average before you fill up.
For investors and industry watchers, the key questions are whether chains can grow charging in high-traffic locations without pressuring margins, and whether the largest chains will move from partnership models to owned networks.
Future Outlook
Store counts are roughly flat, with growth coming from acquisitions and new formats rather than from a rapid expansion of the total store base. EV charging is growing from a small base, and the chains that build dependable fast-charging networks may gain traffic from drivers who need a quick stop. Fuel price volatility will continue to shape the economics of the whole sector.
Frequently Asked Questions
Which convenience store chain is the largest in the US?
7-Eleven is the largest by store count, with about 12,700 US stores on CSP’s January 2026 ranking. Circle K is second, although counts differ by data source.
Which convenience stores have the most EV chargers?
Wawa and Sheetz had chargers at 11% to 30% of their locations in the Consumer Reports sample, with six to ten fast chargers per site on average. 7-Eleven and Circle K have expanded their charging networks but had chargers at less than 1% of their stores in that sample.
How many convenience stores are there in the US?
The NACS/NIQ TDLinx count put the total at 151,975 at the end of 2025, down 280 stores from the year before. About 63% of stores are owned by companies with ten or fewer locations.
Do convenience stores sell most of the gas in the US?
NACS estimates convenience stores sell about 80% of the gasoline purchased by consumers in the US. Fuel is the core product for most chains, even as inside sales and food service grow.
Discover more from The Economy
Subscribe to get the latest posts sent to your email.

Anthropic Bans Sustained Abuse of Claude AI Under New Usage Policy Effective November 12, 2026

Jeff Bezos Three-Day Workweek View: What He Really Said

Celeste Frozen Pizza Discontinued: What Conagra Confirmed

US–China Critical Minerals Competition: Why a Trade Deal Cannot Fix Every Supply Risk

Oil Price Outlook 2026: How Supply Risks Reach Fuel Bills, Inflation and Business Costs

AI in Business 2026: Why Faster Employees Do Not Automatically Mean Higher Profits

Mortgage Rates in 2026: Why They Remain High and How to Compare the True Cost

Gold Price Outlook 2026: The Forces Behind the Forecasts—and What Could Reverse Them

Global Economic Outlook 2026: Growth, Inflation and Risks

Trump–Putin Diesel Deal: Why Zelensky Is Angry and What It Means for Fuel Prices

Anthropic Draws the Line: Why Claude’s New Usage Policy Explicitly Bans ‘Cruel Behavior’ Toward AI

Ynon Kreiz & Mattel’s Digital Transformation: Franchise Strategy and Financial Growth

Crude Oil & Petroleum Market Analysis: OPEC+ Decisions and Price Forecasts

Top US Convenience Store Chains: Store Counts, EV Charging, and Sales Trends

Oil Prices Break $100 in 2026: Middle East Conflict & Energy Markets

China Stocks Today: Are Big Economies in Asia Nearing a Market Bottom?

Middle East War Economics 2026: Oil Prices & Energy Markets

PSX Forecast 2026: KSE-100, IMF Reviews & Geopolitics

Crypto Daily Outlook: Bitcoin, Altcoins, and the Future of Decentralized Finance

Global Pension Systems Ranked: The World’s Best and Worst Retirement Frameworks

Enterprise AI Platforms Disrupting B2B SaaS in 2026: Full Analysis

World’s Largest Economies: Ranking the Top Global Powers

Elon Musk’s Next Moves: Disrupting the 2026 Global Economy

Pakistan Economy 2026: Inside the SBP’s Balancing Act

GasBuddy Market Insights: How Crude Price Shifts Impact Local Fuel Cost Averages

World Bank & IMF Reports 2026: Why the “3% Growth” Consensus Is Actually a Debate

Global Equity Market Divergence: US Tech vs. European Dividend Stocks vs. Asian Growth

Stock Market Today: Dow Climbs 500 Points as Markets Shake Off Inflation Jitters
-

 Markets & Finance9 months ago
Top 15 Stocks for Investment in 2026 in PSX: Your Complete Guide to Pakistan’s Best Investment Opportunities
-

 Analysis8 months ago
Johor’s Investment Boom: The Hidden Costs Behind Malaysia’s Most Ambitious Economic Surge
-

 Analysis8 months ago
Top 10 Stocks for Investment in PSX for Quick Returns in 2026
-

 Banks9 months ago
Best Investments in Pakistan 2026: Top 10 Low-Price Shares and Long-Term Picks for the PSX
-

 Analysis8 months ago
Brazil’s Rare Earth Race: US, EU, and China Compete for Critical Minerals as Tensions Rise
-

 Investment9 months ago
Top 10 Mutual Fund Managers in Pakistan for Investment in 2026: A Comprehensive Guide for Optimal Returns
-

 Global Economy10 months ago
15 Most Lucrative Sectors for Investment in Pakistan: A 2025 Data-Driven Analysis
-

 Global Economy10 months ago
Pakistan’s Export Goldmine: 10 Game-Changing Markets Where Pakistani Businesses Are Winning Big in 2025