
Global Economy
How to Find Google Maps Fuel Prices and Save on Every Fill-Up

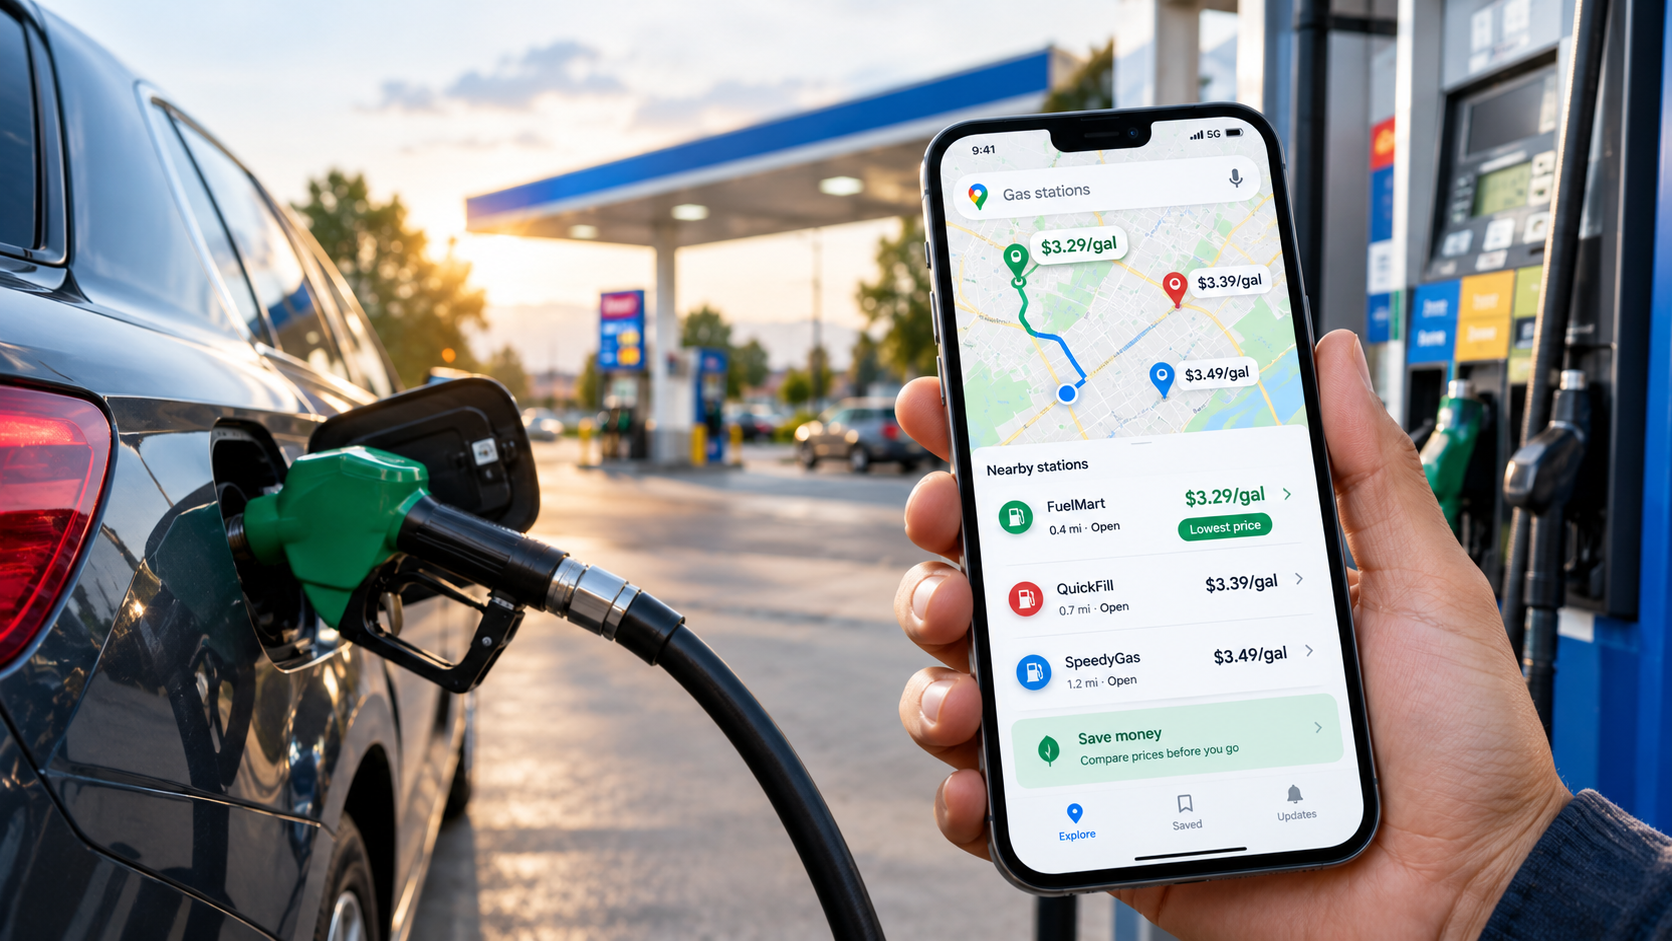
Google Maps shows gas prices at nearby stations, but its data isn’t truly real-time. Here’s how to use the feature, check accuracy, and cut fuel costs.
Key Takeaways
- Google Maps lists gas prices for nearby stations on Android, iOS, and desktop. Tap the gas option, or search “gas” in the search bar.
- Prices come from Google, not from drivers. Users cannot edit them, so accuracy depends on how quickly stations’ prices reach Google.
- Google says its fuel data is updated every 24 hours, so it cannot show the price at a pump at this moment.
- The US national average was $4.41 a gallon on October 1, 2026, according to AAA, up from $3.16 a year earlier. Savings matter more now than they did a year ago.
- Combine the map with AAA’s price tracker and the eco-friendly route setting to find cheaper fill-ups and trips.
Search Intent Summary
People searching this topic want to find the cheapest gas nearby and to know whether the prices they see are trustworthy. This guide shows how the feature works, where its data comes from, and how to use it alongside other sources.
A Note on “Real-Time” Fuel Prices
The phrase “real-time” overstates what Google Maps offers. Google’s Maps prices are shown by Google and are not user-editable. A reviewer testing the feature in 2025 found that major brands such as BP, Shell, and Speedway matched GasBuddy and the stations’ own prices, but some stations updated slowly, especially for grades other than regular, and some stations showed no prices at all.
A Google spokesperson also told a local TV station that the app’s data is updated every 24 hours. Prices can therefore lag behind what a station posts on its sign, and a price shown in the morning may be out of date by afternoon. Treat the map as a comparison tool for finding the cheaper area, then confirm the price at the pump.
How to Find Gas Prices on Your Phone
On Android and iOS, open Google Maps and tap the gas tile under the search bar. The app will show stations near you. Tap a station to see its details, including the listed price.
To look farther away, move the map to a new area and tap “Search this area.” Not every station displays a price, so you may need to scroll through the list. Tapping “View list” lets you compare several stations at once, which is faster than checking pins one by one.
If you already know which station you want, search for its name and tap its listing. The price appears in the station’s details, and you can see how far it is from your location.
How to Find Gas Prices on Desktop
On desktop, search for “gas” or “gas stations near me.” The station icons appear on the map, but prices are not always displayed next to the pins. Click a station to open its information panel, where the price is shown.
Desktop is useful for planning. If you are leaving for a trip, search the destination town or your route’s stops before you leave, so you can decide where to fill up.
Comparing Prices Without Getting Fooled
A cheap-looking price can still cost you more if the station is out of your way. Before choosing a station, check three things.
Distance matters. A five-cent saving on a station two miles away may not be worth the detour. Work out the difference on your tank size: a $0.20 gap on a 15-gallon fill-up is $3.00, which may or may not cover the extra driving.
Grade matters. Some stations show prices for regular only. Premium or diesel prices may be missing or slower to update.
Timing matters. Prices often change through the day, and stations may raise prices after a wholesale increase. Check the map in the morning, then confirm at the pump.
Cross-Check With Trusted Sources
For a reliable benchmark, check the AAA gas price tracker, which publishes daily national and state averages. On October 1, 2026, AAA reported a national average of $4.41 for regular unleaded, down about 7 cents from the previous week. September’s monthly average of $4.33 was the highest September figure on record. AAA attributed the easing to crude oil prices dipping back into the $90 range.
The Energy Information Administration publishes weekly retail gasoline prices, which are useful for tracking longer trends. A station’s price is best confirmed at the station itself, but these sources tell you whether the price you are seeing is high or low for your area.
Crowd-sourced apps such as GasBuddy can add station-level detail, but their data is user-submitted, so compare it against Google Maps and the station’s sign.
Use the Eco Route to Cut Fuel Use
Fuel costs depend on how much you burn, not just what you pay per gallon. Google Maps offers an eco-friendly route option that favors more fuel-efficient driving. The eco option is on by default for many users, so check that it is still enabled before you plan a trip.
Google has said that a fuel-efficient route typically adds one to two minutes to a trip and can save five to ten percent on gas. The savings depend on traffic, road type, and the vehicle, so treat the figure as an estimate.
A simple example shows the scale. Suppose a 300-mile trip in a car that gets 25 miles per gallon. That uses 12 gallons, or about $53 at $4.41 a gallon. A 5 to 10 percent saving is roughly $2.65 to $5.30. Those are hypothetical numbers, but they show that a short detour and a route change can add up across a year of driving.
Practical Strategy for Saving on Gas
Start with the map to find the cheapest station in your area. Confirm the price with the station’s sign before filling up, since the map can lag behind changes.
Compare prices in clusters rather than single stations. If several stations near a highway interchange charge less than the rest, that is a stronger signal than one outlier.
Use the eco route on longer trips, and avoid detours that cost more in fuel than they save at the pump. For a regular commute, the cheapest station on your route is often the best choice.
Keep an eye on the AAA and EIA averages. If your local price is well above the national average, you may be able to save by filling up at a station in a different city or zone.
Future Outlook
Gas prices are tied to crude oil, and crude is tied to the conflict affecting shipping routes in the Middle East. Prices have risen sharply this year, and they have also eased at times. The most useful habit is checking prices regularly rather than waiting for a spike to appear, since station prices can move quickly in both directions.
Frequently Asked Questions
Is Google Maps gas price data real-time?
No. Google says its fuel data is updated every 24 hours, and some stations’ prices update more slowly than others. Use the map to compare nearby options, then confirm the price at the station.
Why do some gas stations not show prices on Google Maps?
Not every station displays a price. Stations may not share prices with Google, or the data may be missing for certain fuel grades. Check the station directly or use a second source.
Can I edit a gas station’s price on Google Maps?
No. Prices on Google Maps are controlled by Google and cannot be edited by users. If a price looks wrong, the station’s posted price at the pump is the most reliable source.
Does the eco route really save gas?
Google says an eco route can save five to ten percent on fuel with a small extra travel time. Actual savings depend on traffic, road conditions, and your vehicle. It is a useful default, but it is not a guarantee.
Discover more from The Economy
Subscribe to get the latest posts sent to your email.


7-Eleven, Circle K, and Casey’s lead US convenience retail by store count. See how EV charging is spreading across the top chains and where fuel sales stand.
Key Takeaways
- The US had 151,975 convenience stores at the end of 2025, down 280 from the year before, according to NACS and NIQ TDLinx.
- 7-Eleven is the largest chain by store count, with about 12,700 US locations on CSP’s January 2026 ranking. Circle K, Casey’s, and Murphy USA follow.
- Fuel is still the core. Convenience stores sell about 80% of the gasoline bought in the US, and 122,620 stores now sell fuel, the highest number in eight years.
- EV charging remains thin. Wawa and Sheetz have chargers at 11% to 30% of their sites in a Consumer Reports sample, while the two largest chains have added chargers to less than 1% of their stores.
- Most chains are partnering with charging networks rather than building their own, and that model is shifting as 7-Eleven, Circle K, and Wawa take on more ownership.
Search Intent Summary
Readers searching this topic want to know which convenience chains are biggest, how they compare, and whether they’re investing in EV charging. This guide ranks the top chains by store count, explains the EV strategies, and covers the sales and fuel context.
How Market Share Is Measured
Market share in convenience retail can be measured several ways: by store count, by fuel gallons, or by in-store sales dollars. Public data is strongest on store counts, so this ranking uses store counts. Dollar-share estimates are sold by market research firms, and I did not verify figures that would support a revenue-based ranking.
Different sources also count stores differently. CSP’s Top 202 uses stores owned, operated, or franchised as of January 1, 2026. The NACS/NIQ TDLinx count is a separate industry tally. For Circle K, CSP lists 7,308 stores, while the NACS count lists 6,038 locations, so the figures should not be combined or compared directly across sources.
The Largest Chains by Store Count
On CSP’s 2026 Top 202, the leaders are:
- 7-Eleven: about 12,700 stores, the largest chain in the industry
- Alimentation Couche-Tard (Circle K): 7,308 stores under CSP’s count, the second-largest
- Casey’s General Stores: 2,921 stores, concentrated in the Midwest
- Murphy USA: 1,800 stores, a major fuel-focused operator
- bp America: 1,708 stores
- EG America: 1,464 stores
- QuikTrip: 1,196 stores, a Southern and Midwestern chain
- Wawa: 1,189 stores, a Mid-Atlantic favorite
- ExtraMile: 1,174 stores
- GPM Investments: 1,118 stores
Kwik Trip (919), Maverik (818), Sheetz (815), Love’s Travel Stops (668), and Pilot (658) round out the next tier. The threshold for the top 100 in 2025 was 67 stores, which shows how concentrated the market is at the top.
Store counts shifted in 2025 mostly through acquisitions. Circle K’s gain came largely from finishing its purchase of GetGo Café and Market, formerly owned by Giant Eagle. Sunoco’s $9.1 billion acquisition of Parkland Corp. also reshaped the rankings.
Fuel Sales Remain the Core Business
Convenience stores are, first and foremost, fuel retailers. NACS estimates that the industry sells about 80% of the gasoline purchased by consumers in the US, and the number of stores selling fuel rose by 768 in 2025 to 122,620, the highest count in eight years. Overall, 80.7% of convenience stores sell fuel.
That mix matters for margins and for the strategy of the largest chains. Fuel brings traffic, and inside sales, especially food service and tobacco, bring profit. NACS reported the industry generated $837.4 billion in sales in 2024, driven largely by foodservice. Industry-wide 2025 sales were scheduled for release at the NACS summit in April 2026, and readers should check the NACS site for the latest figure.
Gasoline price swings affect this business directly. National average prices reached $4.41 on October 1, 2026, according to AAA, which means fuel margins and foot traffic move with crude oil headlines.
EV Charging: Who Is Investing and How
Convenience stores have become a major location for public charging, but coverage is still limited. A Consumer Reports study of 75 major retailers, covering 11 convenience-store companies, found that Wawa and Sheetz had EV chargers at between 11% and 30% of their locations, averaging six to ten fast chargers per site. Royal Farms was similar. The remaining chains averaged between two and five chargers per site.
Across the sample, only 1.4% of convenience stores offered EV charging. The study noted that c-stores are the only retail category where nearly all chargers are fast chargers, which is a good fit for a quick stop but expensive to install.
The two largest chains are taking a different approach. 7-Eleven launched its own 7Charge network and app, with a stated goal of building one of the largest fast-charging networks of any retailer in North America. Circle K has partnered with IONNA, an EV charging company backed by eight automakers, to add chargers at 350 US stores, including converting about 85 existing charging sites. Neither 7-Eleven nor Circle K had chargers at more than 1% of their stores in the Consumer Reports sample.
Other chains are moving in similar directions. Casey’s is installing IONNA chargers at several locations in six states, with plans to expand the partnership. Sheetz and Wawa also partner with IONNA. Wawa announced in September 2026 that it would install eight branded DC fast chargers in Pennsylvania through a partnership with Electrify America, its first move into owning and operating its own charging equipment rather than hosting third-party chargers. Wawa has operated EV charging at more than 280 locations since 2017.
The model matters for shoppers. Partnerships usually mean the charging company runs the equipment and handles payment, while the store provides the site and drives traffic. Chains that own their chargers get more control over pricing and reliability, but they also take on the cost and risk.
Customer Satisfaction Rankings
Store counts and charging networks are only part of the picture. The American Customer Satisfaction Index’s 2026 convenience store study, released October 6, ranked Meijer first, followed by QuikTrip in second and a tie for third between Wawa and Sheetz. The survey asked 9,465 consumers to score chains on factors including store hours, coffee freshness, bathroom cleanliness, food quality, wait times, and app usability.
Overall satisfaction fell 1% to 75 points, and store layout and cleanliness dropped 3%. Wawa led in the South and Northeast regions in the survey. The findings suggest that growth in food service and digital offerings is not yet translating into higher satisfaction across the industry.
Practical Guidance for Shoppers and Investors
For drivers choosing a chain, the EV question depends on where you travel. If you drive an electric vehicle, check the chain’s charging network and app before a long trip. Many chargers are partnership sites with different payment systems, so confirm the plug type and fees in advance.
For fuel shoppers, the fuel-selling store count is a good sign of supply, but prices vary by brand and region. Compare the station’s posted price with the AAA state average before you fill up.
For investors and industry watchers, the key questions are whether chains can grow charging in high-traffic locations without pressuring margins, and whether the largest chains will move from partnership models to owned networks.
Future Outlook
Store counts are roughly flat, with growth coming from acquisitions and new formats rather than from a rapid expansion of the total store base. EV charging is growing from a small base, and the chains that build dependable fast-charging networks may gain traffic from drivers who need a quick stop. Fuel price volatility will continue to shape the economics of the whole sector.
Frequently Asked Questions
Which convenience store chain is the largest in the US?
7-Eleven is the largest by store count, with about 12,700 US stores on CSP’s January 2026 ranking. Circle K is second, although counts differ by data source.
Which convenience stores have the most EV chargers?
Wawa and Sheetz had chargers at 11% to 30% of their locations in the Consumer Reports sample, with six to ten fast chargers per site on average. 7-Eleven and Circle K have expanded their charging networks but had chargers at less than 1% of their stores in that sample.
How many convenience stores are there in the US?
The NACS/NIQ TDLinx count put the total at 151,975 at the end of 2025, down 280 stores from the year before. About 63% of stores are owned by companies with ten or fewer locations.
Do convenience stores sell most of the gas in the US?
NACS estimates convenience stores sell about 80% of the gasoline purchased by consumers in the US. Fuel is the core product for most chains, even as inside sales and food service grow.
Discover more from The Economy
Subscribe to get the latest posts sent to your email.
Fintech & Global Finance
Global Market Outlook: Navigating Interest Rates, Inflation, and Commodity Spikes
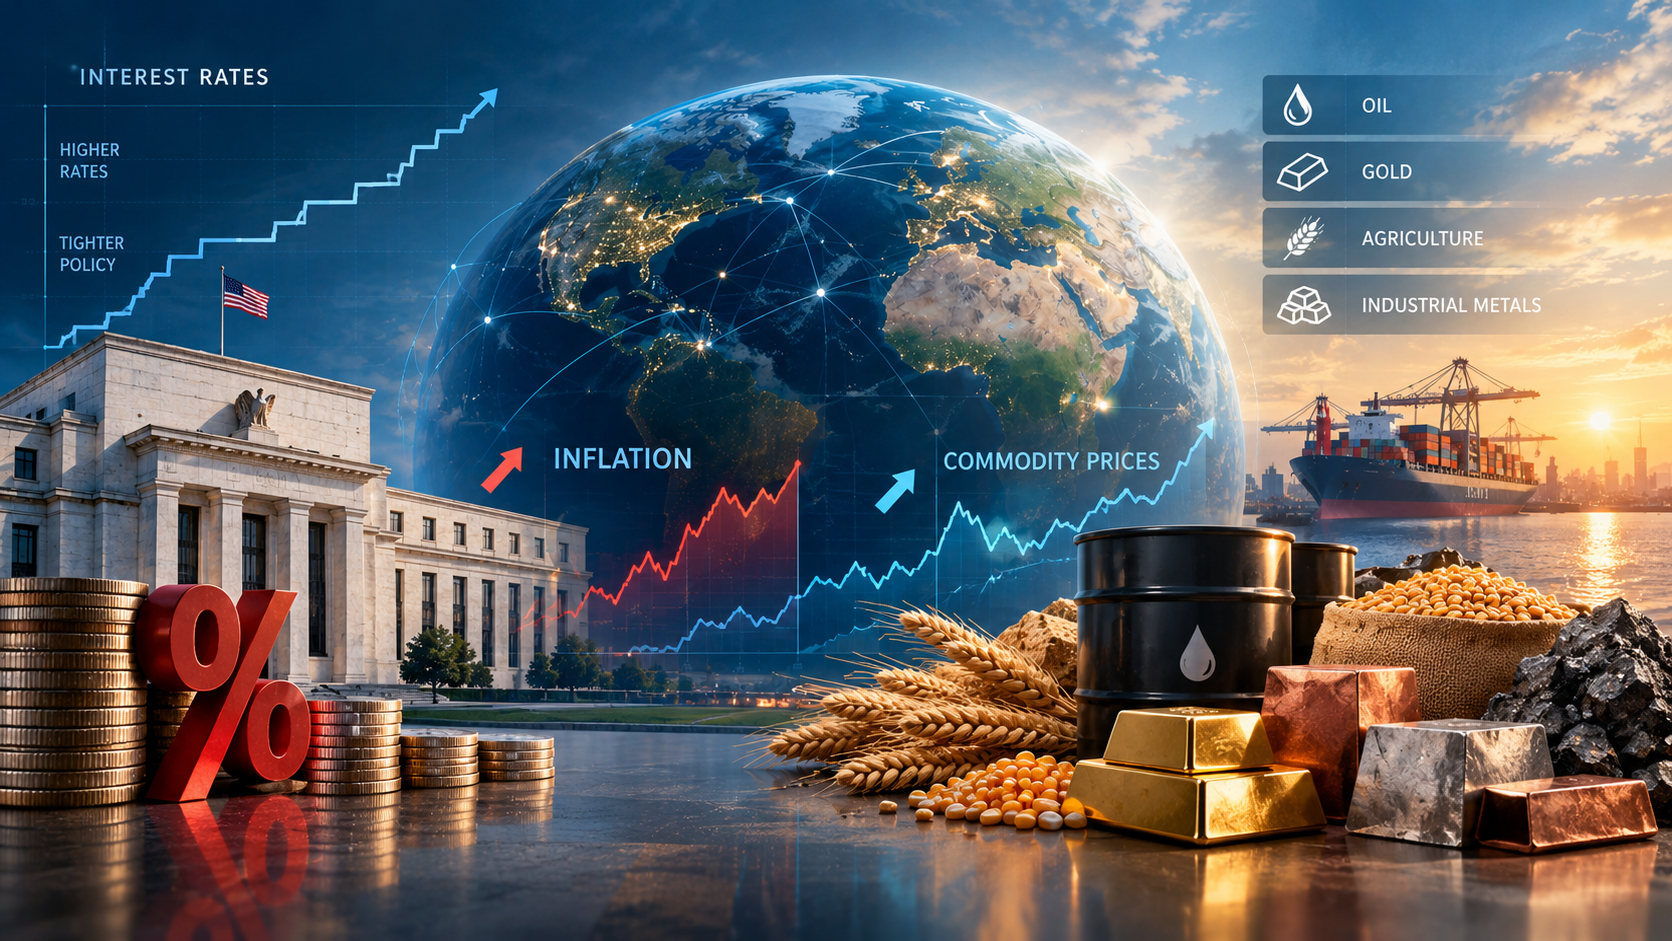
Central banks are now raising rates, not cutting them, as oil tops $100. Here’s where the Fed, ECB, inflation, and crude stand, and what to watch next.
Key Takeaways
- The Federal Reserve raised its target range by 0.25 percentage points on September 16, 2026, to 3.75% to 4.00%. It was the first US hike in several years.
- The European Central Bank has raised rates twice this year, most recently on September 10, bringing its deposit rate to 2.50%.
- US headline inflation was 3.4% year over year in August 2026, with core inflation at 2.4%. The energy component is the main reason headline inflation is above core.
- Brent crude traded above $100 a barrel in early September and was at $100.53 on October 6, after rising more than 30% from early-August lows.
- The main driver is a supply shock tied to the conflict involving Iran, which has disrupted shipping and energy infrastructure. Monetary policy is responding to that shock, not to weak growth.
Search Intent Summary
Readers searching for a global market outlook want to know three things: where interest rates are heading, whether inflation is coming back, and what commodity prices mean for their money. This article covers the current policy settings, the inflation data behind them, and the oil shock driving both.
The Policy Shift: From Cuts to Hikes
Through much of 2025, the Fed was cutting rates. It delivered three consecutive cuts in the second half of that year and then paused. Through the first eight months of 2026, the Fed held at 3.50% to 3.75%, with at least one official dissenting in favor of a hike at the July meeting.
The Fed’s September 15 to 16 meeting changed the picture. The committee raised the target range by 25 basis points, to 3.75% to 4.00%, and the Federal Reserve’s published calendar and statements confirm the meeting schedule. The updated projections point to roughly one more quarter-point increase before year-end, according to secondary analysis of the Fed’s September summary of economic projections. Readers should check the Fed’s own projections table rather than relying on summaries.
Europe moved first. The ECB raised its deposit rate in June, its first hike since September 2023, and again on September 10, to 2.50%. Its main refinancing rate is now 2.65%, and the marginal lending rate is 2.90%. The ECB said it is not committing to a fixed path and will decide meeting by meeting.
The message from both central banks is consistent. Inflation has moved above target because of energy, and the risk is that it becomes entrenched. Cutting rates into an energy shock would be the opposite of what policymakers want to do.
The Inflation Picture
US consumer prices rose 3.4% over the year to August 2026, unchanged from July. The peak this year was 3.8% in April. Monthly headline CPI rose 0.4% in August, with energy up 2.1%.
Core inflation, which excludes food and energy, eased to 2.4% year over year, the lowest reading since March 2021. Core CPI rose 0.3% in August alone, above the 0.2% consensus, which is why markets read the report as hawkish. Real average hourly earnings fell 0.3% over the year, meaning wages are losing ground to prices.
The eurozone shows a similar pattern. Euro-area inflation reached 3.3% in August, its highest since 2023, with energy the main driver. Excluding energy, inflation was about 2.2%. The ECB’s own projections put headline inflation averaging 3.0% in 2026, falling toward 2.5% in 2027 and 2.1% in 2028.
That split matters. When energy drives inflation and core stays contained, central banks face a dilemma. Hiking rates does little to lower oil prices, but it can slow growth and tighten financial conditions.
The Oil Shock
Brent crude is the single biggest variable in this outlook. Brent rose above $100 on September 9, touched $106.60 on September 10 during a 5% one-day jump, and was trading at $100.53 on October 6. Reporting from Khaleej Times attributed the spike to the biggest wave of attacks on shipping since the conflict began, along with the failure of hopes for a lasting ceasefire.
The conflict is now around six months old. The International Energy Agency’s August forecast projected global oil supply falling by about 4.3 million barrels a day in 2026, roughly 4%. OPEC, by contrast, has cut its forecast for world oil demand growth for a fifth straight month, which shows the market is pricing supply risk more than demand strength.
The supply and demand picture is tight. Analysts quoted in September described a “prolonged new normal” in which disruption risk is persistent rather than occasional, and noted limited spare production capacity. The Strait of Hormuz is the key chokepoint in that analysis.
Bond Markets and the Dollar
Rates have moved beyond the policy decisions themselves. Ten-year US Treasury yields reached their highest level since 2023 in early September, and Germany’s ten-year Bund yield hit its highest since 2011 after the ECB decision. That means borrowing costs are rising for governments and households alike, including mortgages.
For the currency picture, the dollar’s direction depends on how the Fed and ECB diverge. The ECB’s deposit rate now sits about 1.00 to 1.25 percentage points below the US range, a gap that generally favors the dollar. If the ECB hikes further than the Fed, that gap narrows. Watch the rate differential, not just the level of rates.
Scenarios for the Next Six Months
Rather than a single forecast, consider three paths. These are analytical scenarios, not predictions.
Base case: elevated energy, gradual hikes. Oil stays above $90 with periodic spikes, inflation hovers around 3%, and the Fed and ECB make one or two more moves before pausing. Bond yields stay high, and rate-sensitive sectors such as housing remain under pressure.
Escalation: oil moves higher and sticks. A sustained disruption pushes Brent well above $100, headline inflation rises again, and central banks face a choice between tightening further and accepting above-target inflation. This is the scenario that most threatens growth.
De-escalation: a durable ceasefire. Oil falls back, headline inflation eases through the rest of the year, and markets start pricing rate cuts again. Earlier in 2026, the Fed’s own projections showed cuts were possible, and a credible ceasefire could revive that path.
The swing factor is the conflict, not the data. Monthly inflation prints matter, but energy prices can overwhelm any single report.
Practical Strategy: What to Watch
For investors, the immediate indicators are the monthly CPI release, weekly oil inventory data, and any shipping disruption news from the Strait of Hormuz. Watch the 10-year Treasury yield as a gauge of financing costs across the economy.
For households and businesses, the practical takeaways are straightforward. Fixed-rate borrowing costs have risen and may stay high. Energy budgets need a buffer. Variable-rate debt is more exposed to further hikes than fixed-rate debt.
For policy watchers, the ECB’s next scheduled decision falls on October 29, and the Fed’s next meeting date is listed on its calendar. Each decision will reflect the most recent inflation and energy data.
This article offers general market context and is not investment advice. Consider speaking with a licensed financial adviser before making decisions based on these trends.
Future Outlook
The regime has changed. Two years ago, the debate was about how fast central banks would cut. Today it is about how far they will hike, and whether energy inflation spreads into wages and services. Core inflation is currently contained, which gives policymakers room to wait. That room shrinks if oil stays above $100 for months.
Frequently Asked Questions
Why are central banks raising rates instead of cutting them?
Inflation is above target in both the US and eurozone, and energy prices are the main driver. Raising rates is intended to keep higher energy costs from spreading into wages and prices across the economy. Both central banks have said decisions will depend on incoming data.
Is inflation falling?
Headline US inflation has eased from a 3.8% peak in April to 3.4% in August, and core inflation is at its lowest level since 2021. However, headline inflation is still well above the Fed’s 2% target, and eurozone inflation rose in August. Whether the trend continues depends largely on energy prices.
How high is oil right now?
Brent traded at $100.53 on October 6, 2026. Oil prices move daily, so check a current quote before relying on any figure. Prices have been volatile since the conflict escalated in early September.
Will interest rates fall in 2026?
The Fed’s September projections point to roughly one more increase by year-end rather than cuts. Market expectations change with each data release and each development in the conflict. Check the Fed’s latest statement and projections for the current outlook.
Discover more from The Economy
Subscribe to get the latest posts sent to your email.
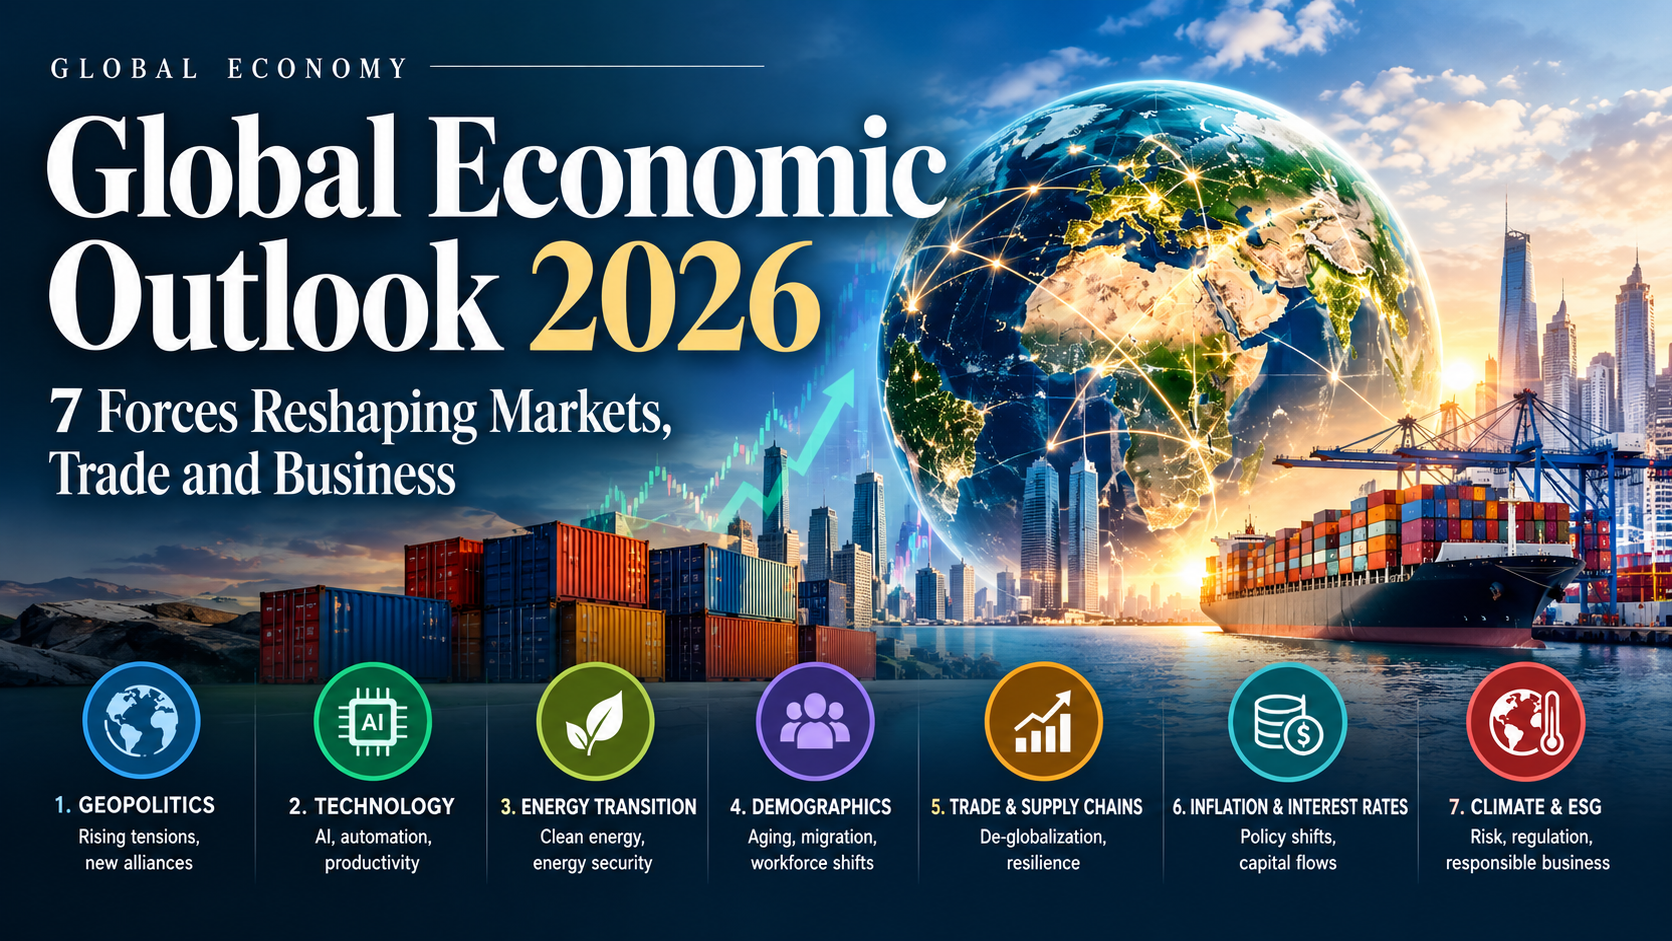
The global economy is entering a period in which geopolitical conflict, artificial intelligence, energy markets, trade policy and public debt are increasingly moving together.
That was one of the central messages emerging from the Forbes Global CEO Conference 2026 in Singapore, where business leaders gathered under the theme “Speed of Change.” The conference discussion highlighted a world in which tariffs, military conflicts, volatile energy prices and the rapid expansion of artificial intelligence are changing how companies plan for growth.
But the bigger story extends beyond the conference room.
Recent assessments from the World Bank, OECD, IMF and Bank for International Settlements point to an economy that remains surprisingly resilient while becoming more exposed to simultaneous shocks.
The result is a new operating environment for companies and investors: growth is still possible, but the sources of growth—and the risks surrounding it—are changing rapidly.
1. Geopolitics Is Becoming an Economic Variable
For years, businesses often treated geopolitics as an external risk. In 2026, that distinction is becoming increasingly difficult to maintain.
Trade restrictions, military conflicts, sanctions, shipping disruptions and energy-market volatility can now affect corporate earnings almost immediately.
The World Bank says the Middle East conflict has contributed to sharp increases in energy prices and renewed inflationary pressure, while its latest global outlook projects global growth at 2.5% in 2026 under its current assessment. It also warns that additional geopolitical escalation and commodity disruptions could push growth lower.
That means companies are increasingly being forced to consider questions that previously belonged primarily to governments and foreign-policy specialists:
- Where should critical production be located?
- Which trade routes are vulnerable?
- How dependent is the business on imported energy?
- Which markets could be affected by sanctions?
- Can suppliers be replaced quickly?
- How much inventory is necessary to protect against disruption?
For investors, geopolitical risk is therefore becoming part of fundamental analysis rather than simply a headline risk.
2. AI Is Both a Growth Engine and a Financial Risk
Artificial intelligence may be the most important structural force supporting global investment.
The OECD says strong AI-related activity helped sustain investment, production and trade during the first half of 2026. Its September interim outlook projects global GDP growth of 2.9% in 2026 and 3.0% in 2027.
The AI boom is creating demand for semiconductors, data centers, electricity, cloud infrastructure, networking equipment and advanced computing.
But there is a second side to the story.
The Bank for International Settlements has warned that AI-related investment is increasingly debt-financed and that stretched valuations could create financial vulnerabilities if expectations around AI earnings or investment weaken.
This creates an unusual economic dynamic.
AI can simultaneously:
Boost growth → increase investment → raise productivity → strengthen markets
while also potentially:
Increase valuations → encourage leverage → create concentrated exposure → amplify a market correction.
The implication for businesses is straightforward: adopting AI is no longer simply a technology decision. It is increasingly a capital-allocation and competitiveness decision.
3. The Next Phase of Globalization May Be More Regional
One of the most important developments highlighted at the Singapore conference is that globalization is not necessarily disappearing—it is changing shape.
Forbes reported that FedEx executive Richard Smith pointed to continuing global trade growth and opportunities for smaller Southeast Asian economies, while Biocon chair Kiran Mazumdar-Shaw highlighted India’s efforts to position itself as a technology partner through strategic trade and technology relationships.
That suggests the next phase of globalization could be less about one integrated production system and more about multiple interconnected regional networks.
Southeast Asia is particularly important.
Manufacturing diversification, digital infrastructure, strategic trade agreements and rising investment are creating opportunities for countries positioned between major economic powers.
The World Bank’s latest South Asia outlook similarly highlights the region’s resilience, projecting 6.9% growth in 2026, although it warns that elevated energy prices, weather shocks and a reversal in AI investment could create downside risks.
For multinational companies, this could mean a greater emphasis on:
- China+1 manufacturing strategies
- India and Southeast Asian supply chains
- Regional technology corridors
- Multiple sourcing locations
- Localized production
- Cross-border digital infrastructure
The globalization debate is therefore moving from “globalization versus deglobalization” toward “which regions will capture the next wave of globalization?”
4. Energy Prices Could Become the Inflation Wild Card
Energy remains one of the most important transmission channels between geopolitics and inflation.
A military escalation that affects oil production, refining capacity or shipping can increase costs across the economy—from transportation and manufacturing to food and consumer goods.
The OECD notes that renewed disruptions to production and exports in the Gulf have pushed energy prices higher, while elevated refining margins are adding pressure to consumer prices and business costs.
This creates a difficult policy problem.
Central banks may want to support economic growth, but persistent energy-driven inflation can limit their ability to loosen monetary policy.
For companies, higher energy prices can squeeze margins even when revenues remain stable.
For investors, the important question is no longer simply whether oil prices rise. It is whether an energy shock becomes persistent enough to change inflation expectations, interest rates and corporate investment decisions.
5. Public Debt Is Becoming a Constraint on Governments
Another structural challenge is the enormous amount of public debt accumulated across major economies.
The IMF has warned that global public debt is approaching historically elevated levels, while rising borrowing costs can make fiscal management increasingly difficult.
That creates a complicated environment for governments.
During an economic slowdown, governments may want to spend more to support households and businesses. But higher debt-servicing costs reduce the room available for fiscal stimulus.
The pressure is particularly important when an energy shock simultaneously increases inflation and weakens growth.
The IMF has also urged governments to rebuild fiscal space and maintain credible policies as economic risks accumulate.
For markets, this matters because government borrowing affects bond yields, currency markets, investment costs and ultimately equity valuations.
The era in which investors could treat fiscal policy as a secondary consideration may be ending.
6. Financial Markets Are More Vulnerable to an AI-Driven Repricing
The AI investment boom has helped support equity markets and corporate capital expenditure, but it has also created concentration risks.
The BIS has highlighted concerns surrounding stretched AI-related valuations, increased leverage and growing interconnectedness between banks and non-bank financial institutions.
That does not mean an AI crash is inevitable.
Instead, it means investors should distinguish between:
AI as a transformational technology
and
AI-related assets priced for extremely optimistic outcomes.
Those are two very different propositions.
A company can benefit enormously from AI while its stock can still be vulnerable if expectations have moved too far ahead of earnings.
The same principle applies to infrastructure.
Data centers, power generation, semiconductor facilities and cloud infrastructure may have long-term economic value. But if capacity expands faster than sustainable demand, investors could eventually face lower returns or stranded assets.
That concern was also raised during the Forbes conference, where speakers warned that excessive AI infrastructure investment could create stranded assets if the current boom fades.
7. Resilience May Become More Valuable Than Maximum Efficiency
The most important lesson for corporate leaders may be the simplest: the cheapest operating model is not necessarily the safest operating model.
For decades, globalization encouraged companies to optimize supply chains around efficiency, specialization and cost.
The new environment puts greater value on resilience.
That can mean maintaining alternative suppliers, holding strategic inventories, diversifying energy sources, developing cybersecurity capabilities and ensuring that critical technology systems can operate during disruptions.
The BIS has identified AI-related financial risks, leverage, private credit and cyber risks as important areas of financial-stability concern.
This creates a new corporate calculation:
Efficiency reduces costs. Resilience reduces catastrophic risk.
The companies that succeed in the next economic cycle may be those capable of balancing both.
What the 2026 Global Economy Means for Investors
For investors, the changing global landscape suggests that traditional macroeconomic indicators should be combined with a wider set of signals.
Five areas deserve particular attention:
Interest rates
Energy-driven inflation could keep monetary policy tighter for longer than markets expect.
Oil and energy
Sudden changes in energy prices can affect inflation, corporate margins and consumer spending simultaneously.
AI investment
AI remains a major growth opportunity, but valuation and leverage risks need to be monitored.
Geopolitical developments
Trade restrictions, wars, sanctions and shipping disruptions can rapidly alter market expectations.
Regional growth
South Asia and Southeast Asia remain important beneficiaries of supply-chain diversification and technology investment, although both regions remain exposed to energy and global financial conditions.
Why Southeast Asia and South Asia Matter More
The geographic center of global growth is also becoming more important.
Southeast Asia is attracting capital as companies diversify production and supply chains, while South Asia continues to record comparatively strong growth.
The World Bank’s latest South Asia assessment expects regional growth of 6.9% in 2026, with domestic demand and remittance inflows providing important support.
At the same time, the World Bank says Europe and Central Asia face slower growth amid higher energy prices and weaker external demand, although AI adoption could improve productivity and offset demographic pressures.
This reinforces a broader investment theme: the global economy is becoming more fragmented, but opportunities are also becoming more geographically diverse.
The New Economic Equation
The message emerging from Singapore is not that globalization is ending, AI is creating a bubble or the global economy is heading inevitably toward recession.
The more important conclusion is that the rules of economic decision-making are changing.
Companies must now think simultaneously about technology, geopolitics, energy, capital costs, supply chains and regulation.
Investors face a similar challenge.
The winning strategy may not be predicting exactly when the next crisis arrives. It may be identifying businesses, countries and sectors that can remain competitive when the assumptions behind the current economic system change.
The World Bank sees meaningful downside risks from geopolitical escalation and commodity disruptions, while the OECD expects continued but moderate global growth. The IMF has emphasized the need to rebuild fiscal resilience, and the BIS is highlighting vulnerabilities associated with AI valuations, leverage and financial interconnectedness.
Taken together, these assessments point to an economy that is resilient—but increasingly expensive to destabilize.
Bottom Line
The 2026 global economy is being shaped by seven forces: geopolitical fragmentation, AI investment, regionalized globalization, energy volatility, public debt, financial-market concentration and the growing value of resilience.
The opportunity is significant.
So is the risk.
For business leaders, the priority is adaptability. For investors, it is diversification and disciplined valuation. For governments, it is restoring fiscal and financial buffers before the next shock arrives.
The central economic question for the years ahead may therefore be less “How fast will the global economy grow?”
It may be:
“Which economies, companies and investors are best prepared for a world where the rules keep changing?”
Discover more from The Economy
Subscribe to get the latest posts sent to your email.

Anthropic Draws the Line: Why Claude’s New Usage Policy Explicitly Bans ‘Cruel Behavior’ Toward AI

Ynon Kreiz & Mattel’s Digital Transformation: Franchise Strategy and Financial Growth

Crude Oil & Petroleum Market Analysis: OPEC+ Decisions and Price Forecasts

Top US Convenience Store Chains: Store Counts, EV Charging, and Sales Trends

Publix Store Closures Tracker: Locations, Rebuild Status, and What’s Changing

How to Find Google Maps Fuel Prices and Save on Every Fill-Up

Global Market Outlook: Navigating Interest Rates, Inflation, and Commodity Spikes

PEP Stock Analysis: PepsiCo Financials, Dividend Yield, and Sector Volatility

Social Security $90 Payment Claims: What’s Real, What’s a Scam, and What Your 2027 COLA Could Be

EU vs UK Electric Vehicle Tariffs: Impact on Automotive Supply Chains & Consumer Prices

Complete Guide to Home Loan Refinancing: Interest Rate Trends & Loan Calculation Strategies

Algorithmic Dogfights: Why the U.S. and China Must Establish Rules of Engagement for Autonomous Air Power

Stock Market Today: Dow, S&P 500, and Nasdaq Retreat as Treasury Yields

Global Economic Outlook 2026: 7 Forces Reshaping Markets, Trade and Business

Oil Prices Break $100 in 2026: Middle East Conflict & Energy Markets

China Stocks Today: Are Big Economies in Asia Nearing a Market Bottom?

Middle East War Economics 2026: Oil Prices & Energy Markets

PSX Forecast 2026: KSE-100, IMF Reviews & Geopolitics

Crypto Daily Outlook: Bitcoin, Altcoins, and the Future of Decentralized Finance

Global Pension Systems Ranked: The World’s Best and Worst Retirement Frameworks

Enterprise AI Platforms Disrupting B2B SaaS in 2026: Full Analysis

World’s Largest Economies: Ranking the Top Global Powers

Elon Musk’s Next Moves: Disrupting the 2026 Global Economy

Pakistan Economy 2026: Inside the SBP’s Balancing Act

GasBuddy Market Insights: How Crude Price Shifts Impact Local Fuel Cost Averages

World Bank & IMF Reports 2026: Why the “3% Growth” Consensus Is Actually a Debate

Global Equity Market Divergence: US Tech vs. European Dividend Stocks vs. Asian Growth

Stock Market Today: Dow Climbs 500 Points as Markets Shake Off Inflation Jitters
-

 Markets & Finance9 months ago
Top 15 Stocks for Investment in 2026 in PSX: Your Complete Guide to Pakistan’s Best Investment Opportunities
-

 Analysis8 months ago
Johor’s Investment Boom: The Hidden Costs Behind Malaysia’s Most Ambitious Economic Surge
-

 Analysis8 months ago
Top 10 Stocks for Investment in PSX for Quick Returns in 2026
-

 Banks9 months ago
Best Investments in Pakistan 2026: Top 10 Low-Price Shares and Long-Term Picks for the PSX
-

 Analysis8 months ago
Brazil’s Rare Earth Race: US, EU, and China Compete for Critical Minerals as Tensions Rise
-

 Investment9 months ago
Top 10 Mutual Fund Managers in Pakistan for Investment in 2026: A Comprehensive Guide for Optimal Returns
-

 Global Economy10 months ago
15 Most Lucrative Sectors for Investment in Pakistan: A 2025 Data-Driven Analysis
-

 Global Economy10 months ago
Pakistan’s Export Goldmine: 10 Game-Changing Markets Where Pakistani Businesses Are Winning Big in 2025