
Growth
Ynon Kreiz & Mattel’s Digital Transformation: Franchise Strategy and Financial Growth

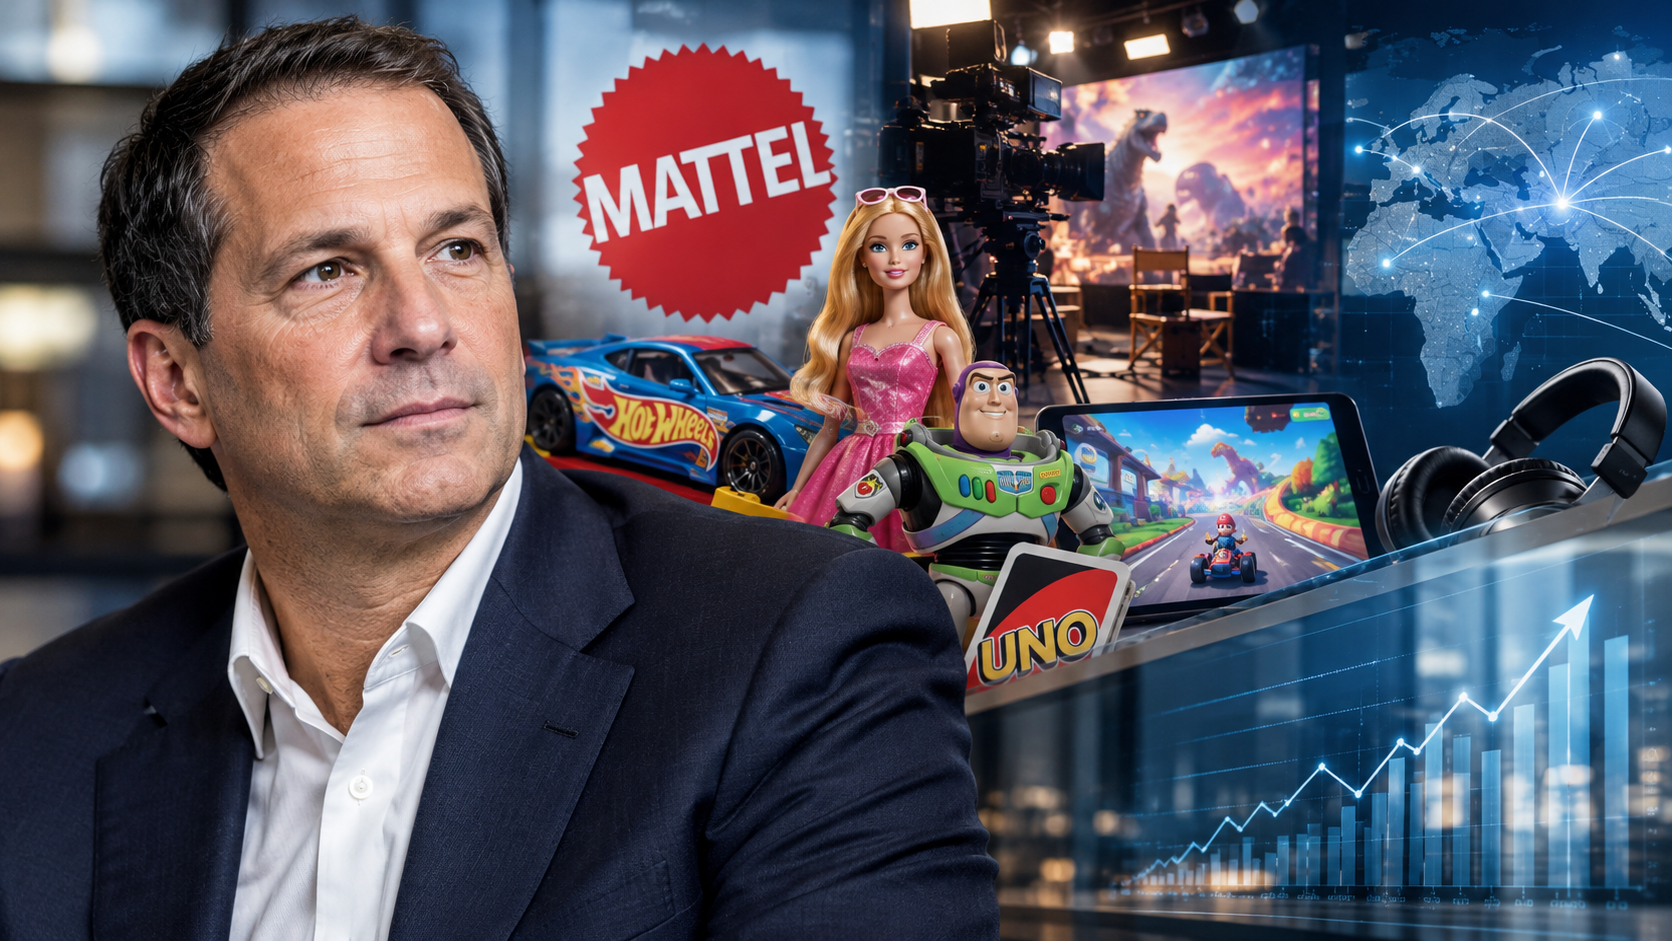
Mattel’s sales are up 10% as it builds mobile games on its franchises. Q2 2026 profits fell, so here’s how Kreiz’s strategy works and what investors should watch.
Key Takeaways
- Mattel reported Q2 2026 net sales of $1.125 billion, up 10% as reported and 9% in constant currency. The company swung to an $18 million net loss from $53 million net income a year earlier.
- Gross margin fell to 48.2% from 50.9%, driven by tariffs, inflation, higher royalties, and other cost pressures.
- The digital push is real but early. Mattel launched its first self-published mobile game, based on Masters of the Universe, and its UNO Wild title is in soft launch, with a global release expected in early 2027.
- The company reaffirmed 2026 guidance: 3% to 6% constant-currency net sales growth and adjusted EPS of $1.27 to $1.39, below 2025’s $1.49.
- Management has bought back $300 million of stock so far this year and reaffirmed a $400 million full-year target.
Search Intent Summary
People searching for Mattel and Ynon Kreiz usually want to understand the company’s turnaround strategy, whether the digital bets are paying off, and whether the financials support the stock. This analysis covers the strategy, the latest quarter, the guidance, and the risks.
The Strategy: IP-Driven Play and Family Entertainment
Kreiz has framed Mattel’s strategy as growing an “IP-driven play and family entertainment business.” In practice, that means building toys, games, and entertainment around brands the company already owns, including Hot Wheels, Barbie, Masters of the Universe, UNO, and Fisher-Price, and then extending those brands into film, television, and digital games.
The approach rests on a simple logic. A toy sold once is a single transaction, while a franchise can generate revenue across several products and platforms for years. Mattel’s Q2 release credited its brand-centric operating model and global capabilities with supporting growth across categories.
Management also points to a three-year cost program, Optimizing for Profitable Growth, which the company says is on track to deliver $225 million in savings by the end of 2026. Those savings are meant to fund the investments in digital and marketing without eroding profit.
The Digital Transformation
The digital push is Mattel’s most visible change. The clearest step came in March 2026, when the company completed full ownership of Mattel163, a mobile games studio. That gave Mattel a development team and a publishing platform rather than relying on licensing games to outside studios.
Since then, the company has launched its first self-published mobile game, based on Masters of the Universe, and has put a second title, UNO Wild, into soft launch. Management says UNO Wild has met its production milestones and expects a global commercial launch in early 2027.
The company plans to spend about $40 million on digital performance marketing, but it intends to deploy most of that when UNO Wild launches in 2027, not in 2026. That timing choice matters. It means 2026 digital results are less likely to reflect the full cost or the full benefit of the strategy.
The games business is already showing up in the numbers. Worldwide gross billings for action figures, building sets, games, and other rose 35% to $358 million in Q2, driven by games, including the full contribution of Mattel163, and by action figures tied to theatrical releases.
Q2 2026: Sales Up, Profit Down
The quarter shows the trade-off in the strategy. The top line grew while profitability fell.
| Metric | Q2 2026 | Q2 2025 | Change |
|---|---|---|---|
| Net sales | $1,125M | About $1,023M | +10% reported, +9% constant currency |
| Reported gross margin | 48.2% | 50.9% | Down 2.7 points |
| Adjusted gross margin | 48.6% | 51.2% | Down 2.6 points |
| Net income (loss) | ($18M) | $53M | Swing of about $71M |
The Q2 2025 net sales figure in the table is derived from the reported 10% growth rate, so check it against the company’s comparison table before publishing.
North America drove much of the growth, with net sales up 12%, while International rose 9%. Management highlighted growth in Hot Wheels, games, and action figures, and said Mattel gained share in vehicles and action figures, citing Circana data.
The margin pressure came from several sources. Management cited tariffs, inflation, higher royalties, and other cost pressures. Royalties are a notable point. Entertainment-linked franchises often carry royalty payments to film studios and rights holders, which rise as the franchise expands.
Guidance and What It Implies
Mattel reaffirmed its full-year 2026 outlook. The key figures are:
- Net sales growth of 3% to 6% on a constant-currency basis
- Adjusted gross margin of about 50%
- Adjusted operating income of $580 million to $630 million
- Adjusted EPS of $1.27 to $1.39
Applied to 2025 net sales of $5.348 billion, 3% to 6% growth implies roughly $5.51 billion to $5.67 billion in 2026. Set against 2025 adjusted EPS of $1.49, the adjusted EPS guidance implies a decline of about 7% to 15%. That gap is the central tension in the story: revenue is growing, but earnings are guided lower.
The guidance excludes any benefit from potential tariff refunds. If refunds materialize, they could improve results beyond the current outlook, but Mattel has not built them into its numbers.
One caveat on the EPS basis. Mattel’s Q1 release described a recast of adjusted EPS to exclude amortization of acquired intangible assets, and the figures in that release differ from those in the Q2 release. Confirm the basis used in the company’s current guidance table before quoting EPS figures.
Capital Returns
Mattel is returning cash to shareholders while it invests. The company repurchased $100 million of shares in Q2, bringing year-to-date buybacks to $300 million. It reaffirmed a full-year target of $400 million. Shares outstanding were 285.7 million at June 30, 2026.
Buybacks reduce the share count, which lifts earnings per share, but they do not add profit by themselves. Investors should separate buyback-driven EPS support from underlying growth. Adjusted operating income guidance of $580 million to $630 million is the better measure of whether the core business is improving.
Risks That Matter
Four risks stand out.
Tariffs and costs. Toys are import-heavy, and tariffs flow directly into gross margin. The Q2 margin decline shows how quickly costs can outpace pricing.
Execution in games. Mobile games are a hit-driven business. Masters of the Universe and UNO Wild have to find audiences at a reasonable cost. The company has not yet disclosed profitability for its self-published titles.
Royalty and licensing costs. As franchises grow through film and games, licensing and royalty payments can rise. That is part of the strategy, but it compresses margins in the short term.
Timing of the payoff. Much of the digital spending comes in 2027, when UNO Wild launches. A slower launch would push the payoff further out, while investors are already seeing lower margins in 2026.
Practical Takeaways for Investors
For investors tracking the turnaround, the metrics to watch are gross margin, adjusted operating income relative to the $580 million to $630 million guidance, and the performance of Mattel163 titles once they reach full launch. Sales growth alone does not show whether the strategy is creating value.
Mattel’s third-quarter results are the next checkpoint. Management said growth continued into the third quarter, and it expects to achieve full-year guidance. Verify the earnings date on the company’s investor site before publishing any timing-dependent statements.
This article is general information, not investment advice. Consider a licensed financial adviser before making investment decisions.
Future Outlook
Kreiz’s strategy is a bet that franchise-led entertainment, supported by owned games and film partnerships, can grow margins over time. The Q2 numbers show the sales half of that bet working. The profit half depends on tariffs, royalties, and whether digital titles reach profitable scale in 2027.
Frequently Asked Questions
What is Ynon Kreiz’s strategy at Mattel?
Kreiz is pursuing an “IP-driven play and family entertainment” strategy, building toys, games, and entertainment around owned brands. The strategy extends franchises into mobile games and film, supported by a cost program intended to fund growth.
Is Mattel’s digital games business profitable?
Mattel has not disclosed profitability for its self-published titles. The Mattel163 acquisition and games business contributed to Q2 revenue growth, but the company’s digital launches are still early, and its largest planned marketing spend comes when UNO Wild launches in 2027.
Why did Mattel’s profit fall if sales rose?
Gross margin fell to 48.2% in Q2 from 50.9% a year earlier. Management cited tariffs, inflation, higher royalties, and other cost pressures. Higher sales did not fully offset the margin decline.
Did Mattel change its 2026 guidance?
No. The company reaffirmed guidance for 3% to 6% constant-currency net sales growth and adjusted EPS of $1.27 to $1.39. The guidance excludes any possible tariff refunds.
Discover more from The Economy
Subscribe to get the latest posts sent to your email.



What is Fox Corporation’s biggest move in 2026? Fox delivered record annual revenue and adjusted EBITDA in fiscal 2026 while simultaneously announcing its most significant strategic move in years: a proposed acquisition of Roku, Inc., designed to combine Fox’s sports, news, and entertainment content — plus its Tubi streaming service — with Roku’s connected-TV platform and its direct relationship with more than 100 million global streaming households, according to Fox’s SEC filings related to the transaction.
The company also returned approximately $2.3 billion in capital to shareholders during fiscal 2026 — a figure that underscores how the Roku deal is being funded from a position of financial strength rather than distress, a contrast with the defensive posture many legacy media companies have adopted amid streaming-era pressure on traditional broadcast and cable economics.
Tubi’s Record Year
Featured Snippet Target: Fox’s ad-supported streaming service Tubi delivered record revenue in fiscal 2026, growing more than 25% year-over-year on the strength of over 100 million monthly active users, with total viewing time reaching approximately 13.2 billion hours — a 20% increase over fiscal 2025 — making it one of the most-watched free ad-supported streaming services in the United States according to Nielsen’s The Gauge, where it averaged roughly 2.2% of all television viewing over the year.
That growth wasn’t just about viewership volume — Tubi posted its first profitable quarter during the fiscal year, with advertising revenue soaring roughly 27% and average viewing time climbing 18% in that period, according to earnings analysis from Barchart. The platform has also been expanding its content library aggressively, growing its catalog to over 350,000 movies and television episodes, premiering 50 new original titles during the fiscal year, and expanding its “Tubi for Creators” program to include more than 20,000 episodes of creator-led content from over 400 individual creators.
FOX One and the Direct-to-Consumer Push
Fox’s other major 2026 launch was FOX One, its wholly-owned direct-to-consumer subscription streaming service — a move that positions the company to capture subscription revenue directly rather than relying solely on traditional distribution deals and Tubi’s ad-supported model. Combined with the pending Roku transaction, FOX One represents a two-pronged streaming strategy: a subscription product for viewers willing to pay directly, and an expanded free, ad-supported footprint through Tubi and, pending deal completion, Roku’s owned-and-operated Roku Channel.
Live Sports Remains the Core Engine
Even as streaming investments dominate headlines, Fox’s traditional broadcast business — anchored by live sports — has continued to perform well. NFL ratings on Fox strengthened by nearly 12% year-over-year during a recent quarter, according to Barchart’s earnings preview coverage, reinforcing the company’s continued dominance in live sports programming — a category that has proven far more resistant to streaming-driven audience fragmentation than scripted entertainment.
Fox also announced a $1.5 billion share buyback during the year, a signal management has framed as confidence in the company’s underlying growth trajectory even as it simultaneously invests heavily in the FOX One launch and the Roku transaction.
What Analysts Are Watching
Wall Street’s overall read on Fox has remained constructive through the year. Among analysts covering the stock, the consensus rating has held at “Moderate Buy,” with roughly even sentiment split between “Strong Buy” and “Hold” ratings and shares trading above the average analyst price target for extended stretches of the year — an unusual signal that suggests analyst price targets themselves have struggled to keep pace with the stock’s performance, according to coverage from Barchart.
Wall Street has broadly forecast Fox’s per-share earnings to decline modestly in fiscal 2026 on a diluted basis, before rebounding with double-digit percentage growth in fiscal 2027 — a projection that assumes Tubi’s profitability and FOX One’s early subscriber growth begin meaningfully offsetting continued softness in traditional linear-television economics. Fox’s monetization of major sporting events, including its FIFA World Cup 2026 advertising commitments, has been flagged repeatedly by analysts as a key swing factor for whether that fiscal 2027 rebound materializes on schedule.
The Bottom Line
Fox Corporation’s 2026 has been defined by a genuine strategic pivot executed from a position of financial strength: record revenue and shareholder returns funding an aggressive expansion into both ad-supported (Tubi, pending Roku) and subscription (FOX One) streaming, without sacrificing the live-sports programming that remains the company’s core competitive advantage. The Roku transaction, if completed, would meaningfully expand Fox’s direct reach into connected-TV households — arguably the single most contested distribution layer in the entire streaming industry.
Next step: Investors and media-industry watchers should track the Roku acquisition’s regulatory review timeline closely — deal completion, rather than any single quarterly earnings beat, is likely to be the biggest near-term catalyst for how Fox’s connected-TV strategy is ultimately valued by the market.
Discover more from The Economy
Subscribe to get the latest posts sent to your email.
Opinion
OPINION:Breaking the 3.5% Growth Trap: How Pakistan Can Build a High-Productivity Export Economy
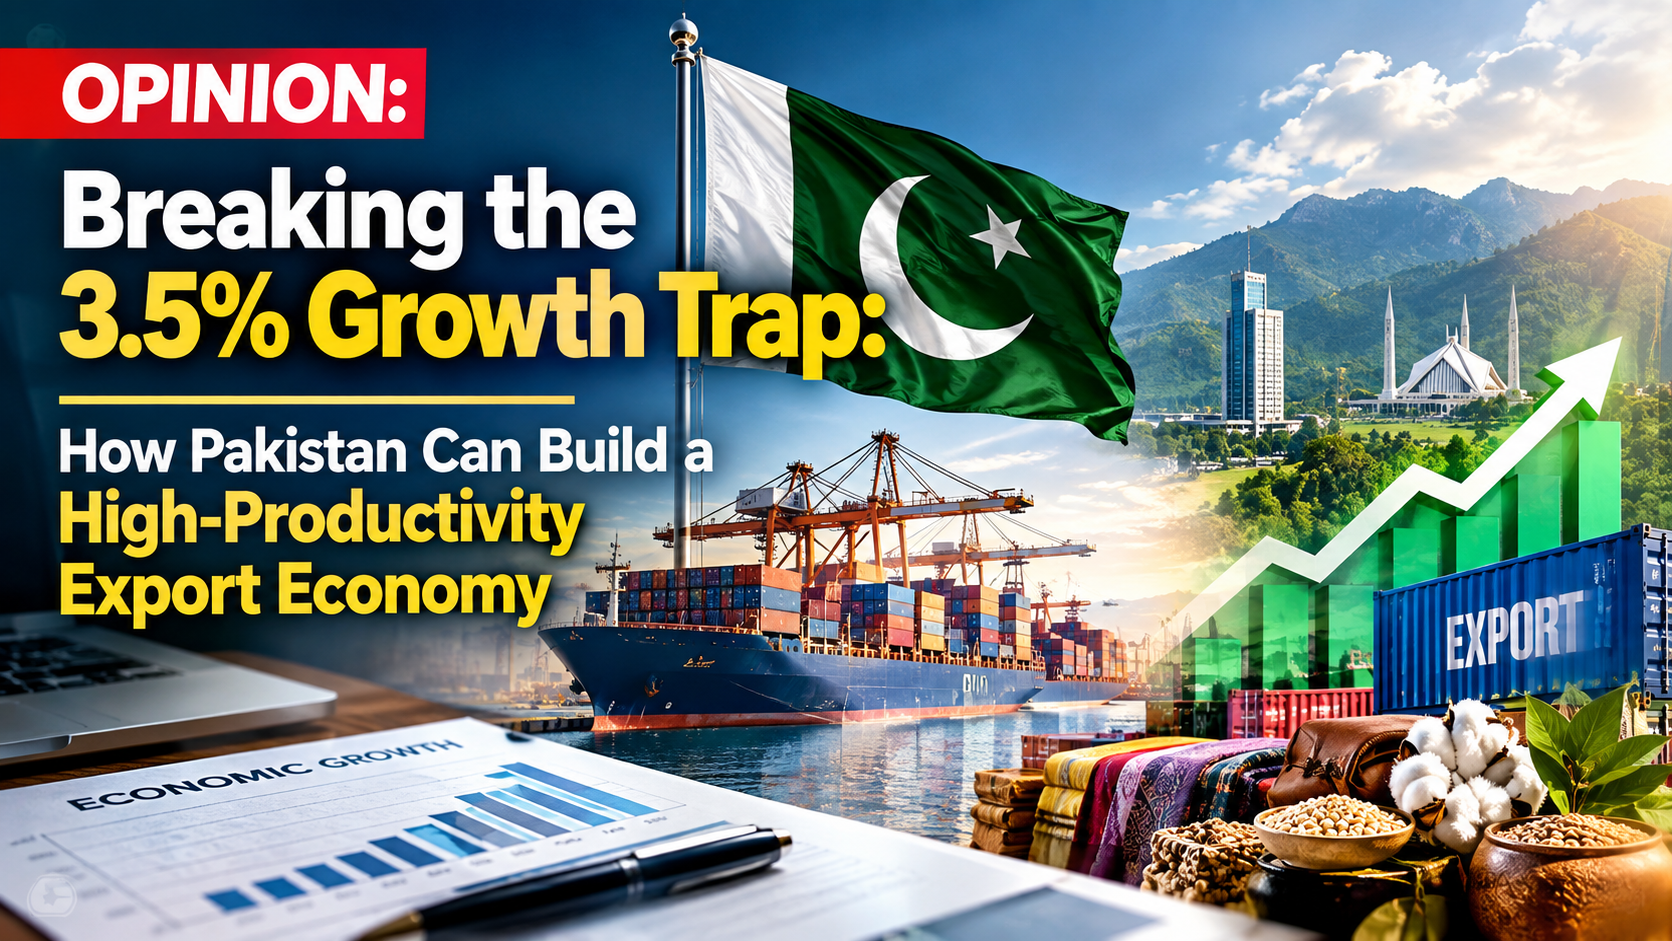
Over the last two centuries, global economic transformations have repeatedly demonstrated that escaping poverty requires moving labor from low-productivity agriculture to high-value industrial and technological sectors. While Western nations achieved this transition over centuries, East Asian economies—Japan, South Korea, Taiwan, and China—compressed the process into a few decades by sustaining growth rates near or above 8% per year.
Pakistan remains caught in a boom-and-bust stabilization cycle. While short-term fiscal adjustments under international programs stabilize reserves, real GDP growth continues to hover around 3.5%—a rate barely sufficient to match population growth and capital depreciation. Escaping this trap requires addressing the fundamental structural bottlenecks that constrain national productivity.
1. The Growth Divergence: Boom-and-Bust vs. Export-Led Industrialization
Pakistan’s growth model historically relies on domestic consumption driven by foreign remittances, debt-financed public spending, and import surges. Whenever domestic growth approaches 5%, import demand exhausts foreign exchange reserves, forcing monetary tightening, currency devaluation, and emergency fiscal consolidation.
In contrast, East Asian developmental models aligned domestic credit and state support directly with export discipline:
- State-Directed Capital Allocation: South Korea and Japan provided cheap credit, tax concessions, and infrastructure support exclusively to firms that achieved strict international export targets.
- Protection Tied to Performance: Domestic industrial protection was temporary and conditional on gaining global market share, preventing permanent reliance on state subsidies.
- High Savings and Investment: East Asian economies consistently maintained gross fixed capital formation above 30% of GDP, whereas Pakistan’s investment-to-GDP ratio routinely hovers below 15%.
2. The Three Structural Bottlenecks Holding Back Growth
I. The Economic Complexity Deficit
According to data from the Harvard Growth Lab’s Atlas of Economic Complexity, Pakistan ranks 89th globally in economic complexity. Its export basket remains concentrated in low-complexity goods—primarily basic textiles and raw agricultural commodities—which face volatile global prices and low income elasticity. Without expanding into medium- and high-tech manufacturing (such as electronics, auto components, and specialty chemicals), export revenues cannot cover the capital goods imports needed for sustained growth.
                     PAKISTAN'S STRUCTURAL GROWTH BARRIER

   +-------------------------------------------------------------------+
   |                 Low Industrial & Export Complexity                |
   |              (Textiles & Agriculture Dominate ~70%)               |
   +---------------------------------+---------------------------------+
                                     |
                                     v
   +-------------------------------------------------------------------+
   |                 Rapid Consumption-Driven Growth                   |
   |                     (Reaches ~4.5% - 5.0% GDP)                    |
   +---------------------------------+---------------------------------+
                                     |
                                     v
   +-------------------------------------------------------------------+
   |               Import Surge & Trade Deficit Spikes                 |
   |             (Foreign Exchange Reserves Depleted)                  |
   +---------------------------------+---------------------------------+
                                     |
                                     v
   +-------------------------------------------------------------------+
   |              Stabilization & Demand Contraction                  |
   |           (Higher Rates, Import Restrictions, Slow Growth)        |
   +-------------------------------------------------------------------+
II. Fiscal Crowding-Out and Energy Sector Inefficiencies
Data from the State Bank of Pakistan shows that public sector borrowing consumes the vast majority of commercial bank credit. This debt crowding-out deprives private enterprises of affordable long-term capital for industrial upgrades. Furthermore, structural power tariffs—driven by unaddressed circular debt, capacity payments, and transmission losses—render local manufacturers uncompetitive against regional peers in Vietnam, Bangladesh, and India.
“Escaping the 3.5% growth trap requires shifting resources from rent-seeking sectors into productive, export-oriented manufacturing.”
III. Human Capital & Agricultural Productivity Deficits
Recent economic analyses published in the World Bank Pakistan Development Update emphasize that low agricultural yield per hectare keeps a large share of the labor force tied to low-productivity farming. Stagnant agricultural yields limit raw material supply for processing industries and force the country to import essential food commodities during demand spikes.
3. A Four-Pillar Framework for Sustainable 7%+ Growth
To move beyond perpetual debt-fueled stabilization and achieve sustained double-digit growth, economic policy must focus on four structural imperatives:
| Reform Pillar | Strategic Action | Targeted Outcome |
| 1. Export Diversification | Transition subsidies from low-value textiles to high-complexity sectors (engineering, IT, specialty chemicals). Tie tax incentives to global market share gains. | Higher export complexity and reduced trade deficits. |
| 2. Energy & Fiscal Restructuring | Privatize mismanaged power distribution companies (DISCOs), eliminate cross-subsidies, and broaden the direct tax base to broaden credit for the private sector. | Lower industrial energy costs and increased private sector credit. |
| 3. Agricultural Modernization | Adopt high-yield seed technologies, corporate farming frameworks, and efficient drip irrigation systems to boost yield per acre. | Higher farm incomes, food security, and agricultural export surpluses. |
| 4. Institutional & Investment Reform | Create long-term policy predictability through legislative guarantees for foreign and domestic direct investment, structured via international standards like the International Monetary Fund (IMF) reform frameworks. | Increased Foreign Direct Investment (FDI) and gross capital formation. |
The Path Forward
Macroeconomic stabilization is a necessary condition for survival, but it is not a growth strategy. Without shifting resources from rent-seeking sectors into productive, export-oriented manufacturing, Pakistan will remain caught in its historical boom-and-bust cycle. Sustained, inclusive growth requires aligning state policy with market-driven export incentives, reforming the energy and tax structures, and modernizing the country’s economic foundation.
Discover more from The Economy
Subscribe to get the latest posts sent to your email.
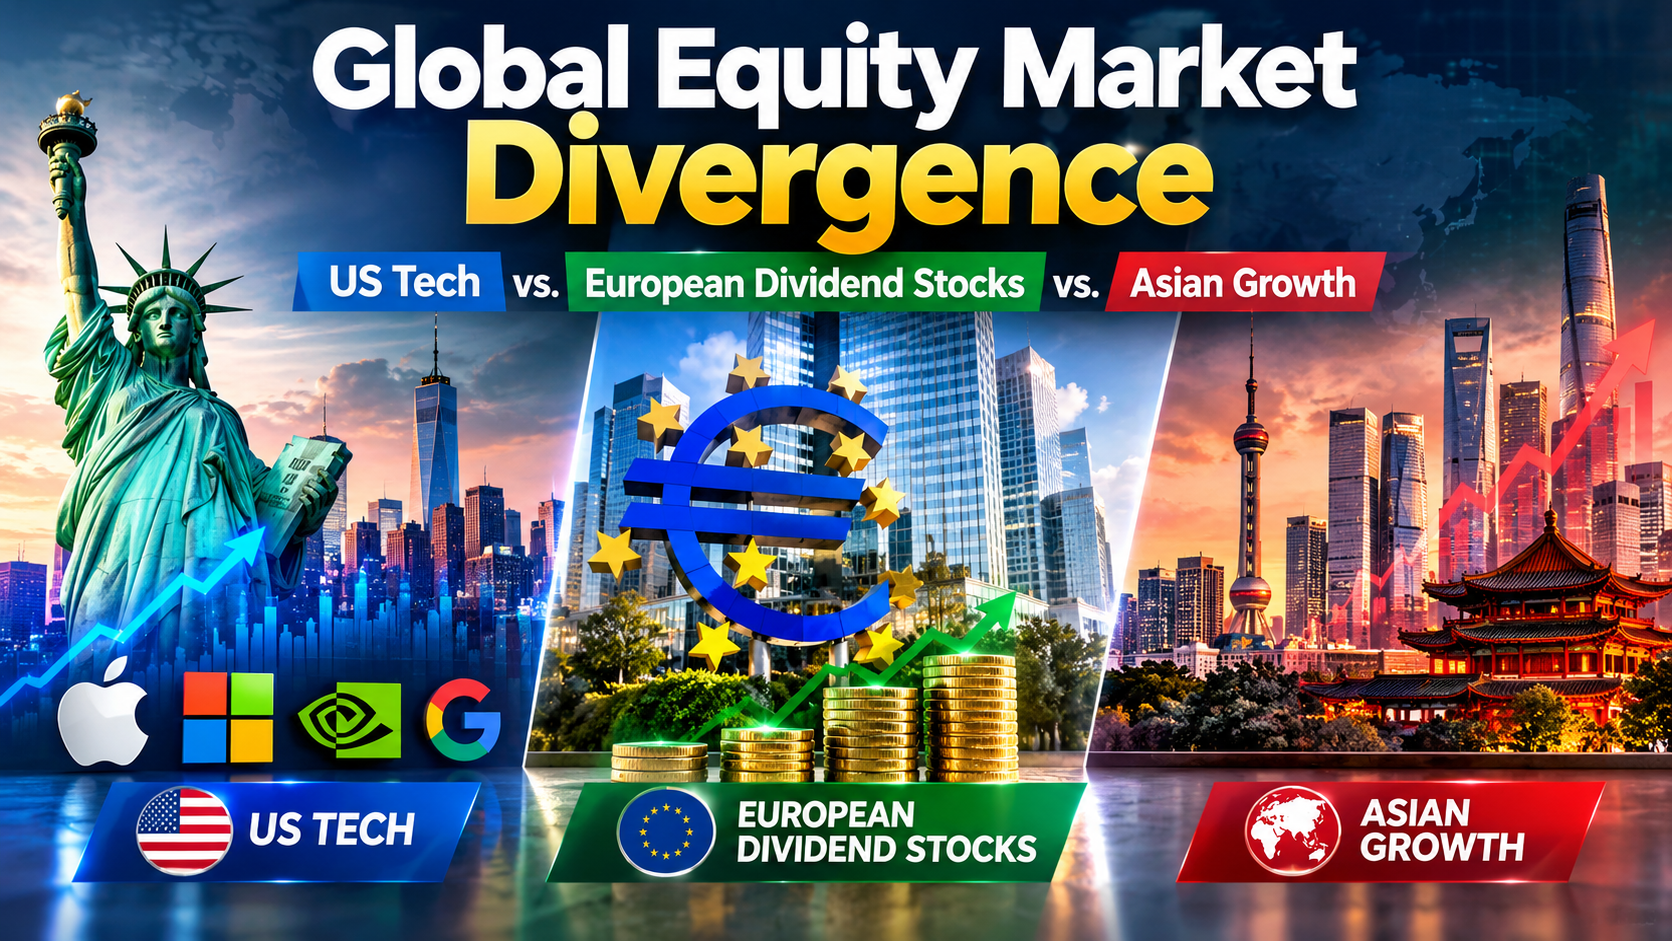
S&P 500 at 7,620, FTSE at 10,698, Nikkei at 64,136. Compare US tech, European dividends and Asian growth as three central banks split on rates.
Executive Summary / Key Takeaways
- The three major regions are now priced off three different monetary regimes: the Fed hiking into strength, the ECB hiking into weakness, and the Bank of Japan normalising from near zero.
- On the day of the Fed’s hike, the Dow fell more than 600 points while the Nasdaq finished close to flat — a clean demonstration that “US equities” is no longer a single exposure.
- European indices held up: the FTSE 100 sat at 10,697.57 (+0.44%) while the DAX at 25,440.81 and Euro Stoxx 50 at 6,260.38 slipped.
- Japan outperformed on currency mechanics, with the Nikkei at 64,136 and the Topix at 4,094.
- Yardeni Research cut its year-end S&P 500 target to 7,900 from 8,400, citing yield pressure from rising energy prices.
Regional equity allocation has spent a decade being a low-conviction decision. Global indices moved together, US technology led, and everything else was a funding source. September 2026 broke that pattern within a single trading week.
The trigger was monetary divergence. The Federal Reserve raised rates to 3.75%–4.00% on 16 September. The ECB had already lifted its deposit rate to 2.5% on 10 September. The Bank of England held at 3.75% on a 6-3 split on 17 September, and the Bank of Japan is expected to hike on 18 September.
Four decisions, four different directions of travel, four different equity responses. That is the environment retail investors and portfolio managers now have to allocate into.
2. Core Market Analysis
2.1 The comparison matrix
| Region / Index | Level | Move | Monetary regime | Primary source |
|---|---|---|---|---|
| S&P 500 (US) | 7,619.98 | -0.48% | Fed tightening; ≥1 more hike signalled | Yahoo Finance |
| Nasdaq Composite (US) | 26,186.41 | -0.56% | Duration-sensitive; held up on Fed day | Yahoo Finance |
| Dow Jones (US) | 52,421.20 | -0.29% | Fell 600+ pts on the hike itself | Yahoo Finance |
| FTSE 100 (UK) | 10,697.57 | +0.44% | BoE on hold at 3.75% | Yahoo Finance |
| DAX (Germany) | 25,440.81 | -0.50% | ECB at 2.5% deposit rate | Yahoo Finance |
| CAC 40 (France) | 8,117.78 | -0.76% | ECB at 2.5% deposit rate | Yahoo Finance |
| Euro Stoxx 50 | 6,260.38 | -1.02% | Weakest major European print | Yahoo Finance |
| Nikkei 225 (Japan) | 64,136 | +0.33% | BoJ normalising; weak yen tailwind | Trading Economics |
| Hang Seng (HK) | 24,713 | +0.2% | Pegged; HKMA hiked to 4.25% | Trading Economics |
| VIX | 17.10 | +7.95% | Volatility bid but not stressed | Yahoo Finance |
2.2 US: the index is not the market
The single most revealing datapoint of the week was the internal dispersion on Fed day. Stocks turned lower during Warsh’s press conference as markets read his remarks as hawkish, with the Dow leading losses down more than 700 points at one stage — over 1.6% — while the S&P 500 declined 0.4% and the Nasdaq slid just below flat, Yahoo Finance reported.
Conventional rate logic says long-duration growth should suffer most when yields rise. It did not. The cyclical, energy-exposed and rate-sensitive parts of the market took the damage instead: J.B. Hunt Transport fell 12.64% after warning on earnings and rising operating costs, Diamondback Energy dropped 8% amid concerns over inflation, rising Treasury yields and crude-market geopolitical risk, and APA Corp fell 5.2%, according to TheStreet’s market coverage. Optical and photonics names rebounded, with Coherent and Lumentum each up around 6%.
The forward view has been trimmed. Yardeni Research cut its year-end S&P 500 target to 7,900 from 8,400 — implying 4.1% upside from Tuesday’s close of 7,585.73 rather than the 11% its previous estimate implied — citing higher Treasury yields due to rising energy prices and increased downturn risk over the next three to six months, CNBC reported.
2.3 Europe: the dividend case
European equities are not outperforming on growth. Euro-area output is projected around 1.3% for 2026 by the IMF, with the region benefiting less than others from the technology-driven investment boost and lingering energy-price effects still dragging on manufacturing.
They are outperforming, where they are, on payout and valuation. With the ECB deposit rate at 2.5% — the loosest of the major blocs — the yield competition from cash and short-dated bonds is materially weaker in Europe than in the US, where the funds rate is now 3.75%–4.00% and the 10-year has topped 5%. That relative-yield arithmetic is the structural argument for European income equity in this cycle, and it holds regardless of European growth being mediocre.
The UK sits awkwardly between the two. The FTSE’s commodity and energy weighting makes it a partial beneficiary of the same oil shock hurting importers elsewhere, which explains its positive print against a broadly weaker European tape.
2.4 Asia: growth with a currency asterisk
Japan’s advance came from yen weakness after the Fed decision, which improved the earnings outlook for export-focused industries, Trading Economics noted. Hong Kong’s caution came from the HKMA following the Fed with a hike to 4.25%, pressuring property.
The regional growth case is real — East Asia and Pacific is projected at 4.2% for 2026 and South Asia at 6.3% by the World Bank — but a meaningful share of recent Japanese equity return has been a currency effect that BoJ normalisation will erode.
3. Structural Drivers and Competitor Gaps
The gap in most comparative coverage is treating this as a regional rotation call. It is better understood as three separate factor exposures that happen to have geographic labels:
- US large-cap technology is a duration and AI-capex exposure. It held up on Fed day because the AI investment cycle is currently a stronger driver than the discount rate. Both the IMF and World Bank cite broader AI adoption as the principal upside risk to global growth. If that capex cycle cools, the rate sensitivity reasserts itself immediately.
- European income equity is a relative-yield exposure. Its attractiveness is a function of the ECB-Fed policy gap, not of European fundamentals. Narrow the gap and the case weakens.
- Asian growth equity is partly a currency exposure. Particularly in Japan, where the return decomposition between earnings and FX is doing more work than most allocators acknowledge.
Correctly labelled, these are not substitutes for one another. The diversification benefit of holding all three is higher in 2026 than at any point in the past decade — which is the practical conclusion most aggregator coverage fails to reach.
4. Key Implications for Stakeholders
Retail investors. A global index fund currently buys you a heavy weighting to a single factor: US technology and its AI capital-expenditure cycle. If that is the intended exposure, fine. If not, deliberate regional allocation is required to get it.
Portfolio managers. Volatility is bid but not stressed, with the VIX at 17.10 — an unusually calm reading given four central bank decisions in eight days and crude above $100. That combination favours adding hedges while they remain inexpensive rather than after a repricing.
Income investors. The yield hurdle is regional now. In the US, equity income competes against a 10-year above 5%. In the euro area, it competes against a 2.5% deposit rate. The same dividend yield is a materially better proposition in one market than the other.
Risk teams. Cross-regional correlation assumptions built on the 2015–2021 regime are stale. Three distinct monetary cycles produce genuinely differentiated drawdown paths.
5. Frequently Asked Questions
Q1: Why did the Nasdaq hold up while the Dow fell after the Fed hike?
The damage concentrated in cyclical, transport and energy-exposed names rather than long-duration technology. Investors are currently treating the AI capital-expenditure cycle as a stronger earnings driver than the discount rate is a valuation headwind.
Q2: Are European dividend stocks more attractive than US equities now?
On relative yield, arguably. The ECB deposit rate is 2.5% against a US funds rate of 3.75%–4.00% and a 10-year Treasury above 5%, so European equity income faces far weaker competition from cash and bonds. European growth, however, remains around 1.3%.
Q3: What is the current S&P 500 level and forecast?
The S&P 500 was at 7,619.98. Yardeni Research cut its year-end target to 7,900 from 8,400, implying roughly 4% upside, citing higher Treasury yields driven by rising energy prices.
Q4: Which region offers the best equity growth in 2026?
Asia on headline growth — East Asia and Pacific at 4.2% and South Asia at 6.3% per World Bank forecasts. But a meaningful share of recent Japanese equity returns reflects yen weakness rather than earnings, and Bank of Japan normalisation erodes that tailwind.
Discover more from The Economy
Subscribe to get the latest posts sent to your email.

Anthropic Draws the Line: Why Claude’s New Usage Policy Explicitly Bans ‘Cruel Behavior’ Toward AI

Ynon Kreiz & Mattel’s Digital Transformation: Franchise Strategy and Financial Growth

Crude Oil & Petroleum Market Analysis: OPEC+ Decisions and Price Forecasts

Top US Convenience Store Chains: Store Counts, EV Charging, and Sales Trends

Publix Store Closures Tracker: Locations, Rebuild Status, and What’s Changing

How to Find Google Maps Fuel Prices and Save on Every Fill-Up

Global Market Outlook: Navigating Interest Rates, Inflation, and Commodity Spikes

PEP Stock Analysis: PepsiCo Financials, Dividend Yield, and Sector Volatility

Social Security $90 Payment Claims: What’s Real, What’s a Scam, and What Your 2027 COLA Could Be

EU vs UK Electric Vehicle Tariffs: Impact on Automotive Supply Chains & Consumer Prices

Complete Guide to Home Loan Refinancing: Interest Rate Trends & Loan Calculation Strategies

Algorithmic Dogfights: Why the U.S. and China Must Establish Rules of Engagement for Autonomous Air Power

Stock Market Today: Dow, S&P 500, and Nasdaq Retreat as Treasury Yields

Global Economic Outlook 2026: 7 Forces Reshaping Markets, Trade and Business

Oil Prices Break $100 in 2026: Middle East Conflict & Energy Markets

China Stocks Today: Are Big Economies in Asia Nearing a Market Bottom?

Middle East War Economics 2026: Oil Prices & Energy Markets

PSX Forecast 2026: KSE-100, IMF Reviews & Geopolitics

Crypto Daily Outlook: Bitcoin, Altcoins, and the Future of Decentralized Finance

Global Pension Systems Ranked: The World’s Best and Worst Retirement Frameworks

Enterprise AI Platforms Disrupting B2B SaaS in 2026: Full Analysis

World’s Largest Economies: Ranking the Top Global Powers

Elon Musk’s Next Moves: Disrupting the 2026 Global Economy

Pakistan Economy 2026: Inside the SBP’s Balancing Act

GasBuddy Market Insights: How Crude Price Shifts Impact Local Fuel Cost Averages

World Bank & IMF Reports 2026: Why the “3% Growth” Consensus Is Actually a Debate

Global Equity Market Divergence: US Tech vs. European Dividend Stocks vs. Asian Growth

Stock Market Today: Dow Climbs 500 Points as Markets Shake Off Inflation Jitters
-

 Markets & Finance9 months ago
Top 15 Stocks for Investment in 2026 in PSX: Your Complete Guide to Pakistan’s Best Investment Opportunities
-

 Analysis8 months ago
Johor’s Investment Boom: The Hidden Costs Behind Malaysia’s Most Ambitious Economic Surge
-

 Analysis8 months ago
Top 10 Stocks for Investment in PSX for Quick Returns in 2026
-

 Banks9 months ago
Best Investments in Pakistan 2026: Top 10 Low-Price Shares and Long-Term Picks for the PSX
-

 Analysis8 months ago
Brazil’s Rare Earth Race: US, EU, and China Compete for Critical Minerals as Tensions Rise
-

 Investment9 months ago
Top 10 Mutual Fund Managers in Pakistan for Investment in 2026: A Comprehensive Guide for Optimal Returns
-

 Global Economy10 months ago
15 Most Lucrative Sectors for Investment in Pakistan: A 2025 Data-Driven Analysis
-

 Global Economy10 months ago
Pakistan’s Export Goldmine: 10 Game-Changing Markets Where Pakistani Businesses Are Winning Big in 2025