
Global Economy
Battle for the Farm Belt: How Tariff Pressures and Fuel Costs Are Reshaping Iowa’s 2026 Midterms


DES MOINES, Iowa — In America’s agricultural heartland, the political landscape heading into the 2026 midterm elections is undergoing its most significant realignment in a decade. Surging fuel overhead, escalating global trade frictions, and rising input costs are convergence points putting traditional Republican strongholds in Iowa under intense electoral pressure.
1. The Economic Squeeze in Rural Iowa
At the center of Iowa’s political shift is a dual economic pressure hitting family farms and agricultural enterprises:
- Energy and Transportation Overhead: Following energy market disruptions, diesel prices across the Midwest surged past $6.50 per gallon, representing a nearly 76% increase year-over-year. For producers managing heavy machinery, grain haulage, and supply chain logistics, fuel overhead has eroded operational margins.
- Trade and Commodity Price Suppression: Retaliatory tariffs on major American exports—specifically soybeans and corn—have created volatility in key foreign markets. Soybean prices have faced downward pressure, directly reducing farm incomes across 95% of Iowa’s primary crop-producing counties.
- Compound Input Inflation: Higher costs for nitrogen-based fertilizers, commercial seeds, and equipment financing have compounded household financial strain.
According to financial impact studies published in the Associated Press Midterm Report, agricultural producers across the Midwest are facing a sharp pinch between fixed operational costs and suppressed market yields, turning economic survival into a core campaign issue.
2. Polling Breakdown: Marist Survey Highlights Key Shifts
Political dynamics in Iowa—long viewed as a stable red baseline—have tightened dramatically across statewide contests.
Data compiled in the Marist Poll September 2026 Survey highlights significant headwinds for incumbent political alignments:
| Electoral Measure | Current Polling Metric | Key Demographic / Breakdown |
| U.S. Senate Race | Josh Turek (D): 50% Ashley Hinson (R): 42% | Independent voters favoring Turek; cost-of-living cited as primary issue. |
| Gubernatorial Race | Rob Sand (D): 54% Zach Lahn (R): 42% | Sand holding a 57%–33% advantage among independent statewide voters. |
| Generic Congressional Ballot | Democrat: 50% Republican: 45% | Shift in suburban and mixed rural-suburban congressional districts. |
| Presidential Job Approval | Disapprove: 58% Approve: 41% | Plurality of voters (43%) report their ballot is a vote against current federal policies. |
| Household Financial Sentiment | Worse Off: 46% Unchanged: 39% / Better: 15% | High fuel prices and grocery inflation drive negative financial sentiment. |
3. The Re-Alignment of the Rural Swing Vote
In previous election cycles, agricultural state voters historically prioritized regulatory relief and federal tax incentives. However, the 2026 midterm cycle demonstrates that affordability and cost containment have superseded traditional party loyalties.
Analysis from the Brookings Institution Midterm Governance Report indicates that when Presidential approval ratings dip among agricultural constituents, down-ballot candidates face immediate fallout:
- The Independent Pivot: Independent voters in Iowa, who previously split evenly or favored conservative candidates, are breaking toward candidates offering specific cost-relief and trade stabilization policies.
- The Tariff Dilemma: While agricultural subsidies offer temporary liquidity, farm leaders increasingly advocate for open export markets over government bailouts, citing long-term market access as vital for generational farms.
- Turnout Dynamics: High-dollar national ad spending from both political parties is pouring into Iowa’s media markets, reflecting the strategic importance of the state in deciding national control of the U.S. Senate.
What to Watch Next
- Farm Bill & Subsidy Appropriations: How federal agricultural relief programs are structured prior to November will directly influence late-deciding agricultural voters.
- Energy Overhead & Diesel Spot Prices: Any stabilization or further spike in harvest-season fuel costs will serve as an economic bellwether for rural voter sentiment.
- Turnout in All 99 Counties: Ground mobilization efforts across Iowa’s rural townships will determine whether the polling shift translates into turnout at the ballot box.
Discover more from The Economy
Subscribe to get the latest posts sent to your email.


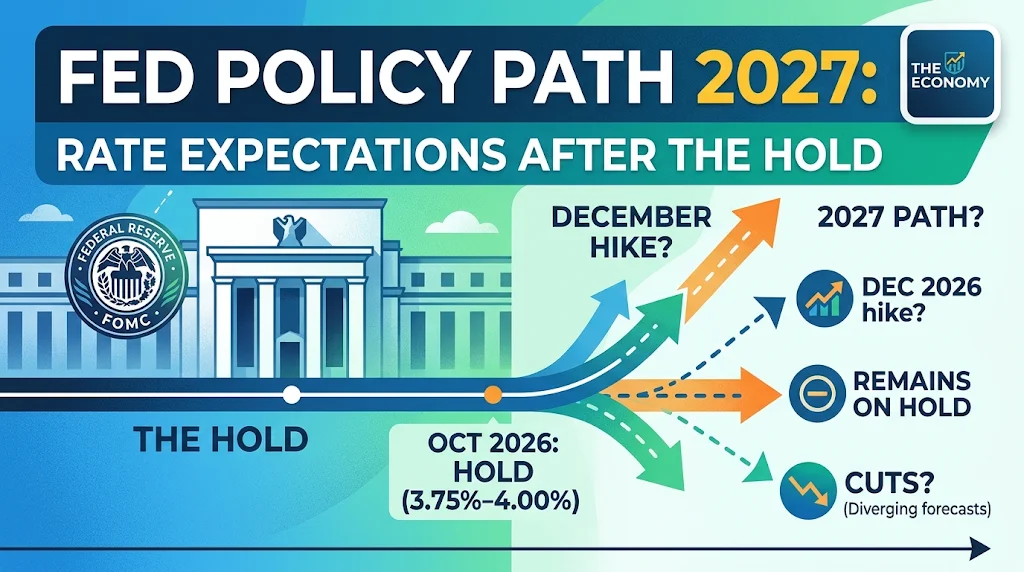
The Federal Reserve kept its policy rate unchanged in late October 2026, with two officials dissenting in favor of a hike, and the next move is now debated between a December increase and a longer hold into 2027. The federal funds target range was 3.75% to 4.00% after the October meeting, according to J.P. Morgan’s summary of the decision. The 2027 path depends on whether inflation eases enough for cuts to resume or stays high enough to keep tightening on the table.
Key Takeaways
- The Fed held rates in October 2026 despite elevated inflation, with two dissents favoring a quarter-point increase, per Charles Schwab’s meeting summary.
- Several major forecasters expect a December 2026 hike, including J.P. Morgan’s economists, who said the statement signaled a “hawkish bias.”
- Rabobank now expects the Fed to remain on hold through 2027, with one cut per year in 2028 to 2030.
- Goldman Sachs’s June forecast pushed its final two cuts of the cycle to June and December 2027, though its view predates the autumn hawkish turn.
- The Fed will hold eight meetings in 2027, but one will be devoted to strategy with no rate vote, which reduces scheduled chances to adjust policy.
Where Policy Stands Now
The Fed cut rates three times in late 2025, bringing the target range to 3.50% to 3.75% by December, according to a JPMorgan Asset Management review. The range sat at 3.75% to 4.00% at the October 2026 meeting, which means the committee moved toward restriction in 2026 rather than continuing to ease.
Two developments define the current debate. First, inflation has remained above target, with energy prices and tariffs cited by analysts as contributors. Second, Kevin Warsh now chairs the Fed, and his first meetings have been closely watched for signals about strategy. Schwab reported that Governor Lisa Cook and Cleveland Fed President Beth Hammack were among those opposing the hold, though reports differ on the exact dissent details, so verify against the official FOMC statement before publication.
Editors should note that the December 2025 Summary of Economic Projections, published by the New York Fed, is now out of date. It projected a median federal funds rate of 3.4% for 2026 and 3.1% for 2027. Those projections have been overtaken by the 2026 rate decisions and should be cited only as historical context.
The Case for a December Hike
The hawkish case rests on inflation and the committee’s language. J.P. Morgan’s economists interpreted the October statement as keeping December “a live option” for a hike, and they continue to expect one. Schwab reported that some forecasters, including Shah of Saxo, expected an increase in December and another in early 2027.
The argument for tightening is straightforward: if inflation expectations drift upward, the Fed risks losing credibility unless it acts. Oil price spikes linked to Middle East conflict and tariff pass-through have been cited as reasons that price pressures may persist.
Signals that would raise the odds of a hike:
- Core inflation readings that stay above target for consecutive months
- Strong payroll growth that tightens labor markets further
- Rising longer-term inflation expectations in Fed surveys
- Hawkish language in speeches by voting members before the December meeting
The Case for a Longer Hold
Rabobank’s updated view is that the Fed will stop short of further tightening and wait for data. Its analysts argue that the committee will likely stop at a higher neutral rate than its own projections suggest, but they do not expect a December move. After the hold, they see one cut annually from 2028 through 2030.
The hold case also rests on fiscal timing. Continuum Economics has argued that fiscal easing, including tax rebates scheduled to take effect in the first quarter of 2027, would give the Fed reason to wait and observe the effect before adjusting policy.
Signals that would support a hold:
- Inflation trending down toward target without a recession
- Softer hiring data, particularly in payroll and jobless claims
- Stable inflation expectations in consumer and market surveys
- Lower energy prices reducing headline inflation
Forecasts Are Diverging
The range of views is wide, which is itself a finding. Goldman Sachs, in June 2026, pushed its expected cuts into mid-2027. Rabobank now sees no cuts through 2027. J.P. Morgan sees a hike first. Markets have at times priced more hikes than economists, as Goldman noted in its analysis that market pricing sat above its own forecasts.
For readers, the practical takeaway is that rate expectations are uncertain in both directions. A single forecast should not be treated as a plan.
What the 2027 Meeting Calendar Changes
Warsh announced that one of the eight 2027 FOMC meetings will be devoted to “broad monetary policy strategy” without a rate decision or post-meeting statement. Fewer decision points could make the Fed slower to react to sudden shocks, though it could also reduce the risk of abrupt policy swings.
Investors should check the Fed’s official calendar and confirm which meetings include a rate vote, since the strategy meeting will not produce a rate announcement.
What This Means for Borrowers and Savers
For borrowers, the key variable is the longer end of the curve. Mortgage and corporate borrowing costs track Treasury yields more closely than the fed funds rate. A hold at restrictive levels keeps variable-rate debt expensive, while a December hike would add further pressure.
For savers, higher policy rates support yields on short-term deposits and Treasury bills. If the Fed holds through 2027, savings products may remain competitive, though yields could decline if cuts arrive later.
Practical steps:
- Review variable-rate debt and consider the cost of a 25-basis-point increase.
- Ladder short-term deposits or Treasury bills to reduce reinvestment risk.
- Avoid locking in long-term rates based on a single forecast.
Frequently Asked Questions
What is the current federal funds rate?
The target range was 3.75% to 4.00% after the October 2026 meeting, according to J.P. Morgan’s summary. Check the Federal Reserve’s website for the latest decision.
Will the Fed raise rates in December 2026?
Possibly. J.P. Morgan expects a hike, while Rabobank has added one to its forecast before resuming a hold. Markets and analysts disagree, and the outcome will depend on incoming inflation and jobs data.
When will the Fed cut rates again?
Forecasts vary. Rabobank sees no cuts through 2027. Goldman Sachs’s June forecast expected cuts in mid-2027, though that view predates the autumn hawkish turn.
Who is the Fed chair?
Kevin Warsh chairs the Federal Reserve as of late 2026, according to reports of the October meeting.
How many Fed meetings will have rate decisions in 2027?
Seven of the eight scheduled 2027 meetings are expected to include rate decisions. One is designated for strategy discussions without a rate vote.
How should homeowners prepare for a longer hold?
Consider the cost of variable-rate debt, compare refinancing options, and plan for mortgage rates that track longer-term Treasury yields more closely than the policy rate.
Conclusion: Plan for Both Outcomes
The 2027 rate path is genuinely uncertain. A December hike, a longer hold, or an eventual return to cuts are all plausible given current forecasts. The best guide is incoming data on inflation and jobs, along with the Fed’s own statements. Readers should treat forecasts as scenarios to prepare for rather than predictions to bet on.
Discover more from The Economy
Subscribe to get the latest posts sent to your email.
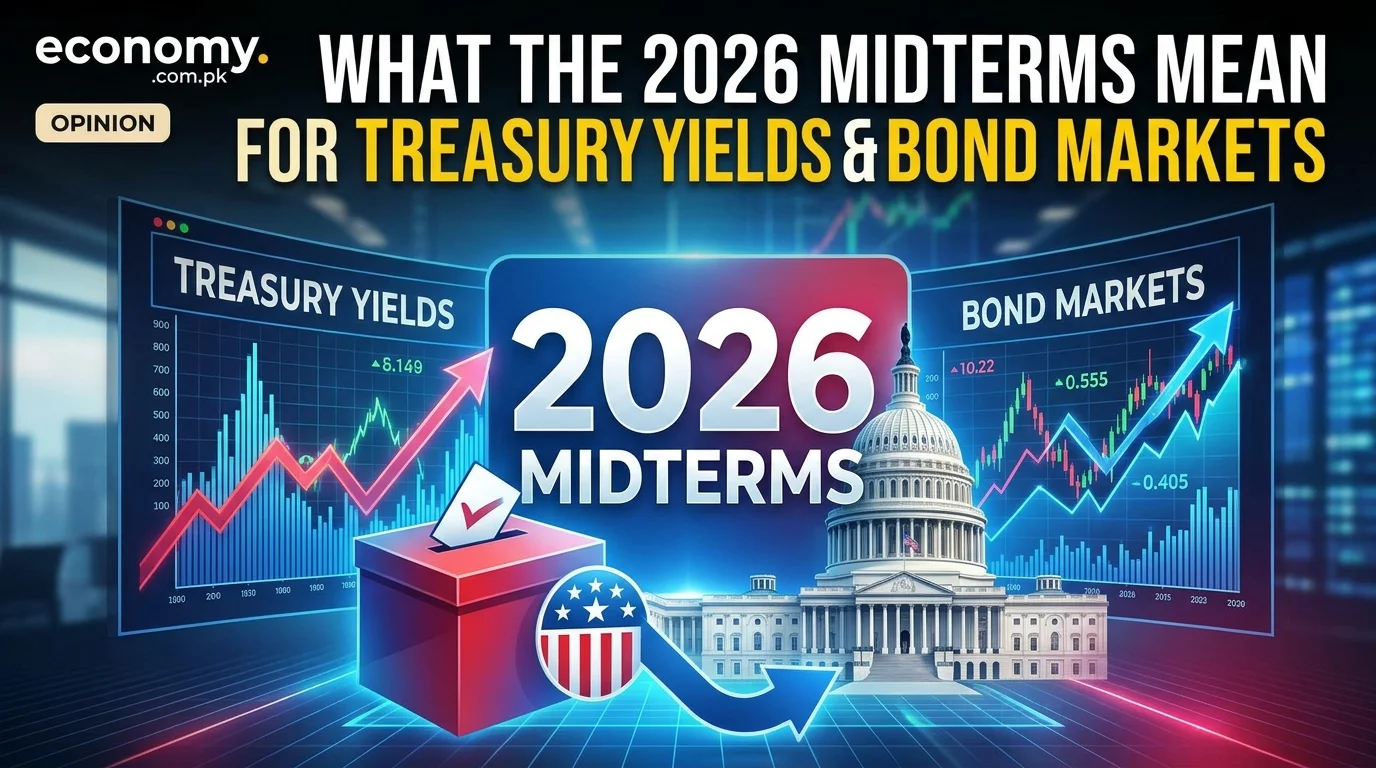
The Democratic sweep of Congress in the November 3, 2026 midterms pulled the 10-year U.S. Treasury yield lower, as investors priced in a possible check on new federal borrowing. The benchmark fell from about 4.95% to 4.89% on election-week trading, and dipped to roughly 4.83% by November 5, its lowest level since September, according to market data reported by Morningstar/Dow Jones and Trading Economics. The move is real, but history suggests it is a weak guide to where yields go next.
Key Takeaways
- The 10-year yield fell roughly 50 basis points from its early-October highs, which had reached multi-decade levels, according to WisdomTree’s rates analysis.
- Bond investors read divided or gridlocked government as a possible brake on borrowing, but that thesis is contested.
- The Federal Reserve, not the election, is the bigger near-term driver. Markets have discussed a possible December rate hike.
- WisdomTree’s central expectation is a 10-year trading range of 4.50% to 5.25% into the coming months.
- Post-midterm history is mixed: Bloomberg-compiled data show yields were lower on average one and 12 months after comparable results, but individual cases vary widely.
Why the Election Moved Bonds at All
Bond markets care about supply. Every dollar of federal deficit must be financed by Treasury auctions, and the more the government borrows, the more investors must be paid to hold the debt. A unified Democratic government could theoretically expand spending, which would normally push yields up. The election result, however, was read as the opposite: a divided or narrowly controlled Washington that makes large new spending bills harder to pass.
That interpretation drove the initial rally. Morningstar reported that the two-year yield fell to a two-month low of 4.546% on the day after the results, while the 30-year yield declined from 5.323% to 5.282%. The sharpest moves came in the front end of the curve, where investors had been pricing a more aggressive Fed.
Bond strategists are not fully convinced. WisdomTree argues that divided government may not reduce deficits at all, because bipartisan spending agreements and existing fiscal commitments can keep Treasury borrowing needs high regardless of who controls Congress. In other words, the political headline may matter less than the arithmetic of entitlement spending, interest costs, and tax policy already on the books.
The Fed Matters More Than Congress
For the next several months, Federal Reserve policy is likely to outweigh the midterms in setting the tone for Treasuries. Through September, Fed officials had signaled that further rate increases might be needed to bring inflation back toward target, and markets priced at least one more hike for 2026. WisdomTree’s analysis suggests the election should have only limited direct effect on that policy path, with a December move still possible after October’s jobs report.
This matters for bond investors because a rate hike shifts the short end of the curve first, but it also influences long-term yields through inflation expectations and term premiums. If the Fed tightens while the market doubts the government’s fiscal discipline, the long end can rise even as short-term yields stabilize.
A practical framework for readers tracking this:
- Watch the Fed’s December decision and the statements that accompany it. A hawkish surprise will likely lift yields across the curve.
- Track monthly jobs and inflation data. Strong employment and sticky price pressures have been the main reasons yields rose this autumn.
- Monitor Treasury auction results. Weak demand at longer maturities is an early sign that investors are demanding more compensation for duration risk.
- Follow oil prices and geopolitical headlines. Energy-driven inflation expectations have repeatedly pushed yields around in 2026.
What the Historical Record Actually Shows
Midterm years are often assumed to produce predictable bond outcomes, but the record is noisy. Analysis from Capital Group and others cited in recent market commentary found that, from the mid-1950s through 2022, the 12 months ending in November of midterm years produced roughly a coin-flip pattern: an average change of about one basis point, a median close to zero, and yields rising in roughly half of cases.
Two comparisons illustrate how unreliable the political signal can be. In 1983, a Republican president faced a Democratic House and a Republican Senate, and the 10-year yield rose by about 129 basis points. In 2019, under a broadly similar political structure, the yield fell by about 97 basis points. Same configuration, opposite outcomes. The difference was inflation, Fed policy, and growth conditions, not the partisan label.
Bloomberg-compiled data offer a more favorable reading for the current situation. Benchmark 10-year yields have tended to be lower on average one and 12 months after midterms that produce a comparable result. That pattern is suggestive rather than predictive. A sample of a few dozen election cycles cannot isolate the effect of partisan control from the macro environment at the time.
Where Yields Could Go Into 2027
The most useful way to think about the 10-year yield is as a range shaped by three forces: Fed policy, inflation expectations, and the supply of Treasury debt. Each is currently pulling in a different direction.
Upward pressure comes from persistent inflation, a Fed still open to tightening, and a large federal deficit that requires heavy issuance. The 10-year yield’s early-October run to multi-decade highs showed how quickly sentiment can shift when those factors align.
Downward pressure comes from a possible slowdown in economic growth, a flight to safety during equity sell-offs, and a political environment that may limit new spending. Equity weakness in early November temporarily supported Treasuries as investors sought safe assets.
Given these crosscurrents, WisdomTree’s expected range of 4.50% to 5.25% is a reasonable planning band rather than a forecast of a specific level. Readers should treat any single-point projection with caution. The distribution of outcomes is wide, and the main risk is a surprise from the Fed or a sharp repricing of inflation.
What This Means for Borrowers, Savers, and Investors
For homebuyers and businesses, the 10-year yield is the reference point that anchors mortgage rates and many corporate borrowing costs. A move toward the lower end of the expected range would ease pressure on mortgage pricing, while a return above 5% would likely keep housing affordability constrained.
For savers, higher yields on short-term Treasuries remain attractive, but the trade-off is reinvestment risk if the Fed eases later. Investors holding long-duration bonds face the opposite exposure: they gain if yields fall and lose if inflation or fiscal worries push them higher.
Practical steps for individuals with exposure to rates:
- Match bond duration to your time horizon rather than trying to time the election-driven moves.
- Consider how much of your portfolio is sensitive to a 50 to 100 basis point move in yields.
- Revisit fixed-rate debt decisions if your borrowing plans are tied to mortgage or refinancing timelines.
Frequently Asked Questions
Did the midterm elections cause Treasury yields to fall?
The results contributed to a decline. The 10-year yield dropped after the Democratic sweep, as investors interpreted divided or constrained government as a possible limit on new borrowing. Other factors, including oil prices, Fed commentary, and an equity sell-off, also influenced the move.
Where is the 10-year Treasury yield now?
In the days after the election, the 10-year traded in the high 4% range, with reports placing it near 4.83% to 4.9% in early November. Yields move daily, so check a live source such as the Treasury Department’s daily yield curve before making decisions.
Will the Fed raise rates in December 2026?
A December hike remains possible, according to WisdomTree’s analysis, particularly if October’s jobs data and inflation readings keep pressure on the Fed. Markets are not certain, and the outcome will depend on incoming data.
Do midterm elections reliably move bond markets?
No. Historical comparisons show wide variation. Bloomberg-compiled data suggest yields have tended to be lower in the year after comparable midterms, but cases such as 1983 and 2019 demonstrate that inflation and Fed policy usually matter more than the political configuration.
What is a reasonable 10-year yield range for 2027?
WisdomTree’s current central range is 4.50% to 5.25%. This is a planning band, not a precise forecast, and the outcome depends heavily on inflation and Fed decisions.
Does a divided Congress reduce the federal deficit?
Not necessarily. Analysts note that bipartisan spending deals and existing fiscal commitments can keep borrowing high even under divided government, so the deficit trajectory depends on policy choices beyond party control.
How should I position a bond portfolio after the midterms?
Focus on duration that matches your time horizon, diversify across maturities, and avoid making large directional bets based on the election alone. Consider consulting a licensed financial adviser for decisions tied to your specific situation.
Conclusion: Watch the Fed and the Deficit, Not Just the Vote
The 2026 midterms moved Treasury yields, but the lasting story is likely to be the interaction between Fed policy and federal borrowing. The election gave bond investors a reason to hope for fiscal restraint, yet the arithmetic of deficits and inflation has not changed. Readers should expect volatility, track the December Fed decision and incoming inflation data, and treat any single forecast with skepticism.
For ongoing coverage, follow Treasury auction results, Fed communications, and monthly economic releases. Those signals will tell you more about where yields are headed than the election headline alone.
Discover more from The Economy
Subscribe to get the latest posts sent to your email.

Global merchandise trade continues to expand in 2026 even as the United States and other major economies impose sweeping tariffs and non-tariff barriers. The WTO’s Goods Trade Barometer reached 102.0 in September 2026, remaining comfortably above the 100 baseline that signals trend growth. AI-related goods have become the dominant driver, accounting for a sharply rising share of incremental trade volumes and offsetting the drag from higher duties. WTO data via Peacock Tariff Consulting
This resilience is not uniform. Traditional consumer and intermediate goods face clearer headwinds, while semiconductors, servers, networking equipment, and other AI infrastructure components are expanding rapidly. At the same time, Section 301 measures and broader tariff actions have accelerated supply-chain diversion toward Vietnam, India, Mexico, and selected other locations. Economic Times citing DHL-Stern and WTO/OECD
For businesses, investors, and policymakers the central question is whether AI-driven capital expenditure can keep outweighing protectionist pressures through 2027, or whether a slowdown in hyperscaler spending would quickly expose the underlying fragmentation of the trading system.
Table of Contents
- Why Is Global Trade Growing Despite High Tariffs?
- What Does the WTO Goods Trade Barometer Actually Show?
- How Are AI Goods Driving Trade Volumes?
- What Role Do Section 301 and Other Tariffs Play?
- Which Countries Are Winning and Losing from Diversion?
- What Are the Risks to the 2026–27 Outlook?
- Key Takeaways
- Frequently Asked Questions
Why Is Global Trade Growing Despite High Tariffs?
Merchandise trade volumes rose in the first half of 2026. WTO figures indicated roughly 1.9 percent quarter-on-quarter growth in the first quarter and stronger year-on-year comparisons. The composition of that growth matters more than the headline: restrictive measures (tariff increases, import bans, quantitative restrictions, and subsidies) have surged, yet overall volumes have not contracted. Peacock Tariff Consulting
Two forces dominate. First, explosive demand for AI-enabling goods. Second, firms’ ability to absorb, reroute, or re-invoice around higher duties rather than halt trade. DHL and NYU Stern raised their 2026 goods-trade growth forecast to 4.6 percent, explicitly citing adaptation and the AI boom. Almost three-quarters of cross-border commerce still occurs under relatively low WTO-bound tariff rates, providing a floor. Economic Times
What Does the WTO Goods Trade Barometer Actually Show?
The September 2026 reading of 102.0 was up from 101.7 in June and sits above the index’s long-term baseline of 100. Component indicators linked to export orders, international air freight, and container shipping remained supportive. The barometer is a leading indicator; hard volume data through mid-2026 have largely confirmed the signal. Peacock Tariff Consulting
Importantly, the index captures activity even while the policy environment is the most restrictive in a generation. Trade-easing measures have lost relative momentum, so the expansion is occurring against a deteriorating rules backdrop.

How Are AI Goods Driving Trade Volumes?
AI-related products accounted for approximately 42 percent of merchandise trade growth in 2025. That share jumped toward 76 percent of incremental growth in the first quarter of 2026, according to WTO and OECD data referenced in recent analyses. Semiconductors, high-bandwidth memory, servers, and networking gear have become the single largest growth engine. Economic Times
This concentration creates both upside and vulnerability. As long as hyperscalers and sovereign AI projects continue heavy capital expenditure, trade volumes receive a powerful tailwind. Any pause or downward revision in those spending plans would subtract the primary growth driver almost immediately.
What Role Do Section 301 and Other Tariffs Play?
In 2026 the United States layered additional Section 301 tariffs covering a very large share of imports from major partners, with many rates in the 10–12.5 percent range and higher duties on selected products. These measures were partly framed around forced-labour and supply-chain security concerns. Earlier IEEPA-based actions faced legal challenges, prompting reliance on other authorities. Peacock Tariff Consulting
The practical effect has been higher landed costs and accelerated diversion rather than a collapse in total trade. Companies have shifted assembly, testing, and final billing locations while still moving physical goods.
Which Countries Are Winning and Losing from Diversion?
Vietnam, India, and Mexico have been the clearest near-term beneficiaries in electronics and certain intermediate goods. Smaller exporters in South and Southeast Asia have faced collateral damage from higher baseline tariffs that do not distinguish finely among sources. China’s direct share has been under pressure, yet Chinese-owned or Chinese-linked capacity in third countries has often captured the redirected orders. [Economic Times and related trade analyses]
Trade Growth Drivers 2026 – Comparative Impact
| Driver | Volume Impact | Policy Sensitivity | Durability | Notes |
|---|---|---|---|---|
| AI / semiconductor goods | Strong positive | Medium | High if capex holds | Dominant engine |
| Traditional consumer goods | Modest / negative | High | Low | Tariff-sensitive |
| Energy & commodities | Mixed | High | Geopolitical | Hormuz / sanctions risk |
| Digital services | Positive | Lower | High | Outside goods barometer |
What Are the Risks to the 2026–27 Outlook?
The largest downside risk is a slowdown in AI infrastructure spending. Secondary risks include further tariff escalation, successful legal challenges that create uncertainty, energy or shipping disruptions, and a broader global growth disappointment. Upside would come from faster-than-expected supply-chain adaptation or additional fiscal support for strategic industries in multiple countries.
Key Takeaways
- WTO Goods Trade Barometer remains above 100 despite record tariffs and restrictions.
- AI-related goods are the primary reason volumes are still rising.
- Section 301 and parallel measures are redirecting rather than stopping flows.
- Vietnam, India, and Mexico are the clearest diversion winners so far.
- A slowdown in hyperscaler and AI capital expenditure is the biggest threat to the outlook.
Frequently Asked Questions
Is global trade actually growing in 2026?
Yes. WTO volume data, the Goods Trade Barometer, and independent forecasts such as DHL-Stern all show positive growth led by AI goods.
Why hasn’t the tariff surge collapsed trade?
Firms are rerouting supply chains and AI demand is currently strong enough to more than offset higher costs in the fastest-growing categories.
Which countries benefit most from trade diversion?
Vietnam, India, and Mexico have captured the largest redirected flows in electronics and related intermediate goods.
What is the single biggest risk to the current trade outlook?
A sharp slowdown or deferral in AI-related capital spending by hyperscalers and governments.
How do the 2026 Section 301 tariffs differ from earlier rounds?
They are broader in coverage, sit on top of existing duties, and have been paired with other restrictive tools, producing wider diversion effects.
Conclusion
Global trade in 2026 is being pulled in opposite directions: the most restrictive policy environment in decades on one side and an historic AI infrastructure boom on the other. So far the boom is winning, keeping the WTO barometer above trend and supporting positive volume growth. For economy, finance, and foreign-policy audiences, the critical variables to watch through 2027 are hyperscaler capex guidance, the durability and legal status of Section 301 measures, and whether diversion gains in Asia and Mexico prove structural. The next four to six quarters will reveal whether AI demand can continue to mask a more fragmented trading system or whether protectionism finally exerts a clearer drag.
Discover more from The Economy
Subscribe to get the latest posts sent to your email.

Tesla Cybercab and Robotaxi Economics in a Post-Midterm Environment

Impact of Pakistan’s Auto Policy on Local Manufacturers and Importers

Anthropic’s Financials and the AI Investment Thesis

Open Banking Trends 2026: What Consumers Should Know

Nvidia After the Selloff: What to Watch Before Earnings

Black Friday 2026 Early Deals: A Data-Driven Shopping Guide

Fed Policy Path 2027: Rate Expectations After the Hold

Asia’s Economic Resilience in 2026: The Strategic Blueprint for Sustaining the Global Growth Engine

Credit Scoring Changes 2026: What Mortgage Buyers Need to Know

10-Year Treasury Yield Outlook for 2027 After the Democratic Sweep

Is the AI Infrastructure Boom Sustainable? A Reality Check

Disability Insurance Demand in 2026: Who’s Buying and Why

What the 2026 Midterms Mean for Treasury Yields and Bond Markets

Payroll Outlook After the Midterms: 2027 Tax Changes, Compliance Risks and AI Trends

Dow Jones Today: Dow Slips 237 Points After the Worst Day Since April 2025

US–Iran Conflict in October 2026: Hormuz, Oil Prices and Diplomacy

Pakistan IMF Programme 2026: Why Bailouts Keep Returning

Singapore Stock Market Outlook 2027: The STI’s Bank-and-Yield Test

SSI November 2026 Payment: Why Benefits Arrive October 30

IMF Global Outlook 2027: The Recovery Is Real, but the Divide Is Growing

2027 Federal Tax Brackets: New IRS Rates and Standard Deductions Explained

World Bank Debt Report 2026: The $9.4 Trillion Burden Behind the Recovery

Stock Market Crash 2026? What the November Rout Actually Tells Us

KSE-100 Index 2026: Is Pakistan’s Stock-Market Recovery Sustainable?

Germany–France ‘Made in Europe’ Deal Could Reshape China’s EV Ambitions

Zhuhai Airshow 2026: How China’s Stealth Jets, Drones and Missiles Are Redrawing Global Air Power

Global Markets Today: The AI Sell-Off Has Become a Test of Liquidity

Singapore’s Bank Sell-Off Is Really a Test of What Stability Is Worth
-

 Markets & Finance10 months ago
Top 15 Stocks for Investment in 2026 in PSX: Your Complete Guide to Pakistan’s Best Investment Opportunities
-

 Analysis9 months ago
Johor’s Investment Boom: The Hidden Costs Behind Malaysia’s Most Ambitious Economic Surge
-

 Analysis9 months ago
Top 10 Stocks for Investment in PSX for Quick Returns in 2026
-

 Banks10 months ago
Best Investments in Pakistan 2026: Top 10 Low-Price Shares and Long-Term Picks for the PSX
-

 Analysis9 months ago
Brazil’s Rare Earth Race: US, EU, and China Compete for Critical Minerals as Tensions Rise
-

 Investment10 months ago
Top 10 Mutual Fund Managers in Pakistan for Investment in 2026: A Comprehensive Guide for Optimal Returns
-

 Global Economy11 months ago
15 Most Lucrative Sectors for Investment in Pakistan: A 2025 Data-Driven Analysis
-

 Global Economy11 months ago
Pakistan’s Export Goldmine: 10 Game-Changing Markets Where Pakistani Businesses Are Winning Big in 2025