
Markets & Finance
Gold Falls 3.7% as Yields Surge: Is Gold Still a Safe Haven in 2026?


Key Takeaways
- Sharp Correction: Gold dropped 3.71% in a single session to settle at $4,127/oz as risk-free yields hit decade-high levels.
- Opportunity Cost Dynamics: Real interest rates (nominal yield minus inflation expectations) reached positive territory, reducing the relative appeal of holding non-interest-bearing precious metals.
- Dollar Strength: A soaring US Dollar Index (DXY) compounded selling pressure on dollar-denominated commodities globally.
- Central Bank Buying Cushion: Despite market pullbacks, persistent demand from global central banks provides a long-term structural floor for precious metals.
Decoupling Bullion from Inflation: The Real Rate Paradox
Gold has historically served as a primary hedge against currency devaluation and runaway inflation. However, in short-to-medium timeframes, real yields maintain a strong inverse correlation with precious metal spot prices.
As reported by Reuters, the sudden adjustment in US fixed-income markets triggered an automated sell-off across precious metal futures contracts.$$\text{Real Yield} = \text{Nominal Treasury Yield} – \text{Expected Inflation Rate}$$
When nominal yields on the US 10-year Treasury move to 5.244% while inflation expectations remain anchored around 2.5%, the real yield expands to roughly 2.74%. When investors can secure an inflation-adjusted 2.74% return guaranteed by the US government, holding zero-yield physical gold becomes costlier to balance sheets.
       Inverse Correlation: US Real Yields vs Spot Gold

  Real Yield (%)                                    Gold ($/oz)
   +2.75% |----------------------------------------* $4,127
          |                                       /
   +2.00% |                                *-----* $4,280
          |                         *-----*
   +1.20% |                  *-----* $4,450
          +---------------------------------------------------
           Q1 2026        Q2 2026        Q3 2026
Energy-Driven Inflation vs. Yield Multipliers
While rising bond yields suppress precious metals, underlying commodity price surges present a conflicting force. Ongoing geopolitical tensions in the Strait of Hormuz and potential diesel export restrictions have reignited cost-push inflation fears.
Financial market intelligence from MarketWatch indicates that institutional portfolio managers are currently split:
- The Tactical Bears: Shorting gold futures to lock in elevated fixed-income coupon payments while real rates rise.
- The Structural Bulls: Accumulating physical gold during price pullbacks as a hedge against potential global energy supply shocks and geopolitical instability.
Gold Price Forecast & Commodity Performance Metrics
The precious metals sector has experienced broad realignment following the broader fixed-income selloff.
Precious Metals & Energy Asset Performance Matrix
| Asset | Current Spot Price | Weekly Change | 1-Year Trailing Return | Key Macro Driver |
| Gold (XAU/USD) | $4,127.00 / oz | -3.71% | +22.4% | Surging US Treasury Yields |
| Silver (XAG/USD) | $48.50 / oz | -5.12% | +18.9% | Industrial demand slowdown |
| Platinum | $1,210.00 / oz | -2.10% | +8.3% | Automotive supply chain constraints |
| Crude Oil (WTI) | $94.20 / barrel | +4.85% | +31.2% | Middle East supply bottleneck risks |
Data metrics published by S&P Global underline that while speculative paper gold is experiencing outflows, physical delivery demand across Asian markets remains historically elevated.
Portfolio Strategy: How to Allocation Gold at $4,100+
Investors seeking to balance wealth preservation with income generation in late 2026 should evaluate a three-tier precious metals framework:
- Dollar-Cost Averaging (DCA): Avoid allocating capital in single lump sums during yield spikes. Systematically purchase physical bullion or gold ETFs during market pullbacks.
- Gold Mining Equities: Look for top-tier gold miners with low all-in sustaining costs (AISC) below $1,800/oz. These firms generate strong cash flows even when gold pulls back to $4,100.
- Barbell Allocation: Combine short-term Treasuries yielding 5.2%+ with a 5%–10% strategic allocation to precious metals to protect portfolios against system liquidity shocks.
Frequently Asked Questions (FAQ)
Why does gold drop when Treasury yields go up?
Gold does not pay interest or dividends. When Treasury yields rise, investors can earn higher risk-free returns on cash and bonds. This raises the “opportunity cost” of holding gold, leading traders to sell bullion in favor of yield-bearing assets.
Is $4,127 a good entry price for buying physical gold?
While short-term technical indicators suggest volatility as US bond yields adjust, many institutional analysts consider pullbacks toward $4,100 strong long-term entry points for hedging against currency debasement and geopolitical risks.
How does the US dollar index (DXY) impact gold prices?
Gold is predominantly priced in US dollars globally. When bond yields rise, capital flows into the US dollar, causing the dollar to appreciate. A stronger dollar makes gold more expensive for buyers using foreign currencies, reducing international demand and pulling prices lower.
Discover more from The Economy
Subscribe to get the latest posts sent to your email.


Global Economy
Battle for the Farm Belt: How Tariff Pressures and Fuel Costs Are Reshaping Iowa’s 2026 Midterms

DES MOINES, Iowa — In America’s agricultural heartland, the political landscape heading into the 2026 midterm elections is undergoing its most significant realignment in a decade. Surging fuel overhead, escalating global trade frictions, and rising input costs are convergence points putting traditional Republican strongholds in Iowa under intense electoral pressure.
1. The Economic Squeeze in Rural Iowa
At the center of Iowa’s political shift is a dual economic pressure hitting family farms and agricultural enterprises:
- Energy and Transportation Overhead: Following energy market disruptions, diesel prices across the Midwest surged past $6.50 per gallon, representing a nearly 76% increase year-over-year. For producers managing heavy machinery, grain haulage, and supply chain logistics, fuel overhead has eroded operational margins.
- Trade and Commodity Price Suppression: Retaliatory tariffs on major American exports—specifically soybeans and corn—have created volatility in key foreign markets. Soybean prices have faced downward pressure, directly reducing farm incomes across 95% of Iowa’s primary crop-producing counties.
- Compound Input Inflation: Higher costs for nitrogen-based fertilizers, commercial seeds, and equipment financing have compounded household financial strain.
According to financial impact studies published in the Associated Press Midterm Report, agricultural producers across the Midwest are facing a sharp pinch between fixed operational costs and suppressed market yields, turning economic survival into a core campaign issue.
2. Polling Breakdown: Marist Survey Highlights Key Shifts
Political dynamics in Iowa—long viewed as a stable red baseline—have tightened dramatically across statewide contests.
Data compiled in the Marist Poll September 2026 Survey highlights significant headwinds for incumbent political alignments:
| Electoral Measure | Current Polling Metric | Key Demographic / Breakdown |
| U.S. Senate Race | Josh Turek (D): 50% Ashley Hinson (R): 42% | Independent voters favoring Turek; cost-of-living cited as primary issue. |
| Gubernatorial Race | Rob Sand (D): 54% Zach Lahn (R): 42% | Sand holding a 57%–33% advantage among independent statewide voters. |
| Generic Congressional Ballot | Democrat: 50% Republican: 45% | Shift in suburban and mixed rural-suburban congressional districts. |
| Presidential Job Approval | Disapprove: 58% Approve: 41% | Plurality of voters (43%) report their ballot is a vote against current federal policies. |
| Household Financial Sentiment | Worse Off: 46% Unchanged: 39% / Better: 15% | High fuel prices and grocery inflation drive negative financial sentiment. |
3. The Re-Alignment of the Rural Swing Vote
In previous election cycles, agricultural state voters historically prioritized regulatory relief and federal tax incentives. However, the 2026 midterm cycle demonstrates that affordability and cost containment have superseded traditional party loyalties.
Analysis from the Brookings Institution Midterm Governance Report indicates that when Presidential approval ratings dip among agricultural constituents, down-ballot candidates face immediate fallout:
- The Independent Pivot: Independent voters in Iowa, who previously split evenly or favored conservative candidates, are breaking toward candidates offering specific cost-relief and trade stabilization policies.
- The Tariff Dilemma: While agricultural subsidies offer temporary liquidity, farm leaders increasingly advocate for open export markets over government bailouts, citing long-term market access as vital for generational farms.
- Turnout Dynamics: High-dollar national ad spending from both political parties is pouring into Iowa’s media markets, reflecting the strategic importance of the state in deciding national control of the U.S. Senate.
What to Watch Next
- Farm Bill & Subsidy Appropriations: How federal agricultural relief programs are structured prior to November will directly influence late-deciding agricultural voters.
- Energy Overhead & Diesel Spot Prices: Any stabilization or further spike in harvest-season fuel costs will serve as an economic bellwether for rural voter sentiment.
- Turnout in All 99 Counties: Ground mobilization efforts across Iowa’s rural townships will determine whether the polling shift translates into turnout at the ballot box.
Discover more from The Economy
Subscribe to get the latest posts sent to your email.
Asset Managment companies
MAS Allocates S$1.45 Billion to Five Asset Managers in Third EQDP Batch: Total Deployment Reaches S$5.4 Billion
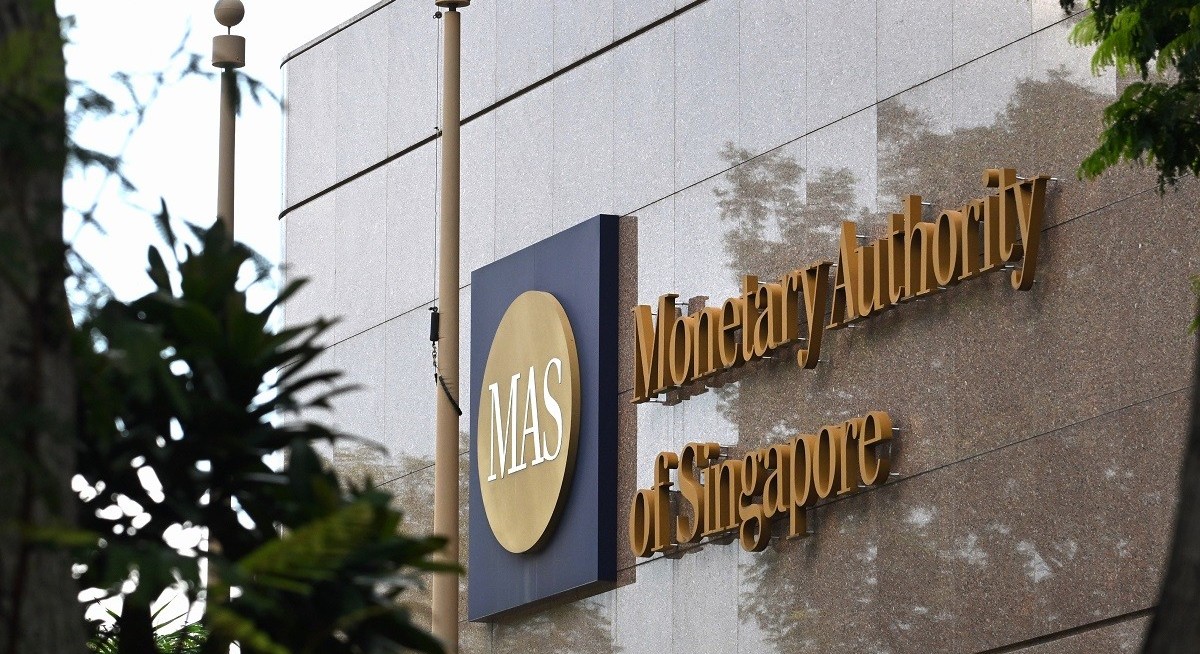
The Monetary Authority of Singapore (MAS) has appointed five asset managers — Amundi, Franklin Templeton, HSBC Asset Management, M&G Investments and Natixis Investment Managers — under the third batch of its Equity Market Development Programme (EQDP), deploying a further S$1.45 billion into Singapore’s equity market.
The announcement, made by Minister for National Development and MAS Deputy Chairman Chee Hong Tat at the SuperReturn Asia conference on 29 September 2026, takes total EQDP allocations to S$5.4 billion across 14 managers — 83% of the programme’s expanded S$6.5 billion war chest, following its top-up at Budget 2026.
Alongside the appointments, MAS committed S$20 million from the Financial Sector Development Fund to a new GEMS Market Making Grant aimed at tightening bid-ask spreads in roughly 80 small and mid-cap stocks outside the Straits Times Index.
What is the EQDP? A quick recap
The EQDP was launched in February 2025 as a flagship demand-side measure of the Equities Market Review Group, which MAS convened in August 2024 to revive the Singapore Exchange (SGX). Its twin objectives: develop Singapore’s local fund management industry, and channel sustained institutional capital into Singapore-listed equities — including cornerstone participation in IPOs.
EQDP deployment: the full picture so far
Table
| Batch | Date | Managers | Allocation |
|---|---|---|---|
| Batch 1 | July 2025 | Avanda Investment Management, Fullerton Fund Management, JPMorgan Asset Management | S$1.1 billion |
| Batch 2 | November 2025 | Amova Asset Management, AR Capital, BlackRock, Eastspring Investments, Lion Global Investors, Manulife Investment Management | S$2.85 billion |
| Batch 3 | September 2026 | Amundi, Franklin Templeton, HSBC Asset Management, M&G Investments, Natixis Investment Managers | S$1.45 billion |
| Total | 14 managers | S$5.4 billion |
The third batch brings a notably more international flavour than earlier rounds. In his SuperReturn Asia speech, Chee said these managers “bring with them global distribution networks, sources of capital, and expertise that strengthen the depth and dynamism of our public markets” — meaning EQDP money is now explicitly designed to pull in foreign capital alongside domestic allocations.
S$20 million GEMS Market Making Grant: liquidity for the “missing middle”
The second announcement targets a chronic weakness of the SGX: thin trading in its small and mid-cap segment. The new GEMS Market Making Grant will:
- Fund appointed market makers providing liquidity for an initial group of around 80 eligible stocks outside the STI, plus newly listed counters
- Run until 31 December 2028
- Aim for tighter bid-ask spreads, lower execution costs and stronger price discovery
- Review and expand the eligible list regularly
Chee described the target as the “middle segment” — stocks with sufficient trading activity to benefit from market-making support, but not the large, liquid STI constituents. Early signs suggest the broader reform push is working: average daily turnover in Q3 2025 rose 16% year-on-year to S$1.53 billion, the highest since Q1 2021, with IPO fundraising topping S$2 billion, according to MAS data cited by The Straits Times.
The bigger play: anchoring S$7 trillion of asset management in Singapore
Tuesday’s announcements were bookended by measures targeting Singapore’s asset management industry, which now oversees close to S$7 trillion across more than 1,300 managers — growing 7.5% annually over the past five years, per MAS’s August 2026 package:
- Investment Management Track under the ONE Pass (from late January 2027, with the Ministry of Manpower) — applicants can meet the S$30,000 qualifying salary through a minimum S$15,000 fixed monthly salary plus variable, performance-linked components, reflecting industry compensation norms. Further details are expected at Budget 2027.
- Tax exemption for profit-related returns from fund management services to qualifying funds, effective from Year of Assessment 2027.
- A new MAS Hedge Fund Investment Programme to anchor leading hedge fund managers and their ecosystems (prime brokerages, ancillary services) in Singapore.
On licensing, Chee revealed MAS has received more than 500 fund management licence applications over the past three years, with a median approval time of 4.5 months in Q2 2026 — and the fastest approved in just 12 weeks — while pledging to streamline further without lowering standards.
What happens next?
- Batch 4: MAS is reviewing proposals now and expects to announce the next group of EQDP managers in 2027 — S$1.1 billion of the programme remains unallocated.
- Budget 2027: Details of the ONE Pass Investment Management Track, tax exemption and hedge fund programme.
- Market structure reforms: The SGX-Nasdaq dual listing bridge, reduced board lot sizes and the modernised post-trade custody model round out the Review Group’s implementation agenda.
Frequently Asked Questions
Which five asset managers were appointed in the third EQDP batch?
Amundi, Franklin Templeton, HSBC Asset Management, M&G Investments and Natixis Investment Managers, sharing S$1.45 billion.
How much of the EQDP has been allocated?
S$5.4 billion of S$6.5 billion across 14 managers in three batches. A fourth batch is under review for announcement in 2027.
What is the GEMS Market Making Grant?
A S$20 million grant (until end-2028) funding market makers in roughly 80 non-STI small and mid-cap stocks to narrow spreads and improve liquidity.
Can retail investors benefit?
Indirectly — tighter spreads and better price discovery lower trading costs for everyone, and EQDP managers’ funds may include counters retail investors already own.
Discover more from The Economy
Subscribe to get the latest posts sent to your email.
Markets & Finance
Beyond Singapore’s Borders: How Squeezed SMEs Can Unlock High-Yield Growth Across ASEAN

Faced with escalating domestic overhead, acute labor bottlenecks, and an ultra-saturated local market, Singapore’s small and medium-sized enterprises (SMEs) are approaching an operational inflection point. While the city-state remains an unrivaled global financial hub, domestic cost structures are increasingly compressing profit margins for mid-market businesses. Expanding across Southeast Asia is no longer merely a growth option—it has become a necessity for enterprise resilience and long-term value creation.
The Singapore Pressure Cooker: Why Domestic Growth Has Hit a Ceiling
Singapore SMEs contend with a uniquely challenging operating environment. According to economic assessments from the Monetary Authority of Singapore, structural cost pressures—spanning commercial real estate rents, utility hikes, and rising labor expenses—continue to outpace revenue growth across several non-oil domestic sectors.
Key factors squeezing Singapore SMEs include:
- Manpower Bottlenecks: Tightening foreign worker quotas and elevated salary thresholds under the Strategic Skills Framework have made local talent recruitment highly competitive and expensive.
- Property and Rental Overhead: Commercial and industrial space costs in prime logistics and office hubs remain among the highest in Asia, squeezing operational margins for retail, manufacturing, and services alike.
- Market Saturation: With a population of roughly 6 million, the domestic addressable market limits scale, making revenue compounding difficult without international customer acquisition.
To achieve sustainable multi-year growth, forward-looking business leaders are restructuring their footprint—using Singapore as an intellectual property (IP), treasury, and management headquarters while scaling operations into neighbor economies.
The ASEAN Dividend: Demographics, Digitalization, and Supply Chain Realignment
Southeast Asia represents a vibrant economic bloc of over 680 million consumers, characterized by rapid urbanization, an expanding middle class, and high mobile technology penetration. Research published by the Asian Development Bank highlights that regional GDP growth across ASEAN continues to outpace global averages, fueled by strong domestic demand and cross-border trade integration.
                  +-------------------------------------------------------+
                  |            Singapore Corporate Head Office            |
                  |     (IP, Treasury, Governance, R&D, Tech Core)        |
                  +-------------------------------------------------------+
                                              |
      +-----------------------+---------------+---------------+-----------------------+
      |                       |                               |                       |
      v                       v                               v                       v
+-----------+           +-----------+                   +-----------+           +-----------+
|  Vietnam  |           | Indonesia |                   | Malaysia  |           | Thailand  |
| (Mfg/Tech)|           | (Consumer)|                   | (Logistics|           | (Industrial|
|           |           |           |                   | & Services|           | & Auto Ops|
+-----------+           +-----------+                   +-----------+           +-----------+
Three macro drivers make ASEAN the primary expansion target for Singaporean firms:
- Supply Chain Diversification (“China+1”): Global multinationals and regional enterprises are diversifying manufacturing hubs toward Southeast Asia to enhance supply chain resilience, boosting local business ecosystems.
- Accelerated Digital Transformation: Digital economy report insights from McKinsey & Company reveal that regional cross-border e-commerce, fintech adoption, and digital services are projected to triple in market value by 2030.
- Regional Trade Integration: Agreements such as the Regional Comprehensive Economic Partnership (RCEP) and ASEAN Free Trade Area (AFTA) reduce trade barriers, lower tariffs, and simplify cross-border logistics.
Comparative Expansion Matrix for Target ASEAN Markets
Selecting the right expansion destination depends on sector alignment, talent requirements, and cost structures. The following framework maps core opportunities for Singapore SMEs across major ASEAN growth markets:
| Expansion Market | Primary Growth Drivers | Strategic Cost Advantage | High-Potential Sectors | Market Entry Complexity |
| Vietnam | Rapid industrialization, tech talent pool, strong export orientation | Low manufacturing and engineering labor costs | Precision engineering, electronics, software development | Moderate (Requires navigating local regulatory channels) |
| Indonesia | Massive domestic market (275M+ population), rising consumer class | High consumer volume potential, lower operational costs | B2C e-commerce, consumer tech, logistics, agritech | Moderate to High (Complex licensing & local partner rules) |
| Malaysia | Proximity to Singapore, shared talent language, integrated supply chains | Lower land and talent costs with minimal cultural friction | Cross-border logistics, professional services, food manufacturing | Low (High synergy with SG business models) |
| Thailand | Strong industrial base, advanced infrastructure, EV ecosystem | Cost-effective industrial facilities and skilled labor | Advanced manufacturing, automotive supply, healthcare, tourism tech | Moderate (Language barriers require local executive talent) |
A 4-Step Actionable Roadmap for Overseas Regionalization
Expanding across borders requires structured execution to avoid capital misallocation. Enterprise leaders can adopt this four-phase framework to mitigate market entry risks:
- Leverage Institutional Support and Co-FundingBefore committing capital, utilize government-backed regionalization initiatives. Programs administered by Enterprise Singapore—such as the Market Readiness Assistance (MRA) grant and the Enterprise Development Grant (EDG)—provide co-funding for market studies, legal set-up, and overseas business matching.
- Adopt a “Hub-and-Spoke” Operational ModelMaintain high-value activities (financing, IP management, advanced R&D, regional leadership) in Singapore to preserve institutional trust and regulatory clarity. Establish operational “spokes” in target ASEAN countries to handle high-volume manufacturing, customer support, and local marketing.
- Form Local Joint Ventures and Strategic AlliancesDirect market entry can carry regulatory hurdles and cultural blind spots. Partnering with established in-market distributors or joint-venture partners accelerates distribution access and ensures regulatory compliance.
- Capitalize on Cross-Border Digital InteroperabilityWith initiatives backed by the ASEAN Secretariat to build unified cross-border payment rails (such as real-time QR payment linkages between Singapore, Malaysia, Thailand, and Indonesia), businesses can handle cross-border payments with reduced friction and lower FX transaction costs.
Mitigating Risk: Structural Protocols for Cross-Border Success
While the growth prospects are significant, cross-border expansion presents operational challenges. SME leadership must address key risk categories:
- Regulatory and Foreign Ownership Restrictions: Certain jurisdictions enforce foreign ownership caps in specific sectors. Engaging qualified legal counsel early ensures proper corporate structuring and compliance with local equity mandates.
- Foreign Exchange Exposure: Currency volatility across emerging ASEAN markets can erode operating profits. Implementing formal hedging policies through treasury banking partners mitigates FX exposure.
- Taxation Structuring: Companies must optimize transfer pricing and leverage bilateral Avoidance of Double Taxation Agreements (DTAs) signed between Singapore and ASEAN member states to avoid overlapping tax obligations.
SMEs that treat regional expansion as a strategic imperative rather than a reactive survival tactic can leverage Singapore’s regional anchor status to capture long-term market share across Southeast Asia.
Discover more from The Economy
Subscribe to get the latest posts sent to your email.

Bank of Japan Hikes Benchmark Rate to 1.25%: Unwinding the Global Yen Carry Trade

Gold Falls 3.7% as Yields Surge: Is Gold Still a Safe Haven in 2026?

US 10-Year Yield Hits 5.24%: What the Historic Bond Market Sell off Means for Mortgages and Investors

Battle for the Farm Belt: How Tariff Pressures and Fuel Costs Are Reshaping Iowa’s 2026 Midterms

Southeast Asia’s Critical Minerals Power Play: Can ASEAN Avoid Choosing Between China and the US?

MAS Allocates S$1.45 Billion to Five Asset Managers in Third EQDP Batch: Total Deployment Reaches S$5.4 Billion

Beyond Singapore’s Borders: How Squeezed SMEs Can Unlock High-Yield Growth Across ASEAN

Bank Jago’s Wealth Management Push:Indonesia’s 31.1 Million Investors boom

Beyond the Four-Year Degree: The $100K+ Trade Careers Young Americans Are Overlooking

SpaceX Starship Achieves First Full Orbit on Historic 10-Hour Test Flight 14

Google’s $15B Finland AI Investment: Data Centers, Nuclear Power & Jobs

Fast Invoice Factoring: Rates, APR Math & Contract Traps

SOC 2 Type II Guide: Cost, Timeline & Compliance Companies

Hong Kong Wages Surge 3.4% in June: Sector Data & Analysis

Top 30 Stocks for Investment in PSX for Massive ROI in 2026

Oil Prices Break $100 in 2026: Middle East Conflict & Energy Markets

BRICS+ Cross-Border Payments 2026: Interoperability Explained

Fidelity Investments Review 2026: SPAXX Yields & Zero-Fee Funds

10-Year Treasury Yield Hits 4.80%: What It Means for Rates & Portfolios

IMF & World Bank 2026 Global Economic Outlook: Growth, Inflation, Debt

Shein Clothes Quality & Safety in 2026: What Lab Tests Show

China’s US$10.8 Billion Trade Shortcut: Why the Pinglu Canal Matters

High-CPM Finance Niches 2026: Publisher Monetization Blueprint

Middle East War Economics 2026: Oil Prices & Energy Markets

China Stocks Today: Are Big Economies in Asia Nearing a Market Bottom?

Global Pension Systems Ranked: The World’s Best and Worst Retirement Frameworks

Social Security Trust Fund 2032: OASI Depletion Timeline Explained

Enterprise AI Platforms Disrupting B2B SaaS in 2026: Full Analysis
-

 Markets & Finance9 months ago
Top 15 Stocks for Investment in 2026 in PSX: Your Complete Guide to Pakistan’s Best Investment Opportunities
-

 Analysis7 months ago
Johor’s Investment Boom: The Hidden Costs Behind Malaysia’s Most Ambitious Economic Surge
-

 Analysis7 months ago
Top 10 Stocks for Investment in PSX for Quick Returns in 2026
-

 Banks9 months ago
Best Investments in Pakistan 2026: Top 10 Low-Price Shares and Long-Term Picks for the PSX
-

 Analysis8 months ago
Brazil’s Rare Earth Race: US, EU, and China Compete for Critical Minerals as Tensions Rise
-

 Investment9 months ago
Top 10 Mutual Fund Managers in Pakistan for Investment in 2026: A Comprehensive Guide for Optimal Returns
-

 Global Economy9 months ago
15 Most Lucrative Sectors for Investment in Pakistan: A 2025 Data-Driven Analysis
-

 Global Economy9 months ago
Pakistan’s Export Goldmine: 10 Game-Changing Markets Where Pakistani Businesses Are Winning Big in 2025