
Opinion
OPINION:Breaking the 3.5% Growth Trap: How Pakistan Can Build a High-Productivity Export Economy

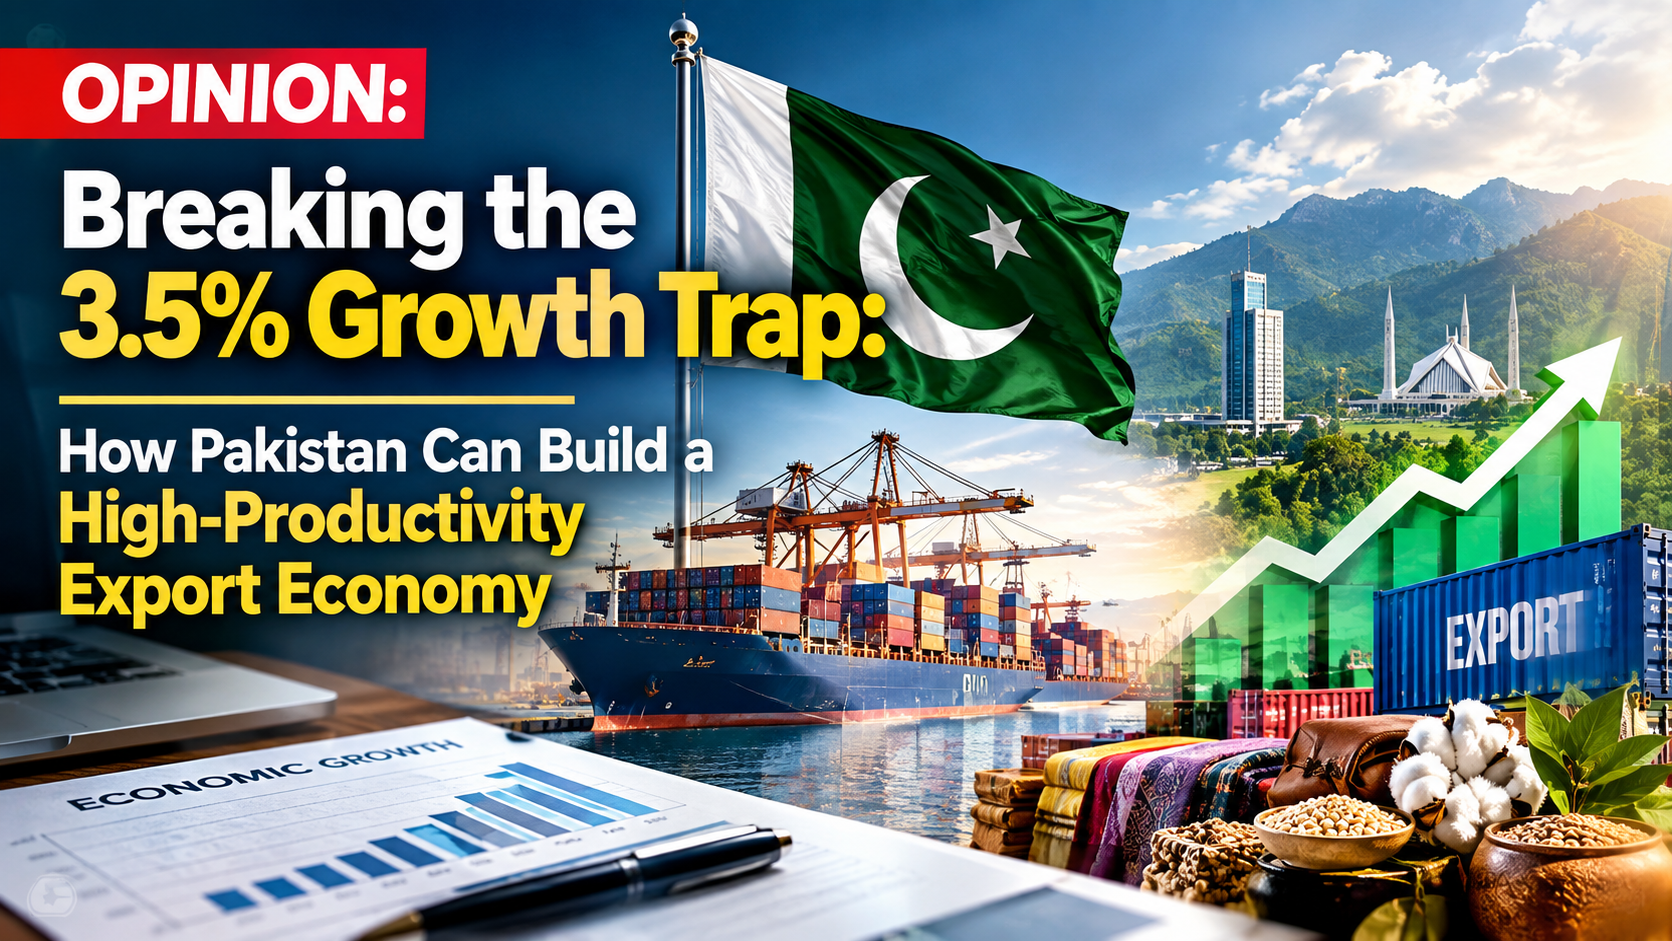
Over the last two centuries, global economic transformations have repeatedly demonstrated that escaping poverty requires moving labor from low-productivity agriculture to high-value industrial and technological sectors. While Western nations achieved this transition over centuries, East Asian economies—Japan, South Korea, Taiwan, and China—compressed the process into a few decades by sustaining growth rates near or above 8% per year.
Pakistan remains caught in a boom-and-bust stabilization cycle. While short-term fiscal adjustments under international programs stabilize reserves, real GDP growth continues to hover around 3.5%—a rate barely sufficient to match population growth and capital depreciation. Escaping this trap requires addressing the fundamental structural bottlenecks that constrain national productivity.
1. The Growth Divergence: Boom-and-Bust vs. Export-Led Industrialization
Pakistan’s growth model historically relies on domestic consumption driven by foreign remittances, debt-financed public spending, and import surges. Whenever domestic growth approaches 5%, import demand exhausts foreign exchange reserves, forcing monetary tightening, currency devaluation, and emergency fiscal consolidation.
In contrast, East Asian developmental models aligned domestic credit and state support directly with export discipline:
- State-Directed Capital Allocation: South Korea and Japan provided cheap credit, tax concessions, and infrastructure support exclusively to firms that achieved strict international export targets.
- Protection Tied to Performance: Domestic industrial protection was temporary and conditional on gaining global market share, preventing permanent reliance on state subsidies.
- High Savings and Investment: East Asian economies consistently maintained gross fixed capital formation above 30% of GDP, whereas Pakistan’s investment-to-GDP ratio routinely hovers below 15%.
2. The Three Structural Bottlenecks Holding Back Growth
I. The Economic Complexity Deficit
According to data from the Harvard Growth Lab’s Atlas of Economic Complexity, Pakistan ranks 89th globally in economic complexity. Its export basket remains concentrated in low-complexity goods—primarily basic textiles and raw agricultural commodities—which face volatile global prices and low income elasticity. Without expanding into medium- and high-tech manufacturing (such as electronics, auto components, and specialty chemicals), export revenues cannot cover the capital goods imports needed for sustained growth.
                     PAKISTAN'S STRUCTURAL GROWTH BARRIER

   +-------------------------------------------------------------------+
   |                 Low Industrial & Export Complexity                |
   |              (Textiles & Agriculture Dominate ~70%)               |
   +---------------------------------+---------------------------------+
                                     |
                                     v
   +-------------------------------------------------------------------+
   |                 Rapid Consumption-Driven Growth                   |
   |                     (Reaches ~4.5% - 5.0% GDP)                    |
   +---------------------------------+---------------------------------+
                                     |
                                     v
   +-------------------------------------------------------------------+
   |               Import Surge & Trade Deficit Spikes                 |
   |             (Foreign Exchange Reserves Depleted)                  |
   +---------------------------------+---------------------------------+
                                     |
                                     v
   +-------------------------------------------------------------------+
   |              Stabilization & Demand Contraction                  |
   |           (Higher Rates, Import Restrictions, Slow Growth)        |
   +-------------------------------------------------------------------+
II. Fiscal Crowding-Out and Energy Sector Inefficiencies
Data from the State Bank of Pakistan shows that public sector borrowing consumes the vast majority of commercial bank credit. This debt crowding-out deprives private enterprises of affordable long-term capital for industrial upgrades. Furthermore, structural power tariffs—driven by unaddressed circular debt, capacity payments, and transmission losses—render local manufacturers uncompetitive against regional peers in Vietnam, Bangladesh, and India.
“Escaping the 3.5% growth trap requires shifting resources from rent-seeking sectors into productive, export-oriented manufacturing.”
III. Human Capital & Agricultural Productivity Deficits
Recent economic analyses published in the World Bank Pakistan Development Update emphasize that low agricultural yield per hectare keeps a large share of the labor force tied to low-productivity farming. Stagnant agricultural yields limit raw material supply for processing industries and force the country to import essential food commodities during demand spikes.
3. A Four-Pillar Framework for Sustainable 7%+ Growth
To move beyond perpetual debt-fueled stabilization and achieve sustained double-digit growth, economic policy must focus on four structural imperatives:
| Reform Pillar | Strategic Action | Targeted Outcome |
| 1. Export Diversification | Transition subsidies from low-value textiles to high-complexity sectors (engineering, IT, specialty chemicals). Tie tax incentives to global market share gains. | Higher export complexity and reduced trade deficits. |
| 2. Energy & Fiscal Restructuring | Privatize mismanaged power distribution companies (DISCOs), eliminate cross-subsidies, and broaden the direct tax base to broaden credit for the private sector. | Lower industrial energy costs and increased private sector credit. |
| 3. Agricultural Modernization | Adopt high-yield seed technologies, corporate farming frameworks, and efficient drip irrigation systems to boost yield per acre. | Higher farm incomes, food security, and agricultural export surpluses. |
| 4. Institutional & Investment Reform | Create long-term policy predictability through legislative guarantees for foreign and domestic direct investment, structured via international standards like the International Monetary Fund (IMF) reform frameworks. | Increased Foreign Direct Investment (FDI) and gross capital formation. |
The Path Forward
Macroeconomic stabilization is a necessary condition for survival, but it is not a growth strategy. Without shifting resources from rent-seeking sectors into productive, export-oriented manufacturing, Pakistan will remain caught in its historical boom-and-bust cycle. Sustained, inclusive growth requires aligning state policy with market-driven export incentives, reforming the energy and tax structures, and modernizing the country’s economic foundation.
Discover more from The Economy
Subscribe to get the latest posts sent to your email.


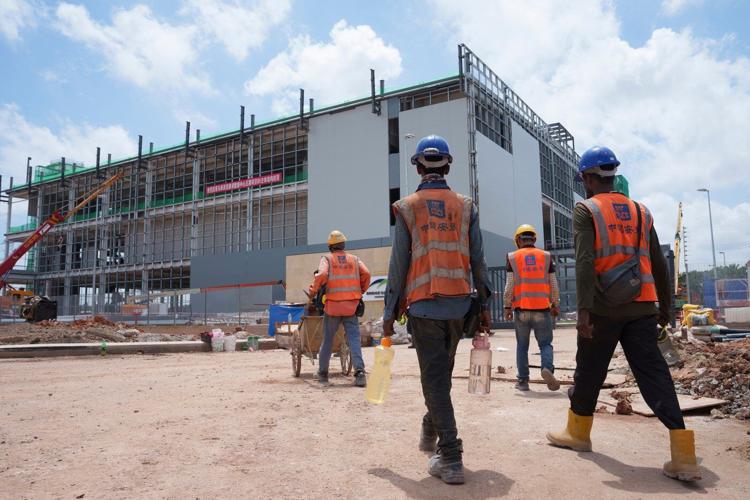
As Silicon Valley’s artificial intelligence boom triggers a global power strain, Southeast Asia’s new energy masterplan offers a pragmatic blueprint: integrating nuclear reactors with cross-border grids to sustain the digital future.
Across the tech corridors of Johor, Singapore, and West Java, massive server farms are quietly transforming Southeast Asia into the engine room of the global artificial intelligence economy. Every algorithmic query, large language model training run, and cloud computation requires staggering amounts of electricity. Yet, beneath this digital gold rush lies a uncomfortable physical reality: the region’s power grids are reaching their threshold, caught in a high-stakes collision between soaring energy demand and urgent net-zero climate imperatives.
For years, policy circles framed the energy transition as a binary choice between expanding weather-dependent solar and wind arrays or continuing a hazardous reliance on coal and natural gas. But the sheer scale of the AI boom has shattered this false dichotomy. Hyper-scale data centres require uninterrupted 24/7 baseload power—a standard that intermittency-prone renewables alone cannot guarantee without prohibitively expensive battery storage. To solve this dilemma, Southeast Asia is embarking on a bold pivot: embracing nuclear power as a foundational pillar of its upcoming regional energy architecture.
| “Small Modular Reactors represent a paradigm shift: providing clean, continuous baseload power directly adjacent to digital infrastructure clusters without straining fragile municipal grids.” |
The Shift Toward Small Modular Reactors
Unlike the gigawatt-scale conventional atomic plants of the twentieth century, which suffered from notorious construction delays and massive capital requirements, modern nuclear strategy centers on Small Modular Reactors (SMRs). Producing between 50 and 300 megawatts per unit, SMRs offer factory-fabricated scalability, advanced passive safety mechanisms, and a footprint compact enough to sit alongside industrial parks or sub-grid data hubs.
Across the Association of Southeast Asian Nations (ASEAN), member states are already establishing tactical readiness pathways:
- Vietnam: Re-engaging international vendor partnerships and updating its nuclear regulatory policy under International Atomic Energy Agency (IAEA) guidance to supply high-density manufacturing and processing corridors.
- Indonesia: Targeting early SMR deployments across its vast archipelago, offering off-grid clean electricity to power remote technological and industrial nodes outside Java.
- Malaysia: Reviving its Nuclear Energy Program Implementation Organization to support rapid data centre expansion in Johor and the Klang Valley while keeping power tariffs competitive.
- Singapore: Conducting rigorous feasibility studies into next-generation nuclear tech, paving the way for low-carbon energy imports through cross-border trade agreements.
Cross-Border Integration & Global Implications
The true strategic force multiplier lies in integrating nuclear energy into the multilateral ASEAN Power Grid (APG). By allowing nuclear-generated electricity to flow across borders alongside hydro and solar power, Southeast Asia can achieve grid resiliency that individual countries could never build alone. During dry seasons when hydroelectric output wanes, continuous nuclear generation keeps cross-border interconnectors energized and data centres operational.
For international policymakers in Washington and European capitals, Southeast Asia’s nuclear transition carries profound geopolitical implications. Western reactor developers must engage proactively with financing frameworks and regulatory assistance; failing to do so risks ceding civil nuclear leadership in the Indo-Pacific to state-backed entities from rival powers.
A Pragmatic Path Forward
Navigating this nuclear dawn will not be without hurdles. Updating legal safety frameworks, securing public trust, and unlocking private capital will require sustained international coordination. However, the economic incentive could not be clearer. In an era where computational power dictates national competitiveness, securing clean, reliable, and scalable energy is no longer just an environmental goal—it is a core national security imperative.
By aligning its digital ambition with atomic innovation under the new ASEAN Energy Masterplan, Southeast Asia is offering a valuable lesson to the world: the AI revolution does not have to compromise our climate targets—provided we have the courage to power it smartly.
Discover more from The Economy
Subscribe to get the latest posts sent to your email.

For decades, the global dominance of the U.S. dollar has rested on two primary pillars: deep, unencumbered liquid capital markets and an indispensable global financial messaging protocol known as SWIFT. When Beijing launched its e-CNY initiative, Western observers initially framed it as a central bank digital currency (CBDC) designed primarily for domestic surveillance, retail convenience, and financial inclusion.
However, recent strategic moves highlight a far more ambitious objective. As documented by the South China Morning Post, Beijing is actively leveraging Hong Kong as its central offshore laboratory to establish the infrastructure required for international cross-border digital yuan adoption.
The crucial strategic question is no longer whether China can engineer robust distributed ledger architecture, but whether an offshore financial hub operating under “One Country, Two Systems” can bridge the gap between rigid domestic capital controls and global institutional acceptance. To succeed, China must resolve the fundamental tension between absolute monetary sovereignty and the open networks required for international currency adoption.
1. The Paradox of the Offshore Laboratory
China’s monetary expansion faces a well-documented structural paradox. According to macroeconomic research from the Carnegie Endowment for International Peace, no currency can achieve true international reserve status without offering open capital accounts and deep, freely convertible liquidity. Yet, completely relaxing capital controls would expose China’s domestic banking system to volatile international capital flows and speculative pressures.
Hong Kong serves as the pressure valve and testing ground for this paradox:
- Legal & Regulatory Buffer: Hong Kong maintains a trusted common law judicial system and an independent monetary authority (Hong Kong Monetary Authority).
- Convertibility Bridge: It allows mainland authorities to test e-CNY settlement, cross-border retail links, and digital asset integration without opening mainland financial markets directly to global speculative shocks.
- Institutional Liquidity: As the world’s premier offshore renminbi hub, Hong Kong provides the institutional counterparties necessary to build real-world transaction volume.
“The digital yuan’s true test lies not in domestic retail adoption, but in whether foreign counterparties can settle cross-border trade without taking on unacceptable regulatory or capital risks.”
2. Wholesale Settlement and Project mBridge
While retail consumer wallets attract considerable media attention, the real geopolitical shift is occurring at the wholesale institutional level. Strategic initiatives like Project mBridge—developed in partnership with the Bank for International Settlements (BIS), the People’s Bank of China, and regional central banks—demonstrate how multi-CBDC platforms can streamline international trade.
As reported in market analyses by Bloomberg and trade finance studies covered by Reuters, multi-lateral CBDC platforms offer significant operational advantages:
- Elimination of Intermediaries: Direct ledger-to-ledger transactions bypass traditional correspondent banking networks.
- Speed and Efficiency: Cross-border settlement times are reduced from days to seconds.
- Cost Reduction: Transaction costs and foreign exchange spreads across regional trade corridors in Asia and the Middle East are dramatically lowered.
If commercial enterprises operating in Hong Kong can settle trade directly in e-CNY with instant finality, Beijing creates a compelling economic incentive for trade partners that operates independently of Western clearing networks.
3. Geopolitical Implications & The Road Ahead
Western policymakers and central bankers are monitoring these developments closely. Recent congressional testimony and Treasury reviews highlighted by Reuters reflect growing concern in Washington that alternative settlement rails could gradually erode the reach and enforcement of Western financial sanctions.
However, technological capability alone does not guarantee global currency dominance. Until foreign corporate treasuries and central banks have full confidence in converted currency liquidity, property rights, and transparent legal protections, the digital yuan will serve primarily as an efficient alternative mechanism for bilateral trade rather than an immediate replacement for the U.S. dollar.
Institutional Summary & Comparison
| Dimension | Conventional Retail Focus | Wholesale / Strategic Reality |
| Primary Mechanism | Retail e-CNY wallets for tourists & merchants | Multi-CBDC corridors (Project mBridge) & Project Ensemble |
| Core Objective | Domestic payments & payment app competition | Disintermediation of correspondent banking and SWIFT rails |
| Primary Barrier | Consumer habituation & merchant readiness | Capital controls, currency convertibility, and institutional trust |
Sources & Citations
- South China Morning Post: Beijing wants Hong Kong to sow the seeds for the digital yuan
- Bank for International Settlements (BIS): Central Bank Digital Currency (CBDC) & Cross-Border Payments Research
- Carnegie Endowment for International Peace: China’s Financial System and Capital Account Dynamics
- Bloomberg Financial Analysis: Global Macro & Digital Currency Integration
- Reuters News & Analysis: Cross-Border Settlement and Global Trade Finance
Discover more from The Economy
Subscribe to get the latest posts sent to your email.

An AI neocloud can announce billions of dollars of contracted demand and still face a dangerous financial squeeze. The business typically commits large amounts of capital to graphics processing units, networking hardware, data-center facilities, electricity and financing well before every installed GPU begins generating revenue. If customers use the capacity intensively and pay on time, the model can produce attractive operating leverage. If hardware arrives late, sits idle or loses value quickly, financial costs do not wait for demand to recover.
That tension is the central question in neocloud economics in 2026. An important real-world reference is the second-quarter report by CoreWeave, which disclosed around $104 billion in revenue backlog at June 30, 2026 and rapid expansion in infrastructure spending. A backlog provides visibility but is not cash already received, booked profit or a guarantee that hardware will be deployed on schedule. Investors should follow the money from purchase commitment through installation, utilization, billing, cash collection and debt service.
What an AI neocloud actually sells
A neocloud primarily offers accelerated compute capacity, often optimized for training and serving large AI systems. Customers can rent GPU clusters and the supporting networking, storage, software and operations needed to use them. Some agreements reserve substantial capacity over time; others are more exposed to usage or shorter contract duration. The seller is not necessarily producing proprietary AI models. Its principal economic product may be reliable access to expensive compute.
The model differs from that of the biggest diversified cloud companies. A hyperscaler can spread data-center assets over many services, customers and uses. A specialist may offer a strong technical product while being more concentrated in AI infrastructure and dependent on a smaller set of important customers. Concentration can accelerate growth when large clients sign agreements, but it can also magnify a cancellation, renegotiation or project delay.
Providers vary considerably. A modern dedicated AI cluster with high-speed interconnects is not interchangeable with a small assortment of standalone graphics cards. Training requires systems that exchange large volumes of information efficiently; inference may be optimized differently. Capacity quality, energy availability and networking topology can all affect the price customers are willing to pay.
Follow the life of a GPU, not just the booking headline
There are six economically meaningful stages. First, a neocloud signs a customer commitment or forecasts demand. Second, it orders equipment and secures data-center capacity. Third, facilities and electrical systems become ready. Fourth, GPUs are installed, tested and connected. Fifth, customers actually consume or reserve the service under their contracts. Sixth, the neocloud collects cash while continuing to pay for electricity, people, maintenance, financing and future equipment.
A problem at any handoff can destroy expected margin. A delivery delay keeps the company from billing for some capacity but may not eliminate its facility, interest or operating costs. A data-center power delay can leave valuable hardware waiting. A customer shifting workloads to a different architecture can weaken expected pricing. Even fully installed machines may be subject to planned maintenance, software deployment or other non-billable periods.
The CoreWeave Form 10-Q discusses capital investment, operating risks and business concentration. This is why a careful comparison examines realized utilization and cash-flow generation, not only contracted GPU counts or announced megawatts.
Backlog is visibility, not a bank account
CoreWeave stated that its backlog reached approximately $104 billion at the end of Q2 2026. Its official earnings release separately explained that the disclosed backlog did not include more than $25 billion in net new customer commitments added in early Q3. These figures demonstrate demand and long-term contracting, but treating them as the company’s current revenue would be incorrect.
A contracted backlog must turn into recognized revenue according to delivery and availability requirements. That conversion can span years. Contracts may have conditions, customer concentration or renegotiation and timing risks. Even when the client eventually pays in full, the neocloud might finance new equipment long before the payment is received. The timing of cash is as consequential as its contractual total.
Investors should therefore ask four questions: What share of backlog is expected to be recognized in the next twelve months? What has to be constructed or purchased before billing? How much cash will customers pay upfront or during deployment? And what remedies or flexibility exist if delivery is delayed? Not all disclosures answer each question. Where details are unavailable, valuation should not quietly assume the most favorable response.
An illustrative one-thousand-GPU unit-economics model
Consider a fictional 1,000-GPU deployment. The following assumptions are teaching tools, not a quote from an equipment supplier, a current rental tariff, CoreWeave guidance or a forecast for any listed company. Assume total installed hardware and associated capital cost of $50 million, depreciated economically over four years; a blended realized billable rate of $4.00 per GPU-hour; annualized utilization of 75%; power and site operating cost of $8 million annually; and annual financing cost of $3 million. Ignore taxes, overhead not listed and capital structure complexities for the first pass.
The 1,000 GPUs offer 8.76 million available GPU-hours per year (1,000 × 24 × 365). At 75% utilization, the billable hours are 6.57 million. Multiplied by $4, annual revenue would be $26.28 million. Annual equipment depreciation on a straight-line four-year illustrative basis is $12.5 million.
| Fictional fleet economics | Annual amount |
|---|---|
| Maximum available GPU-hours | 8.76 million |
| Billable hours at 75% utilization | 6.57 million |
| Revenue at $4 per billable hour | $26.28 million |
| Power and site costs | ($8.00 million) |
| Economic equipment depreciation | ($12.50 million) |
| Financing expense | ($3.00 million) |
| Remainder before omitted costs and tax | $2.78 million |
This remainder is not EBITDA, GAAP net income or free cash flow. EBITDA would exclude depreciation and interest; free cash flow must account for actual capital expenditures, debt payments and working capital. The example instead shows how narrow the cushion can be even when revenue looks substantial relative to hourly prices.
The model also assumes every unit has the same billable economic value, which is rarely true across product types, chip generations and contracted discounts. It omits network expansion, insurance, personnel, spare equipment, downtime penalties and refresh investment. The omissions mean actual all-in profitability could be lower under these specific assumptions, not that every neocloud necessarily earns this margin.
Utilization can change everything
Holding the $4 hourly rate and $23.5 million combined modeled annual costs constant, utilization has a powerful effect. At 50%, annual revenue would be $17.52 million, yielding an illustrative $5.98 million shortfall before other costs. At 75%, the modeled remainder is $2.78 million. At 90%, revenue would be $31.54 million, creating roughly $8.04 million before omitted expenses.
| Fictional annual utilization | Revenue | Remainder after modeled costs |
|---|---|---|
| 50% | $17.52m | −$5.98m |
| 75% | $26.28m | +$2.78m |
| 90% | $31.54m | +$8.04m |
These amounts are arithmetic scenarios, not actual reported occupancy or profitability. They also show why the definition of utilization matters. A provider may report time when equipment is committed to a customer, physical computing activity, or billable capacity; those measures can differ significantly. An enterprise paying for a reserved cluster may support revenue even when the GPUs are not running at maximum physical workload intensity. Conversely, a spot market may show intense usage with unpredictable prices.
The quality of demand matters just as much as the reported percentage. Long-term take-or-pay-style agreements can make billing more predictable, subject to exact contract terms, but may lock in pricing at levels that later look unattractive if energy or replacement costs rise. Short-term capacity can capture scarcity premiums, but it is exposed to new supply and workload migration.
Power is a financing problem as well as an engineering problem
GPU operations depend on electricity, cooling, transformers, network links and resilient facility design. Electricity consumption rises with high-power accelerators and associated equipment, but nameplate power is not identical to average billable energy draw. The data-center power usage effectiveness measure can help describe total facility electricity relative to IT equipment electricity, yet it is not a complete proxy for margin.
A company that has obtained equipment but lacks grid interconnection is not free to deploy it anywhere. Interconnection queues, substations and available generation can impose genuine bottlenecks. Local tariffs, electricity contracts and the ability to curtail load during stress affect operations. A seemingly small change in power price becomes material across large capacity blocks.
Some providers build or lease facility infrastructure, others contract through colocation partners. Both structures create obligations. Leasing may transfer certain facility construction risks but does not remove power and availability constraints. Owned infrastructure may offer more control while increasing capital needs. Investors need to distinguish megawatts reserved, megawatts ready and megawatts actively producing revenue.
Why GPU depreciation is unusually contentious
Conventional depreciation allocates equipment cost over an estimated useful life for accounting purposes. Economic obsolescence is different. Accelerators may remain physically operational for years while newer products deliver more compute per watt, improved networking or a lower cost per unit of useful AI work. If customers shift workloads toward newer equipment, an older cluster may require a price discount before its accounting book value has fully depreciated.
The correct useful life depends on technology, workloads, customer demand and resale markets; no universal answer applies to every GPU model. It is therefore dangerous to compare companies solely on adjusted EBITDA, which adds back depreciation. A cash-intensive operator can report high adjusted EBITDA while continuously reinvesting heavily to refresh an increasingly competitive fleet.
An analyst can test a four-year depreciation estimate against more pessimistic three-year replacement economics or a longer six-year life. A three-year model increases annual cost on $50 million of assets from $12.5 million to about $16.7 million, reducing the hypothetical annual remainder by about $4.2 million if all other assumptions remain fixed. That sensitivity is large relative to the model’s $2.78 million cushion at 75% utilization. The point is not that three years must be correct; it is that technology-life assumptions can overwhelm a valuation.
Leverage changes the payoff profile
Infrastructure companies can finance equipment and facilities through secured loans, leasing, convertible notes, equity issuance and customer-backed arrangements. Debt can accelerate expansion while contracts appear attractive, but fixed interest and principal obligations become painful if operating cash arrives late. It also matters whether collateral can be resold easily or whether lenders may require more security when market conditions deteriorate.
CoreWeave’s 2026 SEC filing gives investors original details to analyze, including material debt, contractual obligations and risks. Its scale and financing profile should not be applied automatically to every smaller GPU provider. Some firms may be much less leveraged, while others could be more reliant on a small number of funders or customers.
Excess leverage has a second-order effect: creditors, not only shareholders, can gain influence over capital allocation. A provider might be forced to preserve liquidity, slow a profitable expansion or issue equity at an unfavorable price. In a stress case, a customer could remain willing to rent GPUs while the balance sheet still prevents a company from funding their installation.
Customer concentration is a double-edged sword
Signing a multi-year agreement with a large AI laboratory or hyperscaler can validate a neocloud’s technology and support financing. It can also make financial results heavily dependent on a few customers’ investment priorities. A large client might develop its own capacity, diversify among suppliers, negotiate discounts or modify workloads as new hardware generations arrive.
Revenue recognition can be especially lumpy when a cluster becomes available after a long construction period. A growing backlog may therefore coexist with periods of compressed margins, particularly when multiple facilities ramp at the same time. Compare the company’s actual cash receipts and working-capital movements over several quarters instead of treating a single record backlog figure as evidence that these transitions are riskless.
A helpful due-diligence question is whether new customers broaden the revenue base faster than the largest existing customers increase their spending. Expansion from giant buyers can be profitable, but a diversification claim deserves measurable evidence. Customer anonymity may limit public assessment; in that case the unanswered concentration risk should be acknowledged.
Pricing power can disappear even while AI demand rises
AI demand is not a single market. An older GPU may be suitable for some inference tasks but unattractive for the most demanding model training. Dedicated high-speed clusters can command different prices from loosely connected cards. Prices depend on generation, geographic availability, service reliability, contract length and software support. The rental market may also become more competitive as hyperscalers and specialist providers bring new capacity online.
A company could see total AI compute demand rise while its revenue per older GPU-hour declines. In such a world, a high utilization rate might not rescue the original projected economics. The relevant metric is revenue per unit of total invested capital over the equipment’s actual useful life, after operating and financing costs—not merely GPU-hours sold.
Conversely, a specialized operator may create a premium by offering fast cluster deployment, predictable performance and support for demanding workloads. Those service attributes can distinguish a neocloud from a commodity equipment rental. The advantage must eventually appear in pricing, customer retention or lower operating cost, not just in marketing claims about purpose-built infrastructure.
A framework for comparing public and private providers
A serious assessment should start with contracted revenue, the timing of its recognition, and how much additional capital is necessary to fulfill it. Next come realized pricing and the company’s definition of utilization. The third layer is capital structure: gross debt, interest expense, maturity timing, restricted cash and the ability to finance additional capacity. The fourth is technical: hardware age, network speed, failure rates and the energy economics of facilities. Finally, assess who is buying the capacity and whether their commitments are diversified.
One useful ratio is capital expenditure divided by revenue, though its interpretation varies substantially between a company in initial construction and a mature operator. Another is operating cash flow versus capital expenditure over several years. Neither should be used without explaining leases and financing flows. Growth may justify spending ahead of demand, but investors must establish when cash conversion is expected.
For a startup without SEC filings, diligence is harder. Ask management for cohort utilization, contract coverage by calendar year, true all-in power costs and a capex schedule that includes networking and facilities. If those numbers are unavailable, higher uncertainty is the appropriate conclusion. Assumed precision does not become trustworthy just because it is presented in a spreadsheet.
Questions readers ask
Are AI neoclouds profitable?
Some operations can generate positive economics, but profitability differs by provider, contract structure, equipment cost, power cost and accounting treatment. High revenue growth or adjusted EBITDA is not proof of positive free cash flow. Review audited statements and reconciliations for any specific company.
Is a $100 billion backlog the same as $100 billion in sales?
No. Backlog represents expected future revenue under contractual arrangements and defined assumptions. Recognition and collection occur over time and require delivery. CoreWeave’s cited approximately $104 billion backlog was a company-specific measure as of June 30, 2026, not an industry total or already-collected cash.
What is the biggest risk: electricity or GPU prices?
Both can be significant, but the dominant risk varies. A power-constrained build may fail before it bills a single hour; a fully operating fleet may suffer when rental prices decline or customers favor newer hardware. Debt obligations can amplify either problem.
The central investment question
Neoclouds can be valuable infrastructure providers in an expanding market, but they are not passive beneficiaries of AI enthusiasm. Their returns depend on connecting expensive capital assets to paying workloads quickly, keeping those assets relevant, and surviving the financing gap between construction and cash collection. A disciplined investor should be able to describe how backlog becomes billable capacity, and how billable capacity becomes free cash after debt and replacement equipment. Everything else is an incomplete growth story.
Discover more from The Economy
Subscribe to get the latest posts sent to your email.

China’s 175 Trillion AI Tokens Reveal a Bigger Shift: The AI Boom

The Philippines’ Stagflation Trap: Higher Interest Rates

Alphabet’s $500 Billion Reckoning: Wall Street Is Losing Patience With the AI Boom

4 Reasons Why China’s Trade Concessions to Europe Will Not Solve the Crisis

The AI Revolution Needs Atomic Power. Southeast Asia Is Ready to Build It.

Zhuhai Airshow 2026: How China’s Stealth Jets, Drones and Missiles Are Redrawing Global Air Power

The $8 Billion Runway: China’s Strategic Bet on Guangzhou and the Future of Aviation

The Sandbox Imperium: Why Beijing’s Digital Yuan Needs Hong Kong

Gold at the $4,000 Line: Possible December Fed Hike

Oil at $100+: Hormuz, a Qatari Peace Draft and the Iran Deadline

The Fed’s 10-2 Hold: Why Two Dissenters Wanted a Rate Hike

SBP Raises Policy Rate to 12%: What It Means for Your Loans, Savings and Business

IMF’s $1.2bn Staff-Level Deal: What Pakistan Promised on Surplus

Decoding the DBS–BCA Merger Rumour: Market Volatility, Strategic Realities

Crude Oil & Petroleum Market Analysis: OPEC+ Decisions and Price Forecasts

Top US Convenience Store Chains: Store Counts, EV Charging, and Sales Trends

Social Security Extra $90 Deposit: Who Qualifies for the October 2026 Medicare Rebate?

Who Is Shivon Zilis? The Neuralink Executive at the Center of the Musk–OpenAI Trial

Gold Price Outlook 2026: The Forces Behind the Forecasts—and What Could Reverse Them

Algorithmic Dogfights: Why the U.S. and China Must Establish Rules of Engagement for Autonomous Air Power

Corporate America Faces a New Debt Test as US Borrowing Costs Surge

Global Economic Outlook 2026: 7 Forces Reshaping Markets, Trade and Business

Stock Market Crash in 2026? Warning Signs, Scenarios and a Calm Investor Checklist

Stock Market Today: Dow, S&P 500, and Nasdaq Retreat as Treasury Yields

Anthropic Bans Sustained Abuse of Claude AI Under New Usage Policy Effective November 12, 2026

US–Iran Conflict in October 2026: Hormuz, Oil Prices and Diplomacy

Geopolitics and Your Portfolio: How International Affairs Move Global Markets

Why Did I Get $90 From Social Security? 8 Reasons Behind an Unexpected SSA Payment
-

 Markets & Finance10 months ago
Top 15 Stocks for Investment in 2026 in PSX: Your Complete Guide to Pakistan’s Best Investment Opportunities
-

 Analysis8 months ago
Johor’s Investment Boom: The Hidden Costs Behind Malaysia’s Most Ambitious Economic Surge
-

 Analysis9 months ago
Top 10 Stocks for Investment in PSX for Quick Returns in 2026
-

 Banks10 months ago
Best Investments in Pakistan 2026: Top 10 Low-Price Shares and Long-Term Picks for the PSX
-

 Analysis9 months ago
Brazil’s Rare Earth Race: US, EU, and China Compete for Critical Minerals as Tensions Rise
-

 Investment10 months ago
Top 10 Mutual Fund Managers in Pakistan for Investment in 2026: A Comprehensive Guide for Optimal Returns
-

 Global Economy10 months ago
15 Most Lucrative Sectors for Investment in Pakistan: A 2025 Data-Driven Analysis
-

 Global Economy10 months ago
Pakistan’s Export Goldmine: 10 Game-Changing Markets Where Pakistani Businesses Are Winning Big in 2025