
Oil Markets
Crude Oil & Petroleum Market Analysis: OPEC+ Decisions and Price Forecasts


OPEC+ has paused output increases for a second month as Hormuz disruptions limit supply. Here’s how Brent forecasts have moved, what drives prices, and what to watch.
Key Takeaways
- OPEC+’s seven core members kept output unchanged for November 2026 at a combined 31.01 million barrels per day, after pausing in October. The group’s next meeting is November 1.
- OPEC+ decisions matter less than usual right now. Disruptions through the Strait of Hormuz, not quota levels, set the physical supply, and OPEC+ output is running below target.
- Brent averaged about $114 a barrel in September 2026, according to EIA’s October outlook. It traded at $100.53 on October 6.
- EIA raised its Q4 2026 Brent forecast to $105 a barrel in its October outlook, but still expects prices to fall from early October levels.
- Forecasts have been revised upward repeatedly since the conflict began in late February. Treat any single forecast as a snapshot, not a settled view.
Search Intent Summary
Readers searching for crude oil analysis want to know where prices are going and why. This article covers the latest OPEC+ decision, how EIA’s forecasts have moved, and the supply risks that dominate the outlook.
How the Shock Unfolded
Brent averaged about $71 a barrel on February 27, 2026, just before military action in the Middle East began on February 28. By March 9, it had climbed to $94, as the Strait of Hormuz was effectively closed to most shipping. The Energy Information Administration (EIA) reported that insurance cancellations and the threat of attacks led most tankers to avoid the strait.
Prices peaked in April. EIA’s June outlook showed Brent averaging $85 in June, $32 a barrel below the April peak. That implies an April average near $117, a figure derived from EIA’s own numbers.
A June 18 memorandum of understanding between the United States and Iran eased the pressure. Shipping through the strait recovered, and in July, EIA forecast that Brent would average $74 in the third quarter. That relief did not last. Fighting resumed in August, and Brent rose more than 30% from its early-August low by mid-September.
The OPEC+ Position
The seven core OPEC+ members are Saudi Arabia, Russia, Iraq, Kuwait, Kazakhstan, Algeria, and Oman. They had been raising output monthly from April through September 2026, as part of a phased rollback of 1.65 million barrels per day in voluntary cuts first announced in 2023. That rollback was completed in August.
Since then, the group has paused. On September 6, it kept October output unchanged. On October 4, it kept November output unchanged at a combined 31.01 million barrels per day, excluding compensation volumes. Saudi Arabia’s target is 10.478 million barrels per day, Russia’s is 9.949 million, and Iraq’s is about 4.4 million. The group reaffirmed its commitment to compliance with the Declaration of Cooperation, and its next meeting is November 1.
Quotas do not equal output. Analysts have noted that OPEC+ has limited influence over the physical market, since exports through Hormuz are constrained. Output has stayed below target because of those disruptions and constraints on Russian oil flows. Rystad Energy’s Jorge Leon described OPEC+’s power over the physical oil market as very limited while the conflict continues.
The group also faces a longer decision. Its broader production cuts run through the end of 2026, and members must review production capacity to set 2027 baselines. Sources told Reuters that OPEC+ was likely to pause increases in the fourth quarter, though the group has not confirmed that.
What the Forecasts Show
EIA’s Short-Term Energy Outlook is the most-watched public forecast in this market. Its Brent forecasts for 2026 have moved repeatedly as the conflict developed.
| EIA Outlook | 2026 Brent Forecast | 2027 Brent Forecast | Key Assumption |
|---|---|---|---|
| March 2026 | $78.84 | $64.67 | Hormuz disruption expected to be temporary |
| April 2026 | $96 | $76 | Conflict assumed to end by April |
| July 2026 | $82 | $65 | Strait reopens after June memorandum |
| August 2026 | $87 | $69 | Hormuz constraints persist through August |
| September 2026 | $91.01 | $73.74 | Gradual improvement in Hormuz flows |
| October 2026 | Q4 2026 at $105 | Not retrieved | Restrictions on flows persist into Q4 |
The pattern is clear. Each forecast assumed the disruption would ease sooner than it did, and each one was revised up. The October outlook raised its fourth-quarter estimate by $14 a barrel from September, and it expects oil flows from the Middle East to remain restricted through the quarter.
EIA also expects prices to decline from early October levels over time. Its longer-term view has Brent falling toward the $70s in 2027, but that path depends on flows through Hormuz returning to normal.
Supply and Demand
On the supply side, the disruption is large. The International Energy Agency’s August forecast, as cited by market analysts, projected global supply falling by about 4.3 million barrels per day in 2026, or roughly 4%. EIA’s September outlook, meanwhile, expected Middle East production to rise as flows gradually increased and alternative export routes were used.
Alternative routes matter. Saudi Arabia has rerouted some crude through its East-West pipeline to the Red Sea port of Yanbu. That reduces but does not eliminate the Hormuz constraint, and it puts pressure on the Bab al-Mandab Strait, which is now carrying much more traffic.
On the demand side, the picture is softer. OPEC lowered its forecast for 2026 world oil demand growth to 380,000 barrels per day, its fifth consecutive downward revision. High prices are weighing on consumption, which partly offsets the supply loss.
The US is a relative bright spot. EIA’s September outlook forecast US crude production of about 13.8 million barrels per day in 2026, rising to about 14.3 million in 2027. Higher prices encourage more domestic output, though new wells take months to add supply.
Fuel Prices Follow Crude
Retail fuel prices lag crude by weeks. AAA reported a national average of $4.41 for regular gasoline on October 1, 2026, down about 7 cents from a week earlier. September’s monthly average of $4.33 was a record for that month. EIA’s outlook projects that diesel will average $4.85 a gallon in 2026, and that tightness in distillate markets has pushed diesel prices higher than gasoline.
For consumers, the message is that fuel costs track crude with a delay. A drop in crude may not reach the pump for several weeks, and a spike can show up at the pump quickly. This matters for household budgets, for freight costs, and for inflation, which is covered in the separate global outlook article.
Scenarios for the Next Six Months
These are analytical scenarios, not forecasts.
Flows recover steadily. Hormuz traffic rebuilds, Middle East output returns toward pre-conflict levels, and Brent falls back toward the $80s or lower. This matches EIA’s broad expectation that production returns to near pre-conflict levels by early 2027.
Disruption persists. Attacks on tankers and infrastructure continue, flows stay restricted, and Brent holds near or above $100. EIA’s October outlook already assumes restrictions through the fourth quarter, which makes this scenario close to the agency’s current view.
Escalation. A major new attack on energy infrastructure or a prolonged closure of alternative routes pushes prices well above recent levels. This scenario has the greatest uncertainty, and EIA warns that flow volatility will produce short-term price swings beyond its central forecast.
Practical Strategy: What to Watch
For energy-sensitive businesses, the priority is hedging and inventory planning, since price swings have been large and fast. For households, fuel budgets should assume prices stay elevated for months rather than days.
For investors, the key indicators are weekly tanker transits through Hormuz, the November 1 OPEC+ meeting, and EIA’s next Short-Term Energy Outlook, which will update its assumptions on flows. Watch whether actual Hormuz traffic matches the flow assumptions in each forecast. Forecasts have repeatedly been too optimistic about how fast traffic would recover.
This article is general market information, not investment advice. Consider a licensed financial adviser before making decisions tied to oil prices.
Future Outlook
Crude is now a geopolitical market. Supply quotas matter less than shipping security, and the next major move will likely come from the conflict rather than from OPEC+ meetings. The forecast revisions since March show that the consensus has been wrong about recovery timing, and the safest assumption is that the next revision will also depend on events in the strait.
Frequently Asked Questions
Why isn’t OPEC+ raising output if prices are high?
OPEC+ has paused its increases for October and November 2026, keeping output at a combined 31.01 million barrels per day. Its quotas matter less than usual because disruptions through the Strait of Hormuz limit how much oil can reach buyers, and output is already below target. The group’s next meeting is November 1.
What is the latest EIA oil price forecast?
EIA’s October 2026 outlook raised its fourth-quarter Brent forecast to $105 a barrel, $14 above its September estimate. The agency also expects prices to fall from early October levels over time. Check EIA’s website for the latest release.
Will oil prices fall in 2027?
EIA expects prices to decline in 2027 as Middle East production returns toward pre-conflict levels, with its September outlook putting 2027 Brent at about $74 a barrel. That view depends on Hormuz flows normalizing, and past forecasts have been revised up when disruptions lasted longer than assumed.
How high is gasoline right now?
AAA reported a national average of $4.41 a gallon for regular gasoline on October 1, 2026. Prices change daily, so check AAA’s tracker before relying on the figure.
Discover more from The Economy
Subscribe to get the latest posts sent to your email.


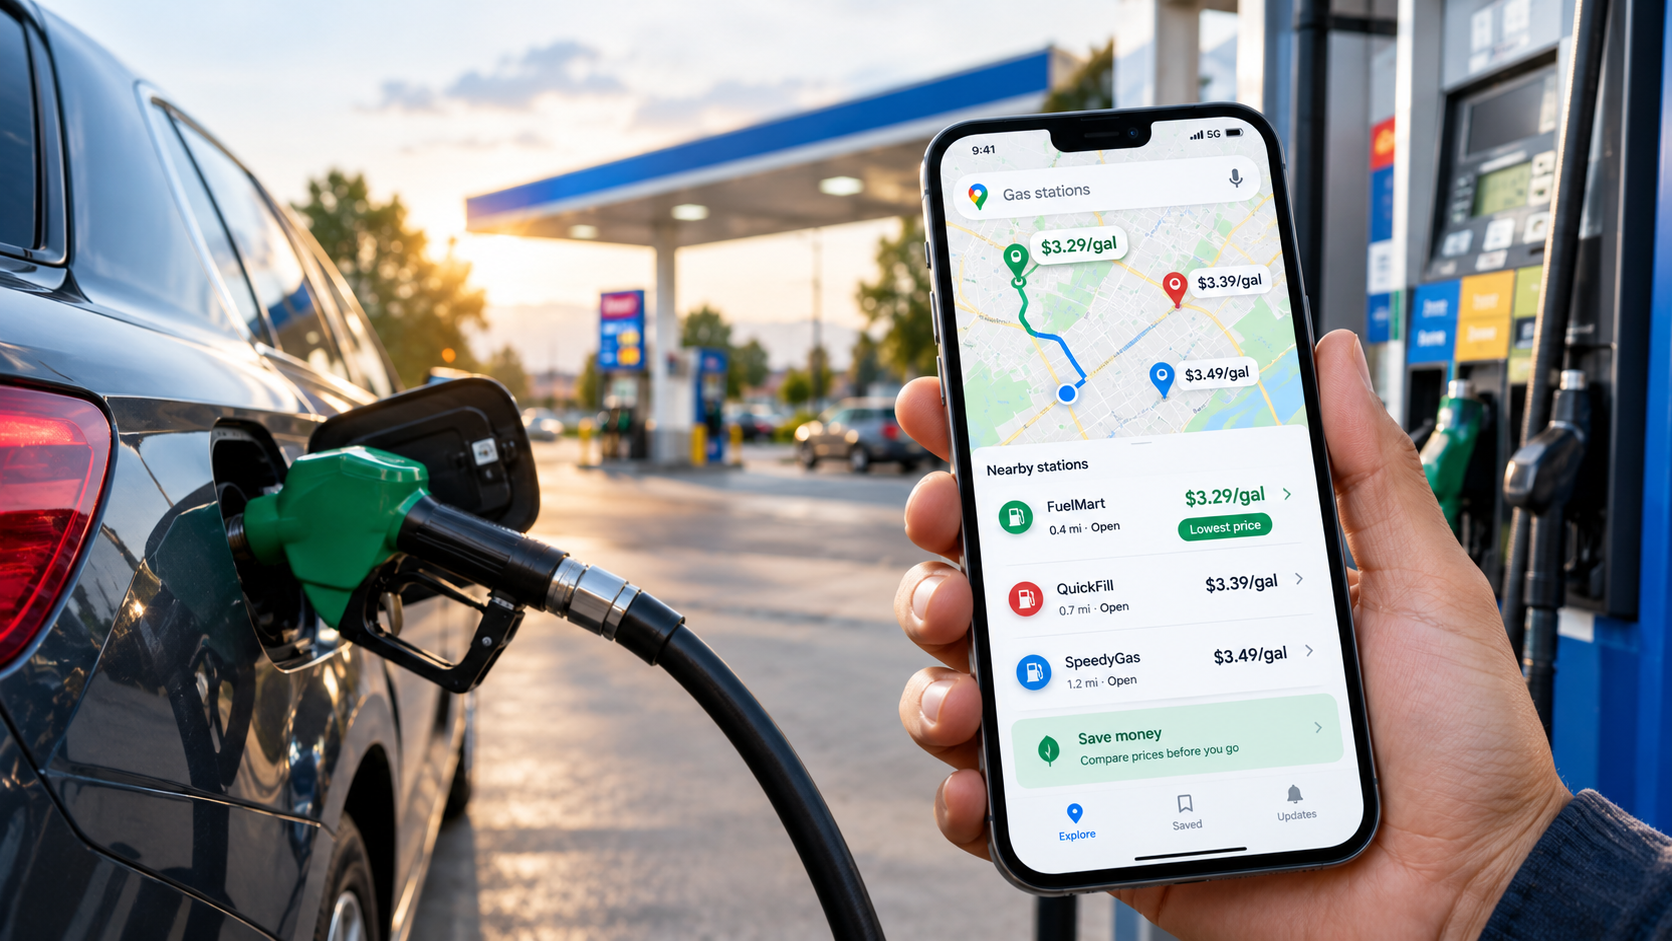
Google Maps shows gas prices at nearby stations, but its data isn’t truly real-time. Here’s how to use the feature, check accuracy, and cut fuel costs.
Key Takeaways
- Google Maps lists gas prices for nearby stations on Android, iOS, and desktop. Tap the gas option, or search “gas” in the search bar.
- Prices come from Google, not from drivers. Users cannot edit them, so accuracy depends on how quickly stations’ prices reach Google.
- Google says its fuel data is updated every 24 hours, so it cannot show the price at a pump at this moment.
- The US national average was $4.41 a gallon on October 1, 2026, according to AAA, up from $3.16 a year earlier. Savings matter more now than they did a year ago.
- Combine the map with AAA’s price tracker and the eco-friendly route setting to find cheaper fill-ups and trips.
Search Intent Summary
People searching this topic want to find the cheapest gas nearby and to know whether the prices they see are trustworthy. This guide shows how the feature works, where its data comes from, and how to use it alongside other sources.
A Note on “Real-Time” Fuel Prices
The phrase “real-time” overstates what Google Maps offers. Google’s Maps prices are shown by Google and are not user-editable. A reviewer testing the feature in 2025 found that major brands such as BP, Shell, and Speedway matched GasBuddy and the stations’ own prices, but some stations updated slowly, especially for grades other than regular, and some stations showed no prices at all.
A Google spokesperson also told a local TV station that the app’s data is updated every 24 hours. Prices can therefore lag behind what a station posts on its sign, and a price shown in the morning may be out of date by afternoon. Treat the map as a comparison tool for finding the cheaper area, then confirm the price at the pump.
How to Find Gas Prices on Your Phone
On Android and iOS, open Google Maps and tap the gas tile under the search bar. The app will show stations near you. Tap a station to see its details, including the listed price.
To look farther away, move the map to a new area and tap “Search this area.” Not every station displays a price, so you may need to scroll through the list. Tapping “View list” lets you compare several stations at once, which is faster than checking pins one by one.
If you already know which station you want, search for its name and tap its listing. The price appears in the station’s details, and you can see how far it is from your location.
How to Find Gas Prices on Desktop
On desktop, search for “gas” or “gas stations near me.” The station icons appear on the map, but prices are not always displayed next to the pins. Click a station to open its information panel, where the price is shown.
Desktop is useful for planning. If you are leaving for a trip, search the destination town or your route’s stops before you leave, so you can decide where to fill up.
Comparing Prices Without Getting Fooled
A cheap-looking price can still cost you more if the station is out of your way. Before choosing a station, check three things.
Distance matters. A five-cent saving on a station two miles away may not be worth the detour. Work out the difference on your tank size: a $0.20 gap on a 15-gallon fill-up is $3.00, which may or may not cover the extra driving.
Grade matters. Some stations show prices for regular only. Premium or diesel prices may be missing or slower to update.
Timing matters. Prices often change through the day, and stations may raise prices after a wholesale increase. Check the map in the morning, then confirm at the pump.
Cross-Check With Trusted Sources
For a reliable benchmark, check the AAA gas price tracker, which publishes daily national and state averages. On October 1, 2026, AAA reported a national average of $4.41 for regular unleaded, down about 7 cents from the previous week. September’s monthly average of $4.33 was the highest September figure on record. AAA attributed the easing to crude oil prices dipping back into the $90 range.
The Energy Information Administration publishes weekly retail gasoline prices, which are useful for tracking longer trends. A station’s price is best confirmed at the station itself, but these sources tell you whether the price you are seeing is high or low for your area.
Crowd-sourced apps such as GasBuddy can add station-level detail, but their data is user-submitted, so compare it against Google Maps and the station’s sign.
Use the Eco Route to Cut Fuel Use
Fuel costs depend on how much you burn, not just what you pay per gallon. Google Maps offers an eco-friendly route option that favors more fuel-efficient driving. The eco option is on by default for many users, so check that it is still enabled before you plan a trip.
Google has said that a fuel-efficient route typically adds one to two minutes to a trip and can save five to ten percent on gas. The savings depend on traffic, road type, and the vehicle, so treat the figure as an estimate.
A simple example shows the scale. Suppose a 300-mile trip in a car that gets 25 miles per gallon. That uses 12 gallons, or about $53 at $4.41 a gallon. A 5 to 10 percent saving is roughly $2.65 to $5.30. Those are hypothetical numbers, but they show that a short detour and a route change can add up across a year of driving.
Practical Strategy for Saving on Gas
Start with the map to find the cheapest station in your area. Confirm the price with the station’s sign before filling up, since the map can lag behind changes.
Compare prices in clusters rather than single stations. If several stations near a highway interchange charge less than the rest, that is a stronger signal than one outlier.
Use the eco route on longer trips, and avoid detours that cost more in fuel than they save at the pump. For a regular commute, the cheapest station on your route is often the best choice.
Keep an eye on the AAA and EIA averages. If your local price is well above the national average, you may be able to save by filling up at a station in a different city or zone.
Future Outlook
Gas prices are tied to crude oil, and crude is tied to the conflict affecting shipping routes in the Middle East. Prices have risen sharply this year, and they have also eased at times. The most useful habit is checking prices regularly rather than waiting for a spike to appear, since station prices can move quickly in both directions.
Frequently Asked Questions
Is Google Maps gas price data real-time?
No. Google says its fuel data is updated every 24 hours, and some stations’ prices update more slowly than others. Use the map to compare nearby options, then confirm the price at the station.
Why do some gas stations not show prices on Google Maps?
Not every station displays a price. Stations may not share prices with Google, or the data may be missing for certain fuel grades. Check the station directly or use a second source.
Can I edit a gas station’s price on Google Maps?
No. Prices on Google Maps are controlled by Google and cannot be edited by users. If a price looks wrong, the station’s posted price at the pump is the most reliable source.
Does the eco route really save gas?
Google says an eco route can save five to ten percent on fuel with a small extra travel time. Actual savings depend on traffic, road conditions, and your vehicle. It is a useful default, but it is not a guarantee.
Discover more from The Economy
Subscribe to get the latest posts sent to your email.
Markets & Finance
Red Dye Diesel in 2026: Tax Exemptions, Regulations, and the Real Agricultural Impact

Key Takeaways
- Red dye diesel is a tax marker, not a different fuel. The dye flags diesel on which the federal highway excise tax of 24.4 cents per gallon was not collected, because it is sold for exempt uses such as farming, home heating and local government, according to the IRS.
- Using it on the road is expensive. The federal penalty is the greater of $1,000 or $10 per gallon, per IRS Publication 510. That is roughly 41 times the tax a driver would be dodging.
- 2026 is an unusual year. U.S. on-highway diesel averaged $6.382 a gallon in the week of September 28, after a record $6.529 the week before and about $2.63 above a year earlier.
- States are loosening enforcement for harvest. North Carolina, Alabama and Arkansas have each acted, while the American Farm Bureau has asked Washington to waive federal penalties.
- Relief is local. State waivers do not erase federal exposure, and crossing a state line can put a driver back on the wrong side of the law.
If you have ever pulled up behind a tractor and noticed the fuel tank cap, or walked past a farm pump with a bright red nozzle, you’ve seen red dye diesel. It looks like a curiosity. It is actually one of the quietest, most important tax-enforcement tools in American agriculture.
This year it’s also a news story. Diesel hit record highs just as the fall harvest began, and the question of who can burn dyed fuel, where, and at what risk, has moved from a niche compliance topic to a governors’ agenda item.
Here is what red dye diesel is, how the tax logic works, what the penalties look like, and why 2026 has made it matter far beyond the farm gate.
What Red Dye Diesel Actually Is
Red dye diesel, often called dyed diesel, off-road diesel or farm diesel, is ordinary diesel with red dye added at the terminal. The chemistry is the same as clear diesel. The paperwork is not.
The dye exists to make tax evasion visible. Because fuel sold for exempt uses is not taxed, regulators needed a way to tell at a glance whether a tank holds taxed or untaxed fuel. Red does the job.
According to the IRS, dyed diesel is ordinarily untaxed because it’s sold for uses exempt from excise tax, such as to farmers for farming purposes, for home heating use and to local governments. The tax that normally applies to highway diesel is 24.4 cents per gallon at the federal level, and states add their own.
Dyed vs. Clear Diesel: The Comparison
| Feature | Dyed (red) diesel | Clear (undyed) diesel |
|---|---|---|
| Federal highway excise tax | Not collected for exempt uses | 24.4 cents per gallon |
| Typical allowed uses | Farm equipment, generators, heating, construction machinery off-road | On-road vehicles and general use |
| Pump price gap | Often 20 to 30 cents cheaper, per local reporting | Higher, because taxes are included |
| Highway use | Prohibited unless a specific exception or relief applies | Allowed |
| Penalty for misuse | Greater of $1,000 or $10 per gallon, plus the tax owed | Not applicable |
Notice what is missing from that table: a quality difference. Red diesel is not “dirtier” or “weaker.” The distinction is legal, not mechanical.
The Penalty Math Nobody Wants to Learn the Hard Way
The incentive to cheat looks small on paper. At 24.4 cents a gallon, filling a 100-gallon tank with dyed fuel saves about $24. But the penalty under federal law is the greater of $1,000 or $10 per gallon, as laid out in Publication 510.
Run the numbers on a bigger tank:
- 100 gallons: about $24.40 of tax avoided, versus a $1,000 minimum penalty.
- 300 gallons: about $73.20 avoided, versus $3,000.
- Per gallon: 24.4 cents against $10, a ratio of roughly 41 to 1.
On top of the federal exposure, states layer their own penalties. Arkansas, for example, noted in a recent order that improper use can bring additional tax and a $10-per-gallon penalty calculated on the full capacity of a vehicle’s tanks. Mixing dyed and undyed fuel can also trigger charges.
Why 2026 Changed the Conversation
For years, the dyed-diesel debate was a footnote. This fall it became a headline, because the price of diesel moved the economics of farming.
The price shock
The U.S. Energy Information Administration’s weekly survey put national on-highway diesel at $6.382 in the week of September 28, 2026, including taxes. That followed a record $6.529 the previous week, and it was $2.628 higher than a year earlier. California averaged about $8.18.
The driver is the war involving Iran and the disruption around the Strait of Hormuz, which has pushed up crude and distillate prices globally. Off-road diesel is cheaper at the pump because it escapes road taxes, but, as Axios reported, its price moves in tandem with the on-highway fuel.
The farm-level damage
Fuel is a modest share of farm costs in a normal year. This isn’t a normal year.
| Indicator | 2026 figure | Source |
|---|---|---|
| Fuel as a share of corn, soybean and wheat production expenses | Around 3% to 5% | Farm Bureau, via Axios |
| Estimated extra diesel cost across four southern row crops | About $247 million | Auburn University analysis |
| Farm diesel price, week ending September 18 | $5.42 per gallon | Alabama Extension |
| Fuel cost increase per acre, corn / soybeans | $11 / $7 | Purdue’s Michael Langemeier, via Farm Progress and Bloomberg |
Farmers also can’t easily pass costs along. The Farm Bureau’s John Newton has described the squeeze in simple terms: growers buy at retail and sell at wholesale. Add higher fertilizer bills from the same conflict, and many operations are working with thin margins.
States Step In: Relief for Harvest
When harvest season collides with record fuel prices, state governments have a lever they can pull quickly: temporarily relaxing enforcement of the highway-use ban on dyed fuel.
- Alabama: Governor Kay Ivey directed a 120-day halt to enforcement of off-road diesel use on state highways.
- North Carolina: Governor Josh Stein asked the Department of Revenue to waive the state penalty through December 31, 2026. The state’s notice says the relief applies to farming and agricultural highway use, and users must still pay the state excise tax of 41 cents per gallon.
- Arkansas: An executive order suspended specified taxes and penalties for qualifying farm and logging vehicles.
Rep. Don Davis (NC-01) said at least ten governors had suspended or relaxed these penalties, and he urged the IRS to grant federal relief using its existing authority.
What federal relief would look like
The IRS has done this before. In 2021, after a fuel-supply disruption, it waived the dyed-fuel penalty for highway use in a set of states for two weeks, on the condition that the operator or seller paid the 24.4-cent tax. As of the Farm Bureau’s October 1 letter, the group was asking the White House to suspend the federal highway diesel tax and waive penalties for emergency use. We found no federal waiver announced at the time of writing, so check the IRS newsroom before you rely on one.
How to Stay Compliant This Harvest
- Know your state’s rule and its end date. State relief is not federal relief, and it usually expires.
- Pay any required tax. Waivers frequently require the state or federal excise tax to be paid.
- Don’t cross state lines on the assumption you’re covered. North Carolina’s own notice warns that vehicles running dyed fuel outside the state may face federal and other-state penalties.
- Flush tanks afterward. Dye remnants can linger, and regulators advise clearing them before relief ends.
- Keep records. Receipts, farm use logs and dates protect you in a dispute.
- Consider the refund route. Buyers of clear diesel used off-highway can often claim a credit on their federal return using the fuel-tax credit form, so ask your tax preparer.
Red Diesel Outside the U.S.
The same concept exists elsewhere, with different politics. In the United Kingdom, rebated “red” diesel entitlement was sharply narrowed in April 2022. Agriculture, horticulture, forestry and fish farming kept their entitlement, while most construction users lost it. GOV.UK’s Excise Notice 75 guidance sets out the permitted uses. The lesson travels: a cheap, tax-advantaged fuel survives only as long as the rules defining its use are credible.
Asked & Answered
Is it illegal to use red dye diesel in a pickup truck on the road?
Generally yes, in the United States. Dyed diesel is intended for off-road, tax-exempt uses. Highway use can trigger the greater of a $1,000 or $10-per-gallon federal penalty, plus any tax owed, unless a specific exception or temporary relief applies.
How do authorities know I used dyed fuel?
Inspectors can check a vehicle’s fuel supply for the dye, and the red color is visible in a sample. That is the entire reason the dye exists.
Will the IRS waive dyed diesel penalties in 2026?
It has done so in past supply disruptions, and farm groups and state officials are asking for relief now. At the time of writing, we found no announced federal waiver, so check the IRS newsroom for the latest.
Does state relief protect me from federal penalties?
No. State waivers apply only to state penalties. Federal law remains in force unless the IRS issues its own relief, and other states may enforce their rules if you cross a border.
Why is red diesel cheaper than regular diesel?
Because road-use taxes aren’t collected on it. The fuel is the same, but without the 24.4-cent federal tax and typical state taxes, the pump price is lower.
Discover more from The Economy
Subscribe to get the latest posts sent to your email.
Markets & Finance
Southeast Asia’s LNG Dilemma: Navigating Price Volatility, Infrastructure Gaps, and Energy Security

Southeast Asia’s accelerating industrial growth and rapid depletion of domestic gas fields have transformed the region into a critical frontier for global Liquefied Natural Gas (LNG) demand. However, this transition exposes emerging Asian economies to severe spot-market price volatility, geopolitical supply chain disruptions, and critical regasification infrastructure deficits. Balancing near-term power stability with long-term decarbonization pledges requires a strategic recalibration of LNG procurement, terminal development, and regional pipeline connectivity.
The Macro Demand Shift: Depleting Reserves & Domestic Shortfalls
For decades, countries like Thailand, Malaysia, and Indonesia relied on domestic natural gas to power grid expansion and industrial development. Today, maturing legacy fields are experiencing steep natural decline rates. According to analysis from the International Energy Agency (IEA), Southeast Asia’s net energy trade deficit is projected to widen significantly as indigenous production drops below domestic demand thresholds.
To prevent acute power shortages, regional utilities are turning to imported LNG as a bridge fuel to phase out coal-fired generation. Yet, substituting domestic piped gas with imported LNG exposes power markets directly to international supply-demand shocks:
- Supply Chokepoint Vulnerabilities: Maritime trade routes remain highly sensitive to geopolitical tensions, particularly across critical transit corridors like the Strait of Hormuz and the Malacca Strait, as reported by Reuters.
- Fiscal Exposure: Price spikes directly impact state-subsidized utility markets, straining national budgets in price-sensitive developing economies such as Vietnam and the Philippines.
- Contractual Mismatches: Many regional buyers remain over-indexed on short-term spot markets rather than long-term Sale and Purchase Agreements (SPAs), leaving them vulnerable to market squeezes during peak winter heating cycles in North Asia and Europe.
Infrastructure Bottlenecks Across the ASEAN Energy Landscape
Importing LNG requires capital-intensive midstream infrastructure—including onshore regasification terminals, Floating Storage Regasification Units (FSRUs), break-bulk distribution facilities, and high-pressure transmission pipelines. Infrastructure deployment across the region remains fragmented:
1. Archipelagic Geography & Storage Limits
The island geography of the Philippines and Indonesia severely complicates central grid distribution. Small-scale LNG distribution requires specialized shallow-draft carriers and modular FSRUs, which carry higher capital expenditure per unit of energy delivered compared to centralized world-scale onshore terminals.
2. Grid Interconnection & Pipeline Gaps
While the proposed Trans-ASEAN Gas Pipeline (TAGP) aims to interlink regional gas grids, progress remains stymied by regulatory mismatches, cross-border tariff disputes, and physical infrastructure deficits. Without interconnectivity, surplus regasification capacity in one nation cannot cushion supply deficits in another.
3. Terminal Offtake Financing Hurdles
Financial institutions evaluating midstream gas projects require bankable, long-term power purchase agreements (PPAs). Uncertainty surrounding electricity tariff reform and currency fluctuation delays Final Investment Decisions (FIDs) for major regasification projects, according to market intelligence from S&P Global Energy.
Country-by-Country LNG Infrastructure & Import Trajectory
The operational realities, regasification capacities, and procurement strategies differ substantially across key Southeast Asian markets:
| Country | Key Demand Drivers | Active/Planned Regas Capacity | Primary Procurement Strategy | Major Infrastructure Challenge |
| Singapore | 95% gas-fired power generation; industrial bunkering hub | ~10 MTPA (SLNG expansion underway) | Long-term SPAs + Portfolio Hedging | Land constraints for large-scale onshore storage expansion |
| Thailand | Depleting Gulf of Thailand gas fields; power generation | ~19 MTPA (Map Ta Phut Phase 1 & 2) | Mixed long-term contracts & spot purchases | High exposure to spot JKM price spikes during summer cooling peaks |
| Vietnam | Transitioning from coal; industrial power demand | ~1–3 MTPA (Thi Vai terminal live; Son My planned) | High spot-market dependency | Absence of cost-reflective retail power tariffs for gas-to-power projects |
| Philippines | Depletion of Malampaya gas field | ~5 MTPA (Batangas FSRUs operational) | Short-to-medium term contracts | Archipelagic gas transport; lack of cross-island pipeline links |
| Malaysia | Regional LNG exporter transitioning to domestic importer in Peninsular West | ~7.3 MTPA (Pengerang & Melaka terminals) | Internal portfolio balancing via Petronas | Internal geographical demand split between Sabah/Sarawak and Peninsular Malaysia |
Strategic Framework: De-Risking Southeast Asia’s Gas Transition
To mitigate price volatility and bridge infrastructure deficits, regional energy planners and corporate buyers must adopt a multi-tiered procurement and structural framework:
+-----------------------------------------------------------------------------------+
|                        REGIONAL LNG RISK MITIGATION FRAMEWORK                     |
+------------------------------------+----------------------------------------------+
| 1. Contract Portfolio Optimization | Balance 70-80% Long-Term SPAs with Spot JKM  |
+------------------------------------+----------------------------------------------+
| 2. Midstream Agility               | Deploy Modular FSRUs to shorten FID timelines |
+------------------------------------+----------------------------------------------+
| 3. Regional Pricing Benchmarks    | Develop an ASEAN Gas Index to decouple oil   |
+------------------------------------+----------------------------------------------+
| 4. Hybrid Grid Integration         | Pair Gas-to-Power with Solar/Energy Storage  |
+------------------------------------+----------------------------------------------+
1. Rebalancing Contract Portfolios
Energy buyers must shift away from pure spot exposure. Securing long-term SPAs indexed to Henry Hub or Brent crude provides price stability, while retaining a 15–20% spot allotment maintains operational flexibility. Market outlooks published by Shell Global emphasize that long-term contracting remains the primary shield against geopolitical price shocks.
2. Accelerated Deployment of Modular Infrastructure
FSRU technology offers a significantly shorter lead time (18–24 months) compared to onshore terminals (4–5 years). Developing nations can leverage leased FSRUs to initiate import capabilities while onshore pipeline networks are built out.
3. Constructing an ASEAN LNG Pricing Hub
Establishing localized regional trading hubs (such as Singapore’s SLNG expansion) enables the creation of an ASEAN-specific price benchmark. This reduces over-reliance on the North Asian Japan Korea Marker (JKM) and better reflects local market dynamics, a strategy actively analyzed by the U.S. Department of Energy.
4. Co-Optimization with Renewable Energy
Gas-to-power infrastructure should not be viewed in isolation. Gas turbines must be deployed as flexible, quick-start balancing units alongside expanding solar and wind capacity, ensuring system reliability without locking utilities into unmanageable fossil fuel import bills.
Outlook: The Balancing Act Ahead
Southeast Asia’s demand for LNG is structural and unavoidable over the coming decade. However, transforming LNG from a volatile financial burden into a secure transition fuel requires disciplined infrastructure planning, tariff reforms, and sophisticated procurement strategies. Without regional coordination and strategic long-term contracting, ASEAN power markets remain exposed to global market dynamics beyond their control.
Discover more from The Economy
Subscribe to get the latest posts sent to your email.

Anthropic Draws the Line: Why Claude’s New Usage Policy Explicitly Bans ‘Cruel Behavior’ Toward AI

Ynon Kreiz & Mattel’s Digital Transformation: Franchise Strategy and Financial Growth

Crude Oil & Petroleum Market Analysis: OPEC+ Decisions and Price Forecasts

Top US Convenience Store Chains: Store Counts, EV Charging, and Sales Trends

Publix Store Closures Tracker: Locations, Rebuild Status, and What’s Changing

How to Find Google Maps Fuel Prices and Save on Every Fill-Up

Global Market Outlook: Navigating Interest Rates, Inflation, and Commodity Spikes

PEP Stock Analysis: PepsiCo Financials, Dividend Yield, and Sector Volatility

Social Security $90 Payment Claims: What’s Real, What’s a Scam, and What Your 2027 COLA Could Be

EU vs UK Electric Vehicle Tariffs: Impact on Automotive Supply Chains & Consumer Prices

Complete Guide to Home Loan Refinancing: Interest Rate Trends & Loan Calculation Strategies

Algorithmic Dogfights: Why the U.S. and China Must Establish Rules of Engagement for Autonomous Air Power

Stock Market Today: Dow, S&P 500, and Nasdaq Retreat as Treasury Yields

Global Economic Outlook 2026: 7 Forces Reshaping Markets, Trade and Business

Oil Prices Break $100 in 2026: Middle East Conflict & Energy Markets

China Stocks Today: Are Big Economies in Asia Nearing a Market Bottom?

Middle East War Economics 2026: Oil Prices & Energy Markets

PSX Forecast 2026: KSE-100, IMF Reviews & Geopolitics

Crypto Daily Outlook: Bitcoin, Altcoins, and the Future of Decentralized Finance

Global Pension Systems Ranked: The World’s Best and Worst Retirement Frameworks

Enterprise AI Platforms Disrupting B2B SaaS in 2026: Full Analysis

World’s Largest Economies: Ranking the Top Global Powers

Elon Musk’s Next Moves: Disrupting the 2026 Global Economy

Pakistan Economy 2026: Inside the SBP’s Balancing Act

GasBuddy Market Insights: How Crude Price Shifts Impact Local Fuel Cost Averages

World Bank & IMF Reports 2026: Why the “3% Growth” Consensus Is Actually a Debate

Global Equity Market Divergence: US Tech vs. European Dividend Stocks vs. Asian Growth

Stock Market Today: Dow Climbs 500 Points as Markets Shake Off Inflation Jitters
-

 Markets & Finance9 months ago
Top 15 Stocks for Investment in 2026 in PSX: Your Complete Guide to Pakistan’s Best Investment Opportunities
-

 Analysis8 months ago
Johor’s Investment Boom: The Hidden Costs Behind Malaysia’s Most Ambitious Economic Surge
-

 Analysis8 months ago
Top 10 Stocks for Investment in PSX for Quick Returns in 2026
-

 Banks9 months ago
Best Investments in Pakistan 2026: Top 10 Low-Price Shares and Long-Term Picks for the PSX
-

 Analysis8 months ago
Brazil’s Rare Earth Race: US, EU, and China Compete for Critical Minerals as Tensions Rise
-

 Investment9 months ago
Top 10 Mutual Fund Managers in Pakistan for Investment in 2026: A Comprehensive Guide for Optimal Returns
-

 Global Economy10 months ago
15 Most Lucrative Sectors for Investment in Pakistan: A 2025 Data-Driven Analysis
-

 Global Economy10 months ago
Pakistan’s Export Goldmine: 10 Game-Changing Markets Where Pakistani Businesses Are Winning Big in 2025