
Oil Markets
Crude Oil & Petroleum Market Analysis: OPEC+ Decisions and Price Forecasts


OPEC+ has paused output increases for a second month as Hormuz disruptions limit supply. Here’s how Brent forecasts have moved, what drives prices, and what to watch.
Key Takeaways
- OPEC+’s seven core members kept output unchanged for November 2026 at a combined 31.01 million barrels per day, after pausing in October. The group’s next meeting is November 1.
- OPEC+ decisions matter less than usual right now. Disruptions through the Strait of Hormuz, not quota levels, set the physical supply, and OPEC+ output is running below target.
- Brent averaged about $114 a barrel in September 2026, according to EIA’s October outlook. It traded at $100.53 on October 6.
- EIA raised its Q4 2026 Brent forecast to $105 a barrel in its October outlook, but still expects prices to fall from early October levels.
- Forecasts have been revised upward repeatedly since the conflict began in late February. Treat any single forecast as a snapshot, not a settled view.
Search Intent Summary
Readers searching for crude oil analysis want to know where prices are going and why. This article covers the latest OPEC+ decision, how EIA’s forecasts have moved, and the supply risks that dominate the outlook.
How the Shock Unfolded
Brent averaged about $71 a barrel on February 27, 2026, just before military action in the Middle East began on February 28. By March 9, it had climbed to $94, as the Strait of Hormuz was effectively closed to most shipping. The Energy Information Administration (EIA) reported that insurance cancellations and the threat of attacks led most tankers to avoid the strait.
Prices peaked in April. EIA’s June outlook showed Brent averaging $85 in June, $32 a barrel below the April peak. That implies an April average near $117, a figure derived from EIA’s own numbers.
A June 18 memorandum of understanding between the United States and Iran eased the pressure. Shipping through the strait recovered, and in July, EIA forecast that Brent would average $74 in the third quarter. That relief did not last. Fighting resumed in August, and Brent rose more than 30% from its early-August low by mid-September.
The OPEC+ Position
The seven core OPEC+ members are Saudi Arabia, Russia, Iraq, Kuwait, Kazakhstan, Algeria, and Oman. They had been raising output monthly from April through September 2026, as part of a phased rollback of 1.65 million barrels per day in voluntary cuts first announced in 2023. That rollback was completed in August.
Since then, the group has paused. On September 6, it kept October output unchanged. On October 4, it kept November output unchanged at a combined 31.01 million barrels per day, excluding compensation volumes. Saudi Arabia’s target is 10.478 million barrels per day, Russia’s is 9.949 million, and Iraq’s is about 4.4 million. The group reaffirmed its commitment to compliance with the Declaration of Cooperation, and its next meeting is November 1.
Quotas do not equal output. Analysts have noted that OPEC+ has limited influence over the physical market, since exports through Hormuz are constrained. Output has stayed below target because of those disruptions and constraints on Russian oil flows. Rystad Energy’s Jorge Leon described OPEC+’s power over the physical oil market as very limited while the conflict continues.
The group also faces a longer decision. Its broader production cuts run through the end of 2026, and members must review production capacity to set 2027 baselines. Sources told Reuters that OPEC+ was likely to pause increases in the fourth quarter, though the group has not confirmed that.
What the Forecasts Show
EIA’s Short-Term Energy Outlook is the most-watched public forecast in this market. Its Brent forecasts for 2026 have moved repeatedly as the conflict developed.
| EIA Outlook | 2026 Brent Forecast | 2027 Brent Forecast | Key Assumption |
|---|---|---|---|
| March 2026 | $78.84 | $64.67 | Hormuz disruption expected to be temporary |
| April 2026 | $96 | $76 | Conflict assumed to end by April |
| July 2026 | $82 | $65 | Strait reopens after June memorandum |
| August 2026 | $87 | $69 | Hormuz constraints persist through August |
| September 2026 | $91.01 | $73.74 | Gradual improvement in Hormuz flows |
| October 2026 | Q4 2026 at $105 | Not retrieved | Restrictions on flows persist into Q4 |
The pattern is clear. Each forecast assumed the disruption would ease sooner than it did, and each one was revised up. The October outlook raised its fourth-quarter estimate by $14 a barrel from September, and it expects oil flows from the Middle East to remain restricted through the quarter.
EIA also expects prices to decline from early October levels over time. Its longer-term view has Brent falling toward the $70s in 2027, but that path depends on flows through Hormuz returning to normal.
Supply and Demand
On the supply side, the disruption is large. The International Energy Agency’s August forecast, as cited by market analysts, projected global supply falling by about 4.3 million barrels per day in 2026, or roughly 4%. EIA’s September outlook, meanwhile, expected Middle East production to rise as flows gradually increased and alternative export routes were used.
Alternative routes matter. Saudi Arabia has rerouted some crude through its East-West pipeline to the Red Sea port of Yanbu. That reduces but does not eliminate the Hormuz constraint, and it puts pressure on the Bab al-Mandab Strait, which is now carrying much more traffic.
On the demand side, the picture is softer. OPEC lowered its forecast for 2026 world oil demand growth to 380,000 barrels per day, its fifth consecutive downward revision. High prices are weighing on consumption, which partly offsets the supply loss.
The US is a relative bright spot. EIA’s September outlook forecast US crude production of about 13.8 million barrels per day in 2026, rising to about 14.3 million in 2027. Higher prices encourage more domestic output, though new wells take months to add supply.
Fuel Prices Follow Crude
Retail fuel prices lag crude by weeks. AAA reported a national average of $4.41 for regular gasoline on October 1, 2026, down about 7 cents from a week earlier. September’s monthly average of $4.33 was a record for that month. EIA’s outlook projects that diesel will average $4.85 a gallon in 2026, and that tightness in distillate markets has pushed diesel prices higher than gasoline.
For consumers, the message is that fuel costs track crude with a delay. A drop in crude may not reach the pump for several weeks, and a spike can show up at the pump quickly. This matters for household budgets, for freight costs, and for inflation, which is covered in the separate global outlook article.
Scenarios for the Next Six Months
These are analytical scenarios, not forecasts.
Flows recover steadily. Hormuz traffic rebuilds, Middle East output returns toward pre-conflict levels, and Brent falls back toward the $80s or lower. This matches EIA’s broad expectation that production returns to near pre-conflict levels by early 2027.
Disruption persists. Attacks on tankers and infrastructure continue, flows stay restricted, and Brent holds near or above $100. EIA’s October outlook already assumes restrictions through the fourth quarter, which makes this scenario close to the agency’s current view.
Escalation. A major new attack on energy infrastructure or a prolonged closure of alternative routes pushes prices well above recent levels. This scenario has the greatest uncertainty, and EIA warns that flow volatility will produce short-term price swings beyond its central forecast.
Practical Strategy: What to Watch
For energy-sensitive businesses, the priority is hedging and inventory planning, since price swings have been large and fast. For households, fuel budgets should assume prices stay elevated for months rather than days.
For investors, the key indicators are weekly tanker transits through Hormuz, the November 1 OPEC+ meeting, and EIA’s next Short-Term Energy Outlook, which will update its assumptions on flows. Watch whether actual Hormuz traffic matches the flow assumptions in each forecast. Forecasts have repeatedly been too optimistic about how fast traffic would recover.
This article is general market information, not investment advice. Consider a licensed financial adviser before making decisions tied to oil prices.
Future Outlook
Crude is now a geopolitical market. Supply quotas matter less than shipping security, and the next major move will likely come from the conflict rather than from OPEC+ meetings. The forecast revisions since March show that the consensus has been wrong about recovery timing, and the safest assumption is that the next revision will also depend on events in the strait.
Frequently Asked Questions
Why isn’t OPEC+ raising output if prices are high?
OPEC+ has paused its increases for October and November 2026, keeping output at a combined 31.01 million barrels per day. Its quotas matter less than usual because disruptions through the Strait of Hormuz limit how much oil can reach buyers, and output is already below target. The group’s next meeting is November 1.
What is the latest EIA oil price forecast?
EIA’s October 2026 outlook raised its fourth-quarter Brent forecast to $105 a barrel, $14 above its September estimate. The agency also expects prices to fall from early October levels over time. Check EIA’s website for the latest release.
Will oil prices fall in 2027?
EIA expects prices to decline in 2027 as Middle East production returns toward pre-conflict levels, with its September outlook putting 2027 Brent at about $74 a barrel. That view depends on Hormuz flows normalizing, and past forecasts have been revised up when disruptions lasted longer than assumed.
How high is gasoline right now?
AAA reported a national average of $4.41 a gallon for regular gasoline on October 1, 2026. Prices change daily, so check AAA’s tracker before relying on the figure.
Discover more from The Economy
Subscribe to get the latest posts sent to your email.


Markets & Finance
Oil Price Outlook 2026: How Supply Risks Reach Fuel Bills, Inflation and Business Costs

Oil prices matter because their effects spread well beyond the energy market. A change in crude costs can alter airline economics, freight charges, farm expenses and household budgets. Yet the route from an oil headline to a local petrol price is neither immediate nor uniform.
The US Energy Information Administration’s October 2026 Short-Term Energy Outlook forecasts Brent crude averaging $105 per barrel in the fourth quarter, $14 above its previous projection. Published on 6 October, the forecast assumes continuing constraints on Middle Eastern flows alongside gradual improvements in production and exports.
The revision shows why a single price target needs context. Oil forecasts depend on physical supply, transport access, inventories and demand. Change one of those assumptions materially, and a forecast that looked reasonable a month earlier may need substantial revision.
A forecast average is not today’s oil price
The most common comparison error is treating a quarterly average forecast as a live market quotation. A quarter can contain sharp rises and falls while still producing an average near the forecast. A year-end target answers a different question again.
Benchmark differences matter too. Brent and West Texas Intermediate represent different crude markets and delivery arrangements. Their prices are related but not identical. An article using one benchmark in the headline and another in the comparison can confuse readers about the size of a move.
Always check the unit, benchmark, time period and publication date. A forecast completed before a major disruption should not be presented as though it incorporates that disruption. The EIA identifies both the release date and forecast completion date, a useful practice for interpreting any time-sensitive energy projection.
Physical supply is more than production capacity
Having oil underground or even at a producing facility is not the same as delivering it to a refinery. Pipelines, ports, tankers, insurance and navigation routes all form part of effective supply.
A disruption at a narrow transport point can therefore matter disproportionately. Alternative routes may exist but lack enough capacity, require longer journeys or introduce additional costs. Longer voyages also tie up vessels, affecting the amount of transport available for other cargoes.
The International Energy Agency’s August 2026 Oil Market Report highlights the importance of disrupted flows in its supply assessment. That report is a dated analysis rather than an October update. Its broader relevance is the distinction between nominal production potential and oil that can actually reach buyers when needed.
Inventories provide a buffer, not an unlimited solution
Stored oil can help bridge a temporary gap between supply and demand. Commercial inventories support normal operations, while government-held reserves may be used under specific policy decisions. Neither should be treated as a permanent substitute for reliable production and transport.
The rate of inventory change can matter as much as the absolute level. Repeated withdrawals suggest that the market is meeting demand partly by using previously accumulated supply. If that continues, the capacity to absorb another disruption may diminish.
Inventory data also require interpretation. Stocks in one location or product category may not solve a shortage elsewhere. Crude oil cannot instantly substitute for unavailable diesel, and transport constraints can prevent stocks from reaching the region where they are most valuable. The practical question is usable supply in the right place and form.
Refining explains why diesel and petrol can behave differently
Crude must be processed into usable products, and refineries have different capabilities. Maintenance, unexpected outages and the composition of demand can affect the supply of individual fuels.
Consequently, petrol and diesel prices do not have to move by the same amount as crude or as each other. A shortage of a particular product can widen its price relative to the underlying oil benchmark. Seasonal changes in transport and heating demand can add further variation.
For businesses, this means a crude forecast may be an incomplete budgeting tool. A logistics operator cares about delivered diesel costs, while an airline is exposed to jet fuel. Their relevant prices include refining, transport and contractual factors that an international crude quotation does not fully capture.
Currency movements change the local result
Oil is widely priced in dollars, but most households and many businesses pay fuel bills in another currency. A weaker local currency can amplify an international price rise or erase the benefit of a decline.
Consider a hypothetical 10% fall in the dollar oil price combined with a 10% increase in the local-currency price of dollars. The combined effect is approximately a 1% decline before other costs, rather than the full 10% saving suggested by the commodity headline.
Taxes, administered prices, subsidies and distribution charges create additional differences between countries. Readers should therefore be cautious about explanations that attribute every pump-price movement to crude alone. In markets such as Pakistan, the exchange rate and domestic pricing decisions can materially influence the final bill.
The inflation effect arrives through several channels
Fuel has a direct place in household expenditure, but energy also enters the cost of producing and delivering other goods. A business facing higher transport bills may raise prices, reduce its margin, alter routes or renegotiate contracts.
How much reaches consumers depends on competition and demand. Companies may find it difficult to pass through costs when customers are already reducing purchases. In that case, the pressure can appear in profitability, hiring or investment instead.
This is why an energy shock can create a difficult economic combination: upward pressure on prices and downward pressure on activity. The size and persistence of each effect depend on the shock’s duration, the structure of the economy and the response of businesses, households and policymakers.
What could pull oil prices lower?
A more reliable flow of supply could reduce the premium associated with disruption. Better transport access, recovering output or additional deliveries from other producers might ease pressure, depending on their scale and timing.
Demand can also weaken. Slower industrial activity, reduced travel or greater efficiency can lower consumption relative to expectations. A falling oil price is therefore not automatically positive news about the global economy; it may reflect improving supply, deteriorating demand or both.
These possibilities should be treated as scenarios. A price decline caused by restored supply would have different implications from one caused by a sharp economic downturn. Readers assessing a market move should ask which side of the supply-demand balance changed and what evidence supports that interpretation.
What could keep prices elevated?
Persistent transport restrictions, damage to infrastructure or uncertainty over reliable deliveries could sustain pressure even if some production recovers. A market with limited spare buffers may react strongly to relatively small additional problems.
Demand can also prove more resilient than expected. Businesses may have limited short-term substitutes for certain fuels, while households still need to commute and transport essential goods. Adjustment often takes time because vehicles, industrial equipment and logistics networks cannot be replaced overnight.
The bullish scenario is therefore not simply that something bad happens. It is that available supply fails to keep pace with consumption for long enough to draw down buffers and change expectations. The strength of that argument depends on measurable flows and inventories, rather than dramatic language alone.
How businesses can plan without predicting perfectly
A useful budget tests several fuel-cost assumptions. The aim is to identify when margins become uncomfortable, which contracts allow adjustments and which operations are most exposed. Scenario planning can reveal vulnerabilities without requiring a precise forecast of the next price peak.
Operational measures may include consolidating deliveries, reducing avoidable mileage and reviewing energy-intensive processes. Their usefulness depends on the business; they are not substitutes for understanding contractual obligations or customer-service requirements. Financial hedging involves separate risks and requires expertise appropriate to the organisation.
The oil outlook in 2026 is best read as a changing assessment of physical flows and economic responses. Forecasts help organise the evidence, but the final effect on a household or company depends on the fuel it buys, the currency it uses and the flexibility it has to adapt.
Discover more from The Economy
Subscribe to get the latest posts sent to your email.

President Donald Trump’s decision to allow Russian diesel supplies to reach American and international markets has opened a new dispute between Washington and Kyiv, raising difficult questions about energy security, sanctions policy and the future of US support for Ukraine.
The agreement, announced after Trump’s conversation with Russian President Vladimir Putin, comes at a particularly sensitive moment. Ukraine is continuing its fight against Russia’s invasion, global fuel markets are facing severe supply pressures, and diplomatic efforts to end the war remain uncertain.
Ukrainian President Volodymyr Zelensky has criticized sanctions relief that is not tied to reciprocal de-escalation, arguing that Russian petroleum revenue could help Moscow sustain its military campaign. The Trump administration, meanwhile, has presented additional fuel supplies as a potential way to ease pressure on consumers.
But the central question is whether the arrangement can deliver meaningful economic benefits without weakening Washington’s leverage over the Kremlin.
Why Trump Reached a Diesel Agreement With Putin
According to an October 10 report by Axios, a US official said Trump’s decision followed repeated Ukrainian refusals to halt attacks on Russian oil refineries despite US requests.
The report adds a significant diplomatic dimension to the agreement. Rather than being solely an energy transaction, the decision appears connected to disagreements over military strategy, energy infrastructure and Washington’s approach to negotiations with Moscow.
Trump announced the arrangement after speaking with Putin and argued that additional Russian diesel would help bring fuel prices down. His announcement also coincided with discussions involving US, Ukrainian and European representatives seeking progress toward ending the war.
According to The Associated Press, Trump announced an initial supply exceeding 300,000 metric tons, followed by 500,000 tons in November and further shipments afterward.
The precise delivery schedule, payment arrangements and ultimate volumes remain important unanswered questions. Announced commitments should not be confused with completed deliveries.
The distinction matters because the agreement’s economic and political consequences will depend on what actually reaches the market and under what conditions.
Why Zelensky Objects to Easing Russian Oil Sanctions
Kyiv’s opposition reflects a longstanding concern: energy exports provide Russia with revenue that can support its economy during the war.
Zelensky has argued that allowing Russian petroleum products to be sold without a lasting de-escalation agreement risks rewarding Moscow without securing meaningful concessions in return.
In a Reuters report published October 9, Zelensky described the decision as an investment in a war that should be brought to an end rather than prolonged.
Ukraine has also proposed reciprocal restraint involving attacks on energy infrastructure. Under the principle outlined by Zelensky, Ukraine would refrain from striking Russian oil refineries if Russia stopped attacking Ukrainian energy facilities.
Such a proposal highlights an alternative approach: treating energy infrastructure as part of a negotiated de-escalation framework instead of relaxing sanctions without corresponding commitments.
The broader challenge is verification. Any energy truce would need clear definitions of prohibited attacks, monitoring arrangements and consequences for violations. Without those safeguards, either side could accuse the other of exploiting restraint while continuing military operations.
The Center for Strategic and International Studies, in an analysis published September 29, examined the potential for an energy truce and the difficulty of separating de-escalation from disputes over sanctions.
For Kyiv, therefore, the issue extends beyond the immediate diesel shipments. It concerns whether economic relief for Moscow is being exchanged for concrete steps toward peace.
Can Russian Diesel Really Lower US Fuel Prices?
The agreement’s economic case depends on supply, timing, transportation costs and conditions across international fuel markets.
Diesel is particularly important because it powers much of the freight and agricultural equipment that moves goods through the US economy. Higher prices can increase operating costs for trucking companies, farms, construction businesses and other industries, potentially feeding into consumer prices.
However, additional imports do not automatically translate into a substantial reduction at the pump.
The US Energy Information Administration reports that American refineries produced approximately 1.76 billion barrels of ultra-low-sulfur distillate in 2025, while US consumption totaled approximately 1.42 billion barrels. Imports represented about 4% of consumption, and Canada supplied approximately 84% of those imports.
These figures illustrate an important distinction: the United States has considerable domestic refining capacity, but regional shortages, export demand, logistics and international prices can still influence what consumers pay.
The initial Russian shipment, if delivered as announced, could provide additional flexibility in a tight market. Yet the overall effect will depend on how much fuel is available, where it is delivered and whether the supplies add to global availability or simply redirect existing trade.
The Associated Press reported that energy experts expected the agreement to have a limited effect on overall US and global diesel prices. Their concern is that shifting supplies between buyers does not necessarily resolve the underlying shortage.
That assessment is consistent with the broader market pressures described in the International Energy Agency’s September 2026 Oil Market Report. The agency documented severe disruption to oil flows, reduced refining activity and unusually tight markets for refined fuels.
In other words, the agreement may offer some relief at the margin, but it should not be treated as a guaranteed solution to elevated fuel costs.
Why the Global Energy Crisis Matters
The diesel dispute is unfolding against a wider backdrop of geopolitical disruption.
The conflict involving the United States, Israel and Iran has affected energy supplies and shipping routes, while the Strait of Hormuz remains a critical concern for international oil trade. Reduced exports from the Middle East, alongside disruption to Russian refining operations, have tightened markets for diesel and other petroleum products.
The IEA’s September assessment described substantial declines in regional oil exports and severe pressure on refined-product availability. These conditions help explain why governments are looking for alternative sources of fuel.
But energy markets are interconnected. A shipment purchased by one country may displace another buyer, particularly when available supply is limited. The final effect depends on whether the transaction increases net supply, improves distribution or merely changes the destination of existing barrels.
The IEA’s analysis of Russia’s refining sector also describes how Ukrainian attacks on Russian refineries have contributed to lower diesel production and export availability.
This creates a difficult policy dilemma for Washington. Additional Russian exports might help ease supply constraints, but the revenue and commercial opportunities could also benefit Moscow.
What the Deal Means for Russia’s War Economy
For Russia, access to additional export opportunities could provide a commercial benefit at a time when refinery disruptions and sanctions have complicated energy sales.
The scale of that benefit remains uncertain. It will depend on the volumes actually exported, the prices received, the costs of transporting the fuel and the terms of the applicable sanctions relief.
The Center for Strategic and International Studies has examined the continuing importance of Russian fossil-fuel exports to the country’s wartime finances and the challenges Western governments face in restricting those revenues.
Sanctions do not operate in isolation. Their effectiveness depends on enforcement, access to buyers, shipping arrangements, financial channels and the availability of alternative suppliers.
A temporary license can therefore have consequences beyond the immediate shipment. It may create a precedent for further exceptions, alter market expectations or affect how allies interpret US policy toward Moscow.
At the same time, the existence of a commercial transaction does not by itself establish that a broader diplomatic settlement has been reached.
The critical questions are whether the relief is limited, whether it is reversible, and whether Russia makes any verifiable concessions in return.
A Diplomatic Test for Trump, Putin and Zelensky
The diesel agreement exposes competing priorities among the three leaders.
For Trump, the immediate argument centers on fuel availability and prices, alongside his administration’s efforts to advance negotiations. For Putin, expanded access to energy markets could offer economic opportunities and diplomatic leverage. For Zelensky, the danger is that Russia could receive financial relief while Ukraine is pressed to limit military operations without equivalent guarantees.
These objectives do not necessarily align.
A sustainable agreement would require more than an announcement of fuel shipments. It would need clarity on the sanctions framework, delivery terms, enforcement and the relationship between energy cooperation and progress toward peace.
Washington also faces an alliance-management challenge. European governments and Ukraine may question the credibility of a policy that relaxes economic pressure on Russia without measurable progress on the battlefield or at the negotiating table.
Conversely, US officials may argue that narrowly defined energy measures can help stabilize markets and create opportunities for diplomatic engagement.
The outcome will depend on whether the arrangement remains a limited commercial measure or develops into a broader shift in US policy toward Russia.
What Happens Next?
Three developments will help determine the agreement’s significance.
First, actual deliveries. Confirmation of shipment volumes, timing and destinations will establish whether the announced supplies materially affect the market.
Second, the price response. Diesel prices will continue to depend on refining capacity, inventories, transportation constraints and geopolitical risk. A short-term market reaction would not, by itself, demonstrate lasting consumer savings.
Third, diplomatic conditions. Any further sanctions relief, energy truce or progress in peace talks will indicate whether the agreement is connected to reciprocal concessions.
Until these details become clearer, claims that the deal will rapidly reduce fuel prices or transform the course of the war should be treated cautiously.
Conclusion
Trump’s Russian diesel agreement brings together two urgent policy challenges: controlling energy costs and ending the war in Ukraine.
Additional supplies could offer some flexibility to fuel markets, but the scale of any consumer benefit remains uncertain. At the same time, easing restrictions on Russian petroleum exports raises legitimate questions about sanctions enforcement, wartime revenue and the leverage available to negotiators.
For Zelensky, the central issue is whether economic cooperation with Moscow will be accompanied by meaningful de-escalation. For Washington, it is whether a short-term energy measure can deliver practical benefits without undermining its wider diplomatic objectives.
The decisive test will not be the announcement itself. It will be the volume of fuel delivered, the effect on prices and whether the arrangement produces measurable progress toward reducing the conflict.
This article is based on reporting and analysis available as of October 10, 2026. The agreement’s ultimate economic and diplomatic effects remain uncertain.
Frequently Asked Questions
1. What is the Trump–Putin diesel deal?
Trump announced an agreement for Russia to supply diesel to US and international markets, with additional shipments planned after an initial delivery. The final volumes and delivery schedule require confirmation.
2. Why is Zelensky criticizing the agreement?
Zelensky argues that easing restrictions on Russian petroleum exports without reciprocal de-escalation could increase Moscow’s revenue while prolonging its war against Ukraine.
3. Will the deal lower diesel prices in the United States?
It could add supply, but the overall impact is uncertain. Energy experts have warned that the announced volumes may be insufficient to materially lower prices across the United States or globally.
4. Does the agreement mean US sanctions against Russia have ended?
No. The reported measure involves temporary, limited sanctions relief related to Russian diesel supplies. It should not be interpreted as the end of the broader sanctions framework.
5. What should readers watch next?
The key indicators are confirmed deliveries, changes in diesel prices and inventories, the scope of sanctions relief, and any reciprocal commitments involving attacks on energy infrastructure or peace negotiations.
Discover more from The Economy
Subscribe to get the latest posts sent to your email.
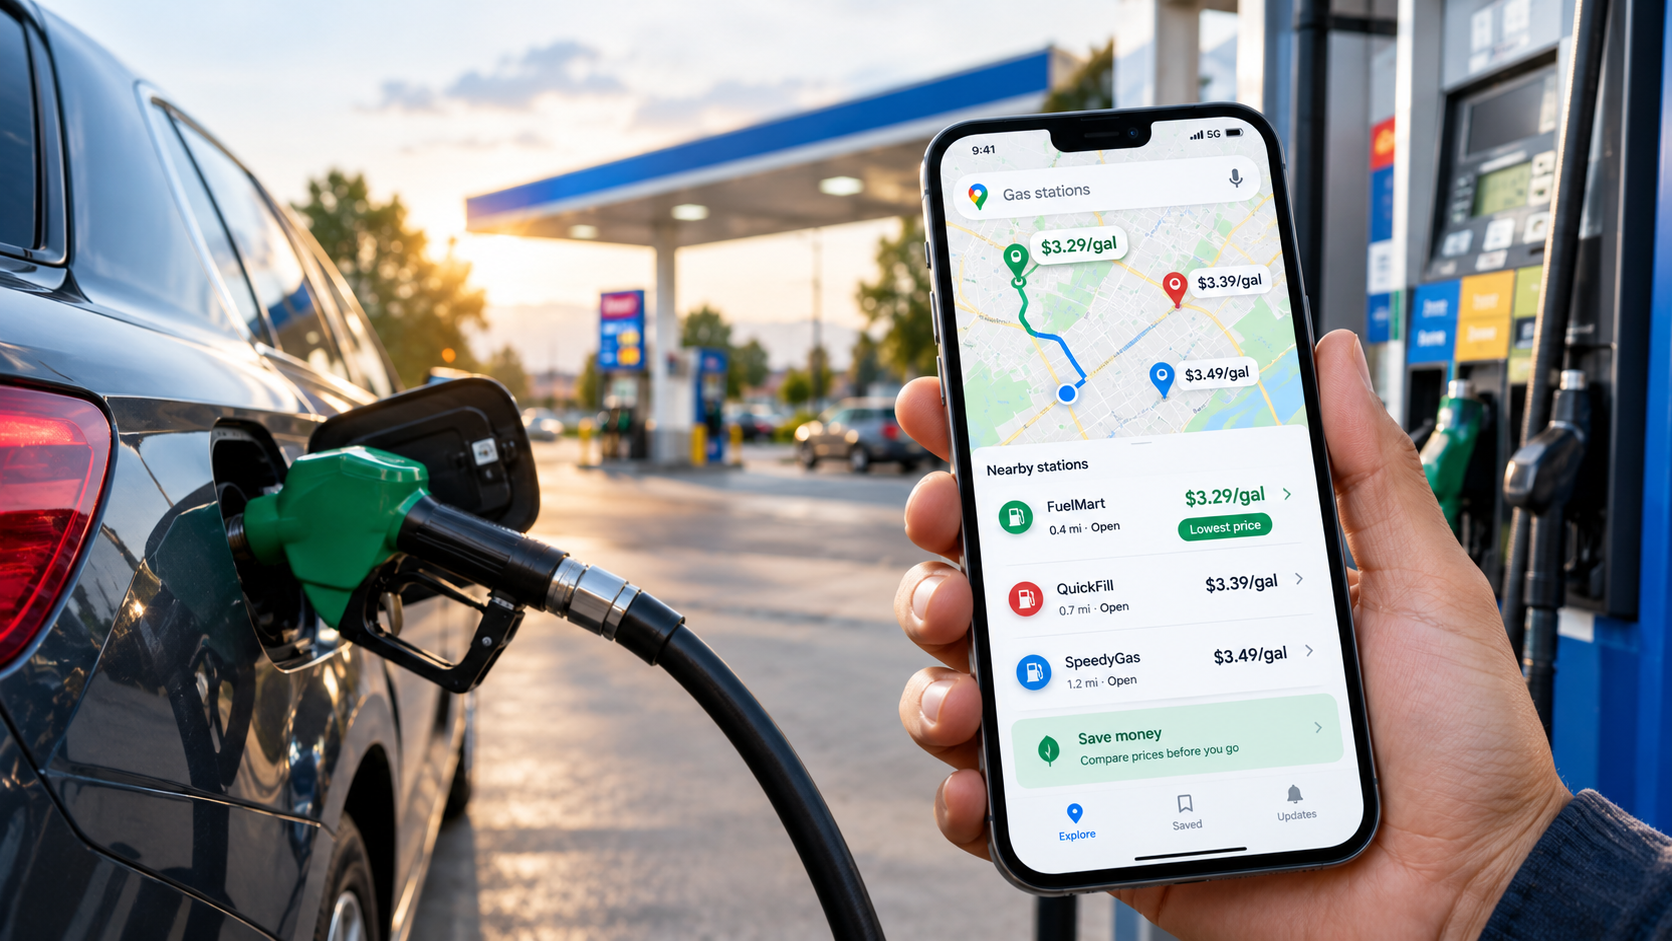
Google Maps shows gas prices at nearby stations, but its data isn’t truly real-time. Here’s how to use the feature, check accuracy, and cut fuel costs.
Key Takeaways
- Google Maps lists gas prices for nearby stations on Android, iOS, and desktop. Tap the gas option, or search “gas” in the search bar.
- Prices come from Google, not from drivers. Users cannot edit them, so accuracy depends on how quickly stations’ prices reach Google.
- Google says its fuel data is updated every 24 hours, so it cannot show the price at a pump at this moment.
- The US national average was $4.41 a gallon on October 1, 2026, according to AAA, up from $3.16 a year earlier. Savings matter more now than they did a year ago.
- Combine the map with AAA’s price tracker and the eco-friendly route setting to find cheaper fill-ups and trips.
Search Intent Summary
People searching this topic want to find the cheapest gas nearby and to know whether the prices they see are trustworthy. This guide shows how the feature works, where its data comes from, and how to use it alongside other sources.
A Note on “Real-Time” Fuel Prices
The phrase “real-time” overstates what Google Maps offers. Google’s Maps prices are shown by Google and are not user-editable. A reviewer testing the feature in 2025 found that major brands such as BP, Shell, and Speedway matched GasBuddy and the stations’ own prices, but some stations updated slowly, especially for grades other than regular, and some stations showed no prices at all.
A Google spokesperson also told a local TV station that the app’s data is updated every 24 hours. Prices can therefore lag behind what a station posts on its sign, and a price shown in the morning may be out of date by afternoon. Treat the map as a comparison tool for finding the cheaper area, then confirm the price at the pump.
How to Find Gas Prices on Your Phone
On Android and iOS, open Google Maps and tap the gas tile under the search bar. The app will show stations near you. Tap a station to see its details, including the listed price.
To look farther away, move the map to a new area and tap “Search this area.” Not every station displays a price, so you may need to scroll through the list. Tapping “View list” lets you compare several stations at once, which is faster than checking pins one by one.
If you already know which station you want, search for its name and tap its listing. The price appears in the station’s details, and you can see how far it is from your location.
How to Find Gas Prices on Desktop
On desktop, search for “gas” or “gas stations near me.” The station icons appear on the map, but prices are not always displayed next to the pins. Click a station to open its information panel, where the price is shown.
Desktop is useful for planning. If you are leaving for a trip, search the destination town or your route’s stops before you leave, so you can decide where to fill up.
Comparing Prices Without Getting Fooled
A cheap-looking price can still cost you more if the station is out of your way. Before choosing a station, check three things.
Distance matters. A five-cent saving on a station two miles away may not be worth the detour. Work out the difference on your tank size: a $0.20 gap on a 15-gallon fill-up is $3.00, which may or may not cover the extra driving.
Grade matters. Some stations show prices for regular only. Premium or diesel prices may be missing or slower to update.
Timing matters. Prices often change through the day, and stations may raise prices after a wholesale increase. Check the map in the morning, then confirm at the pump.
Cross-Check With Trusted Sources
For a reliable benchmark, check the AAA gas price tracker, which publishes daily national and state averages. On October 1, 2026, AAA reported a national average of $4.41 for regular unleaded, down about 7 cents from the previous week. September’s monthly average of $4.33 was the highest September figure on record. AAA attributed the easing to crude oil prices dipping back into the $90 range.
The Energy Information Administration publishes weekly retail gasoline prices, which are useful for tracking longer trends. A station’s price is best confirmed at the station itself, but these sources tell you whether the price you are seeing is high or low for your area.
Crowd-sourced apps such as GasBuddy can add station-level detail, but their data is user-submitted, so compare it against Google Maps and the station’s sign.
Use the Eco Route to Cut Fuel Use
Fuel costs depend on how much you burn, not just what you pay per gallon. Google Maps offers an eco-friendly route option that favors more fuel-efficient driving. The eco option is on by default for many users, so check that it is still enabled before you plan a trip.
Google has said that a fuel-efficient route typically adds one to two minutes to a trip and can save five to ten percent on gas. The savings depend on traffic, road type, and the vehicle, so treat the figure as an estimate.
A simple example shows the scale. Suppose a 300-mile trip in a car that gets 25 miles per gallon. That uses 12 gallons, or about $53 at $4.41 a gallon. A 5 to 10 percent saving is roughly $2.65 to $5.30. Those are hypothetical numbers, but they show that a short detour and a route change can add up across a year of driving.
Practical Strategy for Saving on Gas
Start with the map to find the cheapest station in your area. Confirm the price with the station’s sign before filling up, since the map can lag behind changes.
Compare prices in clusters rather than single stations. If several stations near a highway interchange charge less than the rest, that is a stronger signal than one outlier.
Use the eco route on longer trips, and avoid detours that cost more in fuel than they save at the pump. For a regular commute, the cheapest station on your route is often the best choice.
Keep an eye on the AAA and EIA averages. If your local price is well above the national average, you may be able to save by filling up at a station in a different city or zone.
Future Outlook
Gas prices are tied to crude oil, and crude is tied to the conflict affecting shipping routes in the Middle East. Prices have risen sharply this year, and they have also eased at times. The most useful habit is checking prices regularly rather than waiting for a spike to appear, since station prices can move quickly in both directions.
Frequently Asked Questions
Is Google Maps gas price data real-time?
No. Google says its fuel data is updated every 24 hours, and some stations’ prices update more slowly than others. Use the map to compare nearby options, then confirm the price at the station.
Why do some gas stations not show prices on Google Maps?
Not every station displays a price. Stations may not share prices with Google, or the data may be missing for certain fuel grades. Check the station directly or use a second source.
Can I edit a gas station’s price on Google Maps?
No. Prices on Google Maps are controlled by Google and cannot be edited by users. If a price looks wrong, the station’s posted price at the pump is the most reliable source.
Does the eco route really save gas?
Google says an eco route can save five to ten percent on fuel with a small extra travel time. Actual savings depend on traffic, road conditions, and your vehicle. It is a useful default, but it is not a guarantee.
Discover more from The Economy
Subscribe to get the latest posts sent to your email.

Anthropic Bans Sustained Abuse of Claude AI Under New Usage Policy Effective November 12, 2026

Jeff Bezos Three-Day Workweek View: What He Really Said

Celeste Frozen Pizza Discontinued: What Conagra Confirmed

US–China Critical Minerals Competition: Why a Trade Deal Cannot Fix Every Supply Risk

Oil Price Outlook 2026: How Supply Risks Reach Fuel Bills, Inflation and Business Costs

AI in Business 2026: Why Faster Employees Do Not Automatically Mean Higher Profits

Mortgage Rates in 2026: Why They Remain High and How to Compare the True Cost

Gold Price Outlook 2026: The Forces Behind the Forecasts—and What Could Reverse Them

Global Economic Outlook 2026: Growth, Inflation and Risks

Trump–Putin Diesel Deal: Why Zelensky Is Angry and What It Means for Fuel Prices

Anthropic Draws the Line: Why Claude’s New Usage Policy Explicitly Bans ‘Cruel Behavior’ Toward AI

Ynon Kreiz & Mattel’s Digital Transformation: Franchise Strategy and Financial Growth

Crude Oil & Petroleum Market Analysis: OPEC+ Decisions and Price Forecasts

Top US Convenience Store Chains: Store Counts, EV Charging, and Sales Trends

Oil Prices Break $100 in 2026: Middle East Conflict & Energy Markets

Middle East War Economics 2026: Oil Prices & Energy Markets

China Stocks Today: Are Big Economies in Asia Nearing a Market Bottom?

PSX Forecast 2026: KSE-100, IMF Reviews & Geopolitics

Crypto Daily Outlook: Bitcoin, Altcoins, and the Future of Decentralized Finance

Global Pension Systems Ranked: The World’s Best and Worst Retirement Frameworks

Enterprise AI Platforms Disrupting B2B SaaS in 2026: Full Analysis

World’s Largest Economies: Ranking the Top Global Powers

Elon Musk’s Next Moves: Disrupting the 2026 Global Economy

Pakistan Economy 2026: Inside the SBP’s Balancing Act

GasBuddy Market Insights: How Crude Price Shifts Impact Local Fuel Cost Averages

World Bank & IMF Reports 2026: Why the “3% Growth” Consensus Is Actually a Debate

Global Equity Market Divergence: US Tech vs. European Dividend Stocks vs. Asian Growth

Stock Market Today: Dow Climbs 500 Points as Markets Shake Off Inflation Jitters
-

 Markets & Finance9 months ago
Top 15 Stocks for Investment in 2026 in PSX: Your Complete Guide to Pakistan’s Best Investment Opportunities
-

 Analysis8 months ago
Johor’s Investment Boom: The Hidden Costs Behind Malaysia’s Most Ambitious Economic Surge
-

 Analysis8 months ago
Top 10 Stocks for Investment in PSX for Quick Returns in 2026
-

 Banks9 months ago
Best Investments in Pakistan 2026: Top 10 Low-Price Shares and Long-Term Picks for the PSX
-

 Analysis8 months ago
Brazil’s Rare Earth Race: US, EU, and China Compete for Critical Minerals as Tensions Rise
-

 Investment9 months ago
Top 10 Mutual Fund Managers in Pakistan for Investment in 2026: A Comprehensive Guide for Optimal Returns
-

 Global Economy10 months ago
15 Most Lucrative Sectors for Investment in Pakistan: A 2025 Data-Driven Analysis
-

 Global Economy10 months ago
Pakistan’s Export Goldmine: 10 Game-Changing Markets Where Pakistani Businesses Are Winning Big in 2025