
Markets & Finance
GasBuddy Market Insights: How Crude Price Shifts Impact Local Fuel Cost Averages


GasBuddy forecast sub-$3 gas for 2026. The national average is $4.33. Inside the forecast that broke, and what drivers should expect through Q4.
Executive Summary / Key Takeaways
- The US national average for regular gasoline was $4.329 per gallon on 15 September 2026 — up from $4.07 a week earlier, $3.85 a month earlier and $3.14 a year earlier.
- GasBuddy’s annual outlook, published before the Middle East conflict, projected a 2026 national average of $2.97 — the first sub-$3 year since the pandemic — and a December average of $2.83.
- The gap between forecast and reality is roughly $1.35 a gallon, and the cause is entirely geopolitical.
- Houthi attacks shut a crucial Saudi crude pipeline bypassing the Strait of Hormuz in September 2026; WTI has traded near $102–103 and Brent near $107.
- AAA reports prices inching toward the year’s record high of $4.56, set on 21 May 2026.
1. Introduction & Immediate Context
In late 2025, GasBuddy published one of the more confident fuel forecasts in recent memory. The national average would fall to $2.97 in 2026, the first sub-$3 year since the pandemic and roughly 13 cents below the 2025 average, marking a fourth straight year of decline. Prices would peak in spring in the low $3.20 range as refiners switched to summer blends, then ease to an average of $2.83 in December. Diesel would average $3.55, down from $3.62. US drivers would spend $11 billion less on gasoline than in 2025, with the average household paying about $2,083 for the year.
Patrick De Haan, GasBuddy’s head of petroleum analysis, summarised it at the time: it was not a return to ultra-cheap fuel, but for the first time in a long while the wind was clearly behind drivers’ backs.
Nine months later, the national average is $4.329 per gallon, per AAA data compiled on 15 September 2026. Understanding why that forecast failed is more useful to commuters and logistics managers than any point prediction about the fourth quarter.
2. Core Market Analysis
2.1 Forecast versus outcome
| Metric | GasBuddy 2026 forecast | Actual (Sept 2026) | Gap |
|---|---|---|---|
| National average, regular | $2.97/gal (annual) | $4.329/gal (15 Sep) | +$1.36 |
| Spring peak | Low $3.20s | $4.56 record (21 May) | +$1.36 |
| December projection | $2.83/gal | — | Pending |
| Diesel average | $3.55/gal | — | Pending |
| Household annual spend | ~$2,083 | Materially higher | — |
2.2 What actually moved
Crude is the largest single cost in a gallon of gasoline, so pump prices generally track WTI and Brent with a one-to-two week lag. WTI has been trading near $103.30 and Brent near $107.56, per market data compiled alongside AAA averages.
The proximate trigger was infrastructure, not demand. Attacks by Iran-backed Houthi rebels shut down a crucial crude pipeline in Saudi Arabia that bypasses the Strait of Hormuz, according to Trading Economics market reporting. Saudi Arabia has indicated it could restore around half of the damaged East-West pipeline’s capacity within days and resume full operations within six weeks, while offering additional cargoes through ship-to-ship transfers near Oman.
US gasoline futures have held above $3.45 a gallon, close to their highest level in eight weeks. Gasoline itself fell to $3.46 on 18 September, down 1.22% on the day, but is up 6.43% over the past month and up 76.03% compared with the same time last year.
2.3 The domestic supply picture is not the problem
This is the part most local coverage gets backwards. EIA data showed US gasoline inventories unexpectedly rising for a second consecutive week, increasing by 800,000 barrels in the week ending 11 September, as refineries continued operating at elevated capacity — 96.8%, slightly lower than prior weeks — while delaying non-essential work. Demand rose by 300,000 barrels per day even as pump prices climbed.
Inventories building while prices rise is the signature of a crude-cost-driven move rather than a domestic shortage. The forward risk is maintenance: approaching seasonal fall refinery work remains a threat to refined-product supplies, and refiners have been deferring non-essential work to keep runs high. Deferred maintenance is borrowed capacity, and it gets repaid in October and November.
Earlier in the month, AAA reported that the Labor Day weekend set a record at the pump, with the national average at $4.14 — the first time it has exceeded $4 on Labor Day, against a previous record of $3.82 set in 2012. Gasoline demand had decreased from 9.04 to 8.92 million barrels per day, and crude inventories at 424.5 million barrels sat 1% above the five-year average. Prices rose anyway.
3. Structural Drivers and Competitor Gaps
Why state-level dispersion is widening. California’s regular gasoline reached $6.001 per gallon against Indiana at $3.586 — a spread of nearly $2.42. The drivers are the nation’s highest state gas taxes, a unique cleaner-burning CARB fuel blend that few refineries produce, and limited pipeline supply that isolates the state’s market. The top ten most expensive markets as reported by AAA were California ($6.08), Washington ($5.57), Hawaii ($5.48), Nevada ($5.19), Oregon ($5.11), Alaska ($5.07), Idaho ($4.85), Utah ($4.81), Illinois ($4.78) and Michigan ($4.75).
Crude shocks amplify dispersion rather than distributing evenly. Markets with constrained refining and unique blend requirements have the least ability to substitute supply, so the same $10 crude move produces a larger pump-price move in an isolated market than in a well-supplied one. Price-comparison apps deliver the most savings precisely in these markets, because station-level variance rises alongside regional variance.
What a forecast can and cannot do. GasBuddy’s outlook explicitly listed seasonal demand, refinery maintenance, hurricane season and geopolitical tensions as sources of fluctuation. The failure was not the analysis of the fundamentals — easing global economic pressure and added refining capacity were real — but that a supply-route disruption of this scale sits outside any statistical distribution built on normal conditions. Consumers reading annual fuel forecasts should treat them as conditional on geopolitical stability, not as point estimates.
The EV comparison held steady. The national average per kilowatt hour at a public EV charging station stayed at 42 cents through the period, unchanged week over week. When liquid fuel moves 76% year-on-year and electricity does not, the relative operating-cost calculation for fleet operators shifts materially — a second-order effect that will show up in 2027 procurement decisions.
4. Key Implications for Stakeholders
Daily commuters. The practical saving available from station-level price comparison rises with regional dispersion, and dispersion is currently near its widest. In high-variance markets the difference between the cheapest and most expensive station on a routine route can exceed 25 cents a gallon.
Logistics managers. Diesel was forecast at $3.55 for 2026 on pre-conflict assumptions. Any fuel-surcharge schedule or freight contract built on that number needs revisiting. The relevant forward risk through Q4 is deferred refinery maintenance, not crude.
Retail traders. Inventories rising while prices rise is a clean signal that the move is imported from crude rather than generated domestically. Watch Saudi East-West pipeline restoration progress — a six-week full-restoration timeline, if met, is the most likely source of relief.
Household budgeters. At $4.33 against a $3.14 average a year ago, the annual household fuel bill is running far above the roughly $2,083 projected. Budgets set in January on the sub-$3 forecast are materially understated.
5. Frequently Asked Questions
Q1: What is the national average gas price right now?
The US average for regular gasoline was $4.329 per gallon on 15 September 2026, up from $4.07 a week earlier and $3.14 a year earlier, according to AAA data.
Q2: Why did GasBuddy’s 2026 forecast miss?
The forecast of $2.97 per gallon was built on easing global economic pressure and expanded refining capacity, before Middle East conflict and attacks on a key Saudi pipeline bypassing the Strait of Hormuz pushed crude above $100 a barrel.
Q3: Why is California gas so much more expensive?
California combines the nation’s highest state gas taxes, a unique CARB cleaner-burning blend that few refineries produce, and limited pipeline access that isolates its market — currently producing a regular price near $6.00 against Indiana’s $3.59.
Q4: Will gas prices fall in late 2026?
That depends primarily on Saudi pipeline restoration, which the kingdom indicated could reach full capacity within six weeks. The countervailing risk is deferred seasonal refinery maintenance, which refiners have been postponing to keep runs near 97%.
Discover more from The Economy
Subscribe to get the latest posts sent to your email.



S&P 500 at 7,620, FTSE at 10,698, Nikkei at 64,136. Compare US tech, European dividends and Asian growth as three central banks split on rates.
Executive Summary / Key Takeaways
- The three major regions are now priced off three different monetary regimes: the Fed hiking into strength, the ECB hiking into weakness, and the Bank of Japan normalising from near zero.
- On the day of the Fed’s hike, the Dow fell more than 600 points while the Nasdaq finished close to flat — a clean demonstration that “US equities” is no longer a single exposure.
- European indices held up: the FTSE 100 sat at 10,697.57 (+0.44%) while the DAX at 25,440.81 and Euro Stoxx 50 at 6,260.38 slipped.
- Japan outperformed on currency mechanics, with the Nikkei at 64,136 and the Topix at 4,094.
- Yardeni Research cut its year-end S&P 500 target to 7,900 from 8,400, citing yield pressure from rising energy prices.
Regional equity allocation has spent a decade being a low-conviction decision. Global indices moved together, US technology led, and everything else was a funding source. September 2026 broke that pattern within a single trading week.
The trigger was monetary divergence. The Federal Reserve raised rates to 3.75%–4.00% on 16 September. The ECB had already lifted its deposit rate to 2.5% on 10 September. The Bank of England held at 3.75% on a 6-3 split on 17 September, and the Bank of Japan is expected to hike on 18 September.
Four decisions, four different directions of travel, four different equity responses. That is the environment retail investors and portfolio managers now have to allocate into.
2. Core Market Analysis
2.1 The comparison matrix
| Region / Index | Level | Move | Monetary regime | Primary source |
|---|---|---|---|---|
| S&P 500 (US) | 7,619.98 | -0.48% | Fed tightening; ≥1 more hike signalled | Yahoo Finance |
| Nasdaq Composite (US) | 26,186.41 | -0.56% | Duration-sensitive; held up on Fed day | Yahoo Finance |
| Dow Jones (US) | 52,421.20 | -0.29% | Fell 600+ pts on the hike itself | Yahoo Finance |
| FTSE 100 (UK) | 10,697.57 | +0.44% | BoE on hold at 3.75% | Yahoo Finance |
| DAX (Germany) | 25,440.81 | -0.50% | ECB at 2.5% deposit rate | Yahoo Finance |
| CAC 40 (France) | 8,117.78 | -0.76% | ECB at 2.5% deposit rate | Yahoo Finance |
| Euro Stoxx 50 | 6,260.38 | -1.02% | Weakest major European print | Yahoo Finance |
| Nikkei 225 (Japan) | 64,136 | +0.33% | BoJ normalising; weak yen tailwind | Trading Economics |
| Hang Seng (HK) | 24,713 | +0.2% | Pegged; HKMA hiked to 4.25% | Trading Economics |
| VIX | 17.10 | +7.95% | Volatility bid but not stressed | Yahoo Finance |
2.2 US: the index is not the market
The single most revealing datapoint of the week was the internal dispersion on Fed day. Stocks turned lower during Warsh’s press conference as markets read his remarks as hawkish, with the Dow leading losses down more than 700 points at one stage — over 1.6% — while the S&P 500 declined 0.4% and the Nasdaq slid just below flat, Yahoo Finance reported.
Conventional rate logic says long-duration growth should suffer most when yields rise. It did not. The cyclical, energy-exposed and rate-sensitive parts of the market took the damage instead: J.B. Hunt Transport fell 12.64% after warning on earnings and rising operating costs, Diamondback Energy dropped 8% amid concerns over inflation, rising Treasury yields and crude-market geopolitical risk, and APA Corp fell 5.2%, according to TheStreet’s market coverage. Optical and photonics names rebounded, with Coherent and Lumentum each up around 6%.
The forward view has been trimmed. Yardeni Research cut its year-end S&P 500 target to 7,900 from 8,400 — implying 4.1% upside from Tuesday’s close of 7,585.73 rather than the 11% its previous estimate implied — citing higher Treasury yields due to rising energy prices and increased downturn risk over the next three to six months, CNBC reported.
2.3 Europe: the dividend case
European equities are not outperforming on growth. Euro-area output is projected around 1.3% for 2026 by the IMF, with the region benefiting less than others from the technology-driven investment boost and lingering energy-price effects still dragging on manufacturing.
They are outperforming, where they are, on payout and valuation. With the ECB deposit rate at 2.5% — the loosest of the major blocs — the yield competition from cash and short-dated bonds is materially weaker in Europe than in the US, where the funds rate is now 3.75%–4.00% and the 10-year has topped 5%. That relative-yield arithmetic is the structural argument for European income equity in this cycle, and it holds regardless of European growth being mediocre.
The UK sits awkwardly between the two. The FTSE’s commodity and energy weighting makes it a partial beneficiary of the same oil shock hurting importers elsewhere, which explains its positive print against a broadly weaker European tape.
2.4 Asia: growth with a currency asterisk
Japan’s advance came from yen weakness after the Fed decision, which improved the earnings outlook for export-focused industries, Trading Economics noted. Hong Kong’s caution came from the HKMA following the Fed with a hike to 4.25%, pressuring property.
The regional growth case is real — East Asia and Pacific is projected at 4.2% for 2026 and South Asia at 6.3% by the World Bank — but a meaningful share of recent Japanese equity return has been a currency effect that BoJ normalisation will erode.
3. Structural Drivers and Competitor Gaps
The gap in most comparative coverage is treating this as a regional rotation call. It is better understood as three separate factor exposures that happen to have geographic labels:
- US large-cap technology is a duration and AI-capex exposure. It held up on Fed day because the AI investment cycle is currently a stronger driver than the discount rate. Both the IMF and World Bank cite broader AI adoption as the principal upside risk to global growth. If that capex cycle cools, the rate sensitivity reasserts itself immediately.
- European income equity is a relative-yield exposure. Its attractiveness is a function of the ECB-Fed policy gap, not of European fundamentals. Narrow the gap and the case weakens.
- Asian growth equity is partly a currency exposure. Particularly in Japan, where the return decomposition between earnings and FX is doing more work than most allocators acknowledge.
Correctly labelled, these are not substitutes for one another. The diversification benefit of holding all three is higher in 2026 than at any point in the past decade — which is the practical conclusion most aggregator coverage fails to reach.
4. Key Implications for Stakeholders
Retail investors. A global index fund currently buys you a heavy weighting to a single factor: US technology and its AI capital-expenditure cycle. If that is the intended exposure, fine. If not, deliberate regional allocation is required to get it.
Portfolio managers. Volatility is bid but not stressed, with the VIX at 17.10 — an unusually calm reading given four central bank decisions in eight days and crude above $100. That combination favours adding hedges while they remain inexpensive rather than after a repricing.
Income investors. The yield hurdle is regional now. In the US, equity income competes against a 10-year above 5%. In the euro area, it competes against a 2.5% deposit rate. The same dividend yield is a materially better proposition in one market than the other.
Risk teams. Cross-regional correlation assumptions built on the 2015–2021 regime are stale. Three distinct monetary cycles produce genuinely differentiated drawdown paths.
5. Frequently Asked Questions
Q1: Why did the Nasdaq hold up while the Dow fell after the Fed hike?
The damage concentrated in cyclical, transport and energy-exposed names rather than long-duration technology. Investors are currently treating the AI capital-expenditure cycle as a stronger earnings driver than the discount rate is a valuation headwind.
Q2: Are European dividend stocks more attractive than US equities now?
On relative yield, arguably. The ECB deposit rate is 2.5% against a US funds rate of 3.75%–4.00% and a 10-year Treasury above 5%, so European equity income faces far weaker competition from cash and bonds. European growth, however, remains around 1.3%.
Q3: What is the current S&P 500 level and forecast?
The S&P 500 was at 7,619.98. Yardeni Research cut its year-end target to 7,900 from 8,400, implying roughly 4% upside, citing higher Treasury yields driven by rising energy prices.
Q4: Which region offers the best equity growth in 2026?
Asia on headline growth — East Asia and Pacific at 4.2% and South Asia at 6.3% per World Bank forecasts. But a meaningful share of recent Japanese equity returns reflects yen weakness rather than earnings, and Bank of Japan normalisation erodes that tailwind.
Discover more from The Economy
Subscribe to get the latest posts sent to your email.
Markets & Finance
Asian Markets Analysis: Navigating Volatility in China, Japan, and Singapore Stocks

Nikkei at 64,136, Hang Seng at 24,713, HKMA hikes to 4.25%. Inside Asia’s split response to the Fed and where regional equity risk sits now.
Executive Summary / Key Takeaways
- The Nikkei 225 climbed 0.33% to 64,136 on Thursday 17 September, extending gains after the Fed’s hike, with the Topix up 0.8% to 4,094.
- Hong Kong’s Hang Seng closed at 24,713 on Wednesday, up 0.2%, but the Hong Kong Monetary Authority immediately followed the Fed by raising its base rate 25 basis points to 4.25%.
- The Shanghai Composite sits near 3,880 — a different market with a different driver, less exposed to US rate transmission than Hong Kong.
- Japan’s gain and Hong Kong’s caution come from the same event: a weaker yen helps Japanese exporters, while Hong Kong’s currency peg imports US tightening directly into property funding costs.
- The Bank of Japan’s decision on 18 September is the region’s next binary risk.
1. Introduction & Immediate Context
Asia did not react to the Federal Reserve as a bloc this week. It reacted as three distinct monetary regimes, and the dispersion is instructive for anyone running regional equity exposure.
Japanese equities rose. The Nikkei 225 climbed 0.33% to close at 64,136 while the broader Topix advanced 0.8% to 4,094 on Thursday, extending gains from the previous session after the US Federal Reserve delivered a widely expected rate hike, even as it signalled further tightening, Trading Economics reported. The mechanism was currency: the yen weakened against the dollar following the Fed’s decision, improving the earnings outlook for Japan’s export-focused industries.
Hong Kong was more cautious. The market remained wary after the Fed raised rates and signalled the possibility of another hike, strengthening the dollar and pushing Treasury yields higher, according to Trading Economics. The HKMA raised its base rate by 25 basis points to 4.25% following the Fed’s move, weighing on Hong Kong property stocks as higher borrowing costs threatened recovery.
Same catalyst. Opposite outcomes.
2. Core Market Analysis
2.1 Regional index snapshot
| Index | Level | Recent move | Key domestic driver | Source |
|---|---|---|---|---|
| Nikkei 225 (Japan) | 64,136 | +0.33% (17 Sep) | Weaker yen; BoJ decision 18 Sep | Trading Economics |
| Topix (Japan) | 4,094 | +0.8% (17 Sep) | Broad-based exporter strength | Trading Economics |
| Hang Seng (Hong Kong) | 24,713 | +0.2% (16 Sep close) | HKMA rate hike to 4.25% | Trading Economics |
| Shanghai Composite (China) | ~3,880 | -0.13% | Domestic policy, not Fed transmission | Yahoo Finance |
| Shenzhen Component | ~13,361 | -0.17% | Tech and manufacturing weighting | Yahoo Finance |
2.2 Japan: the carry-trade pivot
Japan’s rally has an expiry date attached to it. Japanese ultra-low rates helped finance trillions of dollars in global investments for more than a decade, making the yen one of the world’s cheapest sources of funding — and with the Bank of Japan expected to tighten again this week, that advantage may be entering a new phase, FXStreet noted. Markets widely expect a quarter-point increase to 1.25%.
The Nikkei’s strength this week is therefore borrowed against a currency effect that the BoJ may partially reverse within 24 hours. Gains on Thursday were broad-based, with notable performances from index heavyweights including SoftBank Group, Fujikura, Lasertec, Mitsubishi Heavy Industries and Nintendo. Wednesday’s session had already seen the index climb 0.69% to 63,923 as easing oil prices reduced pressure on equities — relevant for an economy that imports nearly all of its crude.
Japanese equities also benefited from declining oil prices amid expectations that crude flows through Saudi Arabia’s East-West pipeline could resume soon.
2.3 Hong Kong: the peg is the problem
Hong Kong’s dollar peg means the HKMA has no independent rate-setting discretion. When the Fed hikes, Hong Kong hikes — which transmits US monetary policy directly into a property market that has been trying to stabilise for several years.
The equity response was not uniform, however. Technology stocks provided support, with the Hang Seng Tech Index rising 0.9% by midday in the prior session. Zhipu AI surged more than 8%, ending an 11-session losing streak, while MiniMax, SMIC and Hua Hong Semiconductor gained between 5% and 7%. Against that, Xiaomi, Kuaishou and Akeso declined. On Thursday the pattern reversed for large caps: Tencent fell 1.7%, Kingboard Laminates 1.9% and HKEX 1.8%, while Z.AI Co. rose 2.9%, MiniMax 7.1% and Genscript Biotech 14.3%.
CICC has argued that Hong Kong stocks could face greater volatility from renewed US monetary tightening, though the impact should be short-lived unless the Fed begins a sustained rate-increase cycle. Given the dot plot now points to at least one more hike, that caveat is doing considerable work.
3. Structural Drivers and Competitor Gaps
Most regional market write-ups treat “Asian markets” as a single sentiment block. The 2026 reality is a three-regime structure that produces genuinely uncorrelated outcomes:
Regime one — pegged (Hong Kong). Zero monetary autonomy. US rates arrive unfiltered. Property and financials bear the adjustment; technology can decouple on idiosyncratic news flow, as the AI names did this week.
Regime two — normalising (Japan). The BoJ is tightening from a near-zero base for domestic reasons while the Fed tightens for inflation reasons. The interest-rate differential still favours a weak yen, which supports exporters — but each BoJ step narrows that support, and the carry-trade unwind exports volatility into global bond markets rather than into the Nikkei directly.
Regime three — domestically driven (mainland China). The Shanghai and Shenzhen indices moved marginally on the Fed decision. Beijing’s policy cycle, not Washington’s, sets the tone.
The competitor gap worth exploiting is the assumption that a stronger dollar is uniformly negative for Asian equities. It is negative for pegged and dollar-funded markets; it is currently positive for Japanese exporter earnings; and it is close to neutral for onshore China. Capital-flow data, not index correlation, is where the distinction shows.
There is also a structural investment story running underneath the rate noise. Reports highlighted potential financing of around US$2.6 billion for Hong Kong data-centre development, reflecting growing investment in the city’s digital infrastructure. Regional AI and data-centre capex remains the counterweight to monetary tightening across Singapore, Malaysia, Japan and Hong Kong alike.
4. Key Implications for Stakeholders
International equity traders. The Hang Seng’s sensitivity to Fed pricing makes it the cleanest regional expression of a US rate view. If the December hike is delivered, the HKMA follows mechanically and property funding costs rise again.
Wealth managers with Japan exposure. Decide whether your Japanese allocation is a currency trade or an equity trade. Much of the 2026 Nikkei performance has been the former. A BoJ normalisation path that narrows the differential changes the return profile even if Japanese corporate earnings hold.
Singapore-focused allocators. Singapore’s market has been supported through 2026 by AI-linked capital expenditure and semiconductor demand rather than by rate expectations. That makes it the region’s most attractive defensive-growth blend — but also the most exposed if the global technology capex cycle cools, which both the IMF and World Bank flag as the principal downside risk to their outlooks.
Risk managers. The three-regime structure argues for separate regional sleeves rather than a single Asia ex-Japan mandate. Correlation assumptions built on the 2015–2021 period no longer describe this market.
5. Frequently Asked Questions
Q1: How did Asian markets react to the September 2026 Fed rate hike?
Unevenly. Japan’s Nikkei rose 0.33% to 64,136 as a weaker yen helped exporters, while Hong Kong stayed cautious after the HKMA followed the Fed with a 25-basis-point rise to 4.25%, pressuring property stocks. Mainland Chinese indices moved only marginally.
Q2: Why did the Hong Kong Monetary Authority raise rates?
The Hong Kong dollar’s peg to the US dollar removes independent rate-setting discretion, so the HKMA moves in step with the Federal Reserve. Its base rate rose to 4.25% immediately after the Fed’s September decision.
Q3: What is the Nikkei 225 level now?
The Nikkei 225 closed at 64,136 on 17 September 2026, up 0.33%, with the Topix at 4,094. The index has been supported by yen weakness and easing oil prices.
Q4: What is the biggest near-term risk to Asian equities?
The Bank of Japan’s decision on 18 September and the potential unwinding of the yen carry trade, which has already contributed to higher long-dated yields in the US and Europe.
Discover more from The Economy
Subscribe to get the latest posts sent to your email.
Key Takeaways
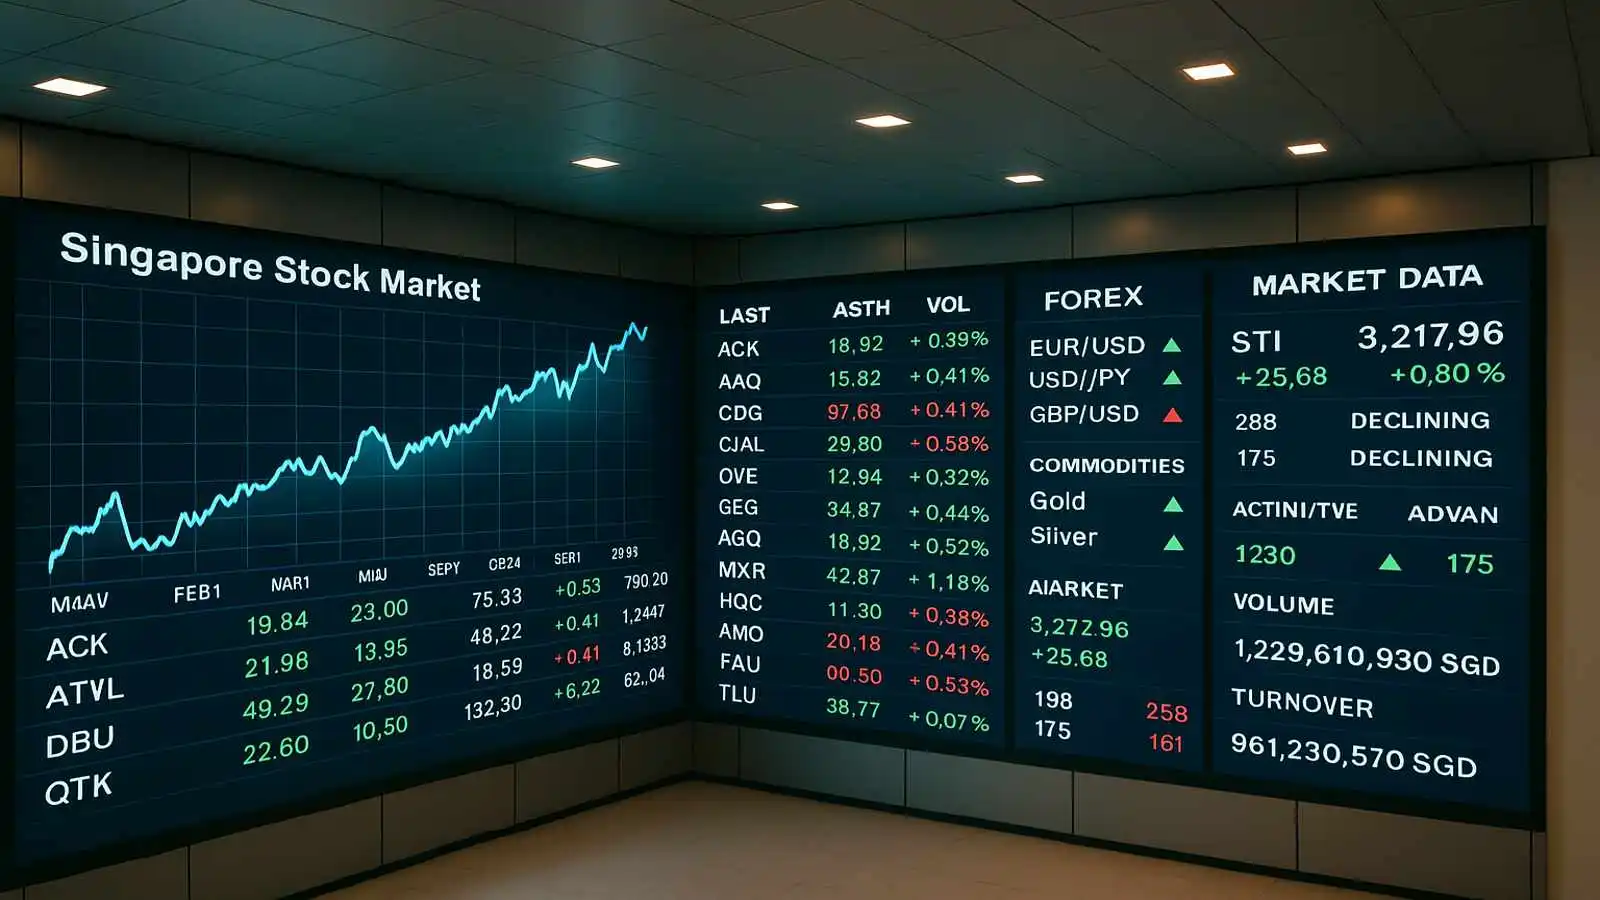
- The Straits Times Index (STI) has set repeated all-time highs through 2026 — from around 4,900 in January to a record 5,801.96 on September 4, 2026, a roughly 35% year-over-year gain.
- Banking heavyweights DBS, OCBC, and UOB have powered most of the rally, with DBS posting record Q2 2026 net profit of S$3.08 billion (up 9% year-over-year) on total income that crossed S$6 billion for the first time in a single quarter.
- SGX’s FY2026 results (July 2025–June 2026) show securities turnover up 35% year-over-year to S$455.7 billion, with retail investors net buyers of Singapore equities for five consecutive months.
- Analysts increasingly describe Singapore equities’ rally as driven by genuine “safe-haven” demand — investors rotating into the market specifically for its perceived stability amid regional and geopolitical uncertainty, not just cheap valuations.
- The risk flagged by several local commentators: a record-high market concentrated heavily in one sector (banks) raises the cost of over-allocating to what’s already led the run.
The STI’s 2026 Climb, Month by Month
| Date | STI Level | Context |
|---|---|---|
| Jan 30, 2026 | 4,934 (record) | Broad economic optimism, 4.8% 2025 GDP growth |
| Apr 9, 2026 | 5,000 (crossed) | First time above the 5,000 mark |
| May 22, 2026 | 5,068.15 | Banking and industrial stocks lead |
| Jun 25, 2026 | 5,218.96 | SGX FY2026 turnover surge |
| Jul 8, 2026 | 5,339.59 (intraday) | Institutional inflows accelerate |
| Jul 15, 2026 | 5,559.72 (record close) | Continued rally |
| Sep 4, 2026 | 5,801.96 (record close) | ~35% gain over trailing year |
Why Singapore Keeps Attracting “Safe Haven” Flows
Unlike a pure valuation story, Singapore’s 2026 rally has been repeatedly described by market commentators as safe-haven driven — investors specifically seeking Singapore’s institutional stability, currency credibility, and banking-sector strength during a year marked by Middle East conflict, tariff shocks, and volatile crypto and U.S. equity markets. The Monetary Authority of Singapore’s S$6.5 billion expansion of its Equity Development Programme (EQDP) has also directly funneled institutional capital into local equities.
The Bank Trio Driving the Rally
- DBS Group — Singapore’s largest bank, with a footprint across 19 markets. Q2 2026 total income crossed S$6 billion for the first time in a single quarter; net profit hit a record S$3.08 billion, up 9% year-over-year, even as net interest income slipped slightly.
- OCBC and UOB — Both have repeatedly led single-session STI gains alongside DBS, reinforcing the narrative that Singapore’s rally is fundamentally a banking-sector story with industrials and REITs participating at the margins.
The Case for Caution at Record Highs
Local commentary has been notably measured rather than euphoric: markets sit at all-time highs roughly a third of the time historically, and forward returns after a new high haven’t been meaningfully worse than at other times. The more practical risk flagged: a sharp rally can quietly shift a portfolio’s asset allocation (e.g., from a 70/30 equity/bond split to 80/20) without any active decision — a case for periodic rebalancing rather than either chasing or avoiding the rally outright.
Why are Singapore stocks considered a safe haven in 2026?
The Straits Times Index has hit repeated record highs in 2026 (reaching 5,801.96 by September), driven largely by record bank earnings from DBS, OCBC, and UOB. Analysts attribute much of the rally to genuine safe-haven demand from investors seeking institutional stability amid global geopolitical and market volatility, rather than valuation alone.
Discover more from The Economy
Subscribe to get the latest posts sent to your email.

GasBuddy Market Insights: How Crude Price Shifts Impact Local Fuel Cost Averages

DoorDash Driver Payouts, Fee Structures, and Market Competition Analysis

OPINION:Breaking the 3.5% Growth Trap: How Pakistan Can Build a High-Productivity Export Economy

Global Equity Market Divergence: US Tech vs. European Dividend Stocks vs. Asian Growth

Asian Markets Analysis: Navigating Volatility in China, Japan, and Singapore Stocks

Stagflation vs. Soft Landing: How Central Bank Rates Are Reshaping European and Asian Economies

IMF & World Bank Global Economic Outlook: Growth Forecasts Across Europe and Asia

Fed Rate Hike Projections vs. Trump’s Interest Rate Policy: What Global Markets Expect Next

Singapore Stocks: The Ultimate Safe Haven for Markets and Finance in 2026?

Marie Gluesenkamp Perez: How a Former Shop Owner’s Moderate Politics Are Shaping Tech and Economy Bills

The Future of Silicon: Supply Chain Vulnerabilities in the 2026 Tech Sector

Rolex Perpetual Market Value 2026: Why Luxury Watches Remain a Top Alternative Asset

PSX and KSE-100: How Pakistan’s Market Became One of Asia’s Best Performers

China Stocks vs. Japan Stocks: Where World Bank and IMF Data Point for 2027

State Farm’s $5B Dividend 2026: Who Qualifies & Payout Dates

US-China Relations in Q3 2026: Trade Tariffs and Supply Chain Risks

SpaceX Starship Flight 14: First Orbital Attempt & Starlink V3 Launch Explained

Top 30 Stocks for Investment in PSX for Massive ROI in 2026

The 2026 Crypto Regulatory Shift: What It Means for Institutional Investors

AI Chip Stocks 2026: The Best Semiconductor Investments Beyond Marvell

AI-Powered Training: The Next Multi-Billion Dollar Ecosystem in Fitness

Tween Back-to-School Trends 2026: What’s Driving the $85B Season

Shein Clothes Quality & Safety in 2026: What Lab Tests Show

10-Year Treasury Yield Hits 4.80%: What It Means for Rates & Portfolios

MRVL Earnings 2026: Why Marvell Sank Despite Beating Estimates

Oil Prices Break $100 in 2026: Middle East Conflict & Energy Markets

Fidelity Investments Review 2026: SPAXX Yields & Zero-Fee Funds

Leveraging Viral AI & Climate Hashtags for Brand Growth on X
-

 Markets & Finance8 months ago
Top 15 Stocks for Investment in 2026 in PSX: Your Complete Guide to Pakistan’s Best Investment Opportunities
-

 Analysis7 months ago
Johor’s Investment Boom: The Hidden Costs Behind Malaysia’s Most Ambitious Economic Surge
-

 Analysis7 months ago
Top 10 Stocks for Investment in PSX for Quick Returns in 2026
-

 Analysis7 months ago
Brazil’s Rare Earth Race: US, EU, and China Compete for Critical Minerals as Tensions Rise
-

 Banks8 months ago
Best Investments in Pakistan 2026: Top 10 Low-Price Shares and Long-Term Picks for the PSX
-

 Investment8 months ago
Top 10 Mutual Fund Managers in Pakistan for Investment in 2026: A Comprehensive Guide for Optimal Returns
-

 Global Economy9 months ago
15 Most Lucrative Sectors for Investment in Pakistan: A 2025 Data-Driven Analysis
-

 Global Economy9 months ago
Pakistan’s Export Goldmine: 10 Game-Changing Markets Where Pakistani Businesses Are Winning Big in 2025