
Markets & Finance
PSX and KSE-100: How Pakistan’s Market Became One of Asia’s Best Performers


Key Takeaways
- The KSE-100 Index gained roughly 44% in rupee terms (46–48% in U.S. dollar terms) in fiscal year 2026 — outperforming nearly every major asset class for a third consecutive year.
- The index touched an intraday high of 189,167 in January 2026 before a sharp correction to 146,480 in March amid the Iran-U.S./Israel conflict and a related oil-price spike, then recovered above 180,000 by mid-2026.
- Over FY24–FY26 combined, the KSE-100 has returned 335% in rupee terms (347% in USD terms) — a run analysts attribute to macroeconomic stability under Pakistan’s IMF program, policy continuity, and the country’s return to international debt markets.
- One heavyweight, United Bank Limited (UBL), became Pakistan’s largest listed company by market cap in early 2026, overtaking Oil & Gas Development Company (OGDC).
- Foreign investors were net sellers of roughly $895 million during FY26 even as the index rallied — the gains have been driven overwhelmingly by local institutional and retail buying.
The FY26 Numbers at a Glance
| Metric | FY26 Figure |
|---|---|
| KSE-100 return (PKR) | ~44% |
| KSE-100 return (USD) | ~46–48% |
| 3-year cumulative return (FY24–26, PKR) | 335% |
| 3-year cumulative return (FY24–26, USD) | 347% |
| Intraday high | 189,167 (Jan 23, 2026) |
| Intraday low | 146,480 (Mar 9, 2026) |
| Foreign investor flow | –$895 million (net selling) |
What Drove the Rally
- Macro stability under the IMF program. Rating upgrades, prudent monetary and fiscal policy, and Pakistan’s successful return to international capital markets have all been cited by brokerages (AKD Research, Topline Securities) as core drivers.
- Record monthly remittances. May 2026 remittances hit an all-time high of $4.3 billion, coinciding with the index pushing back above the 180,000 level.
- A geopolitical shock and recovery. The Iran-U.S./Israel conflict triggered a sharp petroleum-price surge and a 29% intra-year swing in the index, but a subsequent MoU on the conflict helped markets recover to pre-war levels by mid-April 2026.
- Sector rotation. Sugar, jute, and transport stocks outperformed the broader market in FY26, while vanaspati, synthetic rayon, and woollen sectors lagged.
Where the Market Stands Now
By mid-September 2026, the KSE-100 was trading in the high-160,000s to near-170,000 range, with brokerage forecasts split between roughly 203,000 (Topline) and a more bullish 263,800 (AKD Research) by December 2026 — a projection that, if realized, would push the index past a historic $100 billion market capitalization for the first time.
The Risk Side of the Ledger
- Foreign capital remains cautious. Nearly $900 million in net foreign selling during a rally this strong suggests international institutions are not yet convinced the move is durable.
- Geopolitical sensitivity. The March 2026 drawdown showed how quickly regional conflict risk (in this case, the Iran-Israel-U.S. situation) can hit the index given Pakistan’s exposure to oil-price shocks.
- Concentration risk. A handful of heavyweights — UBL, OGDC, Engro, HBL, Lucky Cement, Bank Alfalah — have driven a disproportionate share of index gains.
How did the Pakistan Stock Exchange perform in FY26?
The KSE-100 Index gained approximately 44% in rupee terms (46–48% in USD terms) in fiscal year 2026, marking a third consecutive year of outperformance versus other major asset classes, despite a sharp mid-year correction tied to the Iran-U.S./Israel conflict.
Discover more from The Economy
Subscribe to get the latest posts sent to your email.



Key Takeaways
- Rolex’s secondary market rose approximately 7.9% year-over-year as of 2026 (per WatchCharts data) — trailing Patek Philippe (+16.2%) and Tudor (+11.4%) but still outperforming Audemars Piguet (+3.4%).
- Rolex raised U.S. retail prices 4–9% in January 2026 (steel models ~5.6%, gold models ~8.7%), narrowing the historical gap between retail and pre-owned pricing.
- Not every model appreciates: steel sports references (Submariner, GMT-Master II, Daytona) have held value far better than two-tone or widely available dress references like the standard Datejust.
- The Lady-Datejust posted the sharpest 2026 gain among tracked collections — up 22.73%, from roughly $9,269 to $11,376 — driven by demand for smaller, “everyday luxury” watches.
- Gold’s rise past $2,400/oz has directly lifted the investment case for Rolex’s precious-metal references (Day-Date, Sky-Dweller, Yacht-Master).
The Model-by-Model Picture
| Category | 2026 Trend |
|---|---|
| Lady-Datejust | +22.73% (strongest performer among tracked collections) |
| Steel sports models (Submariner, GMT-Master II) | Held value well; corrected from 2022 peak but stabilized above retail |
| Daytona | Corrected from highs above $50,000 to the mid-$30,000s; still among the most sought-after references |
| Two-tone/widely available Datejust | Flat to negative — “holds value” is an overstatement for this category |
| Gold references (Day-Date, Sky-Dweller) | Lifted by gold’s rise above $2,400/oz |
Why the “Rolex Always Appreciates” Myth Is Fading
The pandemic-era boom pushed some references — the Daytona above all — to speculative highs disconnected from historical norms. Since the March 2022 peak, steel sports models have compressed meaningfully, and dealers who bought inventory near the top have in some cases faced 20–40% markdowns on liquidation. The lesson for 2026 buyers: Rolex as a category is not a monolith. Value retention depends heavily on specific reference, condition, and whether the piece comes with box and papers (“full set”).
What’s Actually Driving 2026 Strength
- Retail price increases raise the floor. When a new Submariner retails at $10,050 (up from $9,500), a pre-owned example at $11,000–$12,000 suddenly represents a smaller premium — narrowing the gap without secondary prices actually moving.
- Supply discipline remains Rolex’s core lever. The brand has never confirmed production numbers, and secondary-market premiums remain entirely a function of Rolex’s own manufacturing decisions — a risk factor as much as a support.
- Certified Pre-Owned rollout. Rolex’s now fully rolled-out CPO program has changed how buyers transact in the used market, adding a layer of brand-verified legitimacy that supports pricing.
The Case for Rolex as a Portfolio Diversifier
Financial advisors increasingly frame luxury watches not as a replacement for equities or bonds, but as a tangible, historically low-correlation diversifier — one that carries its own risks (illiquidity, condition-dependent pricing, no yield) but has demonstrated multi-decade resilience for specific references.
Is Rolex a good investment in 2026?
It depends heavily on the specific reference. Steel sports models like the Submariner and Daytona have held or grown in value; two-tone and widely available dress models generally have not. Overall, Rolex’s secondary market rose about 7.9% year-over-year in 2026, trailing Patek Philippe but ahead of Audemars Piguet.
Discover more from The Economy
Subscribe to get the latest posts sent to your email.
Key Takeaways
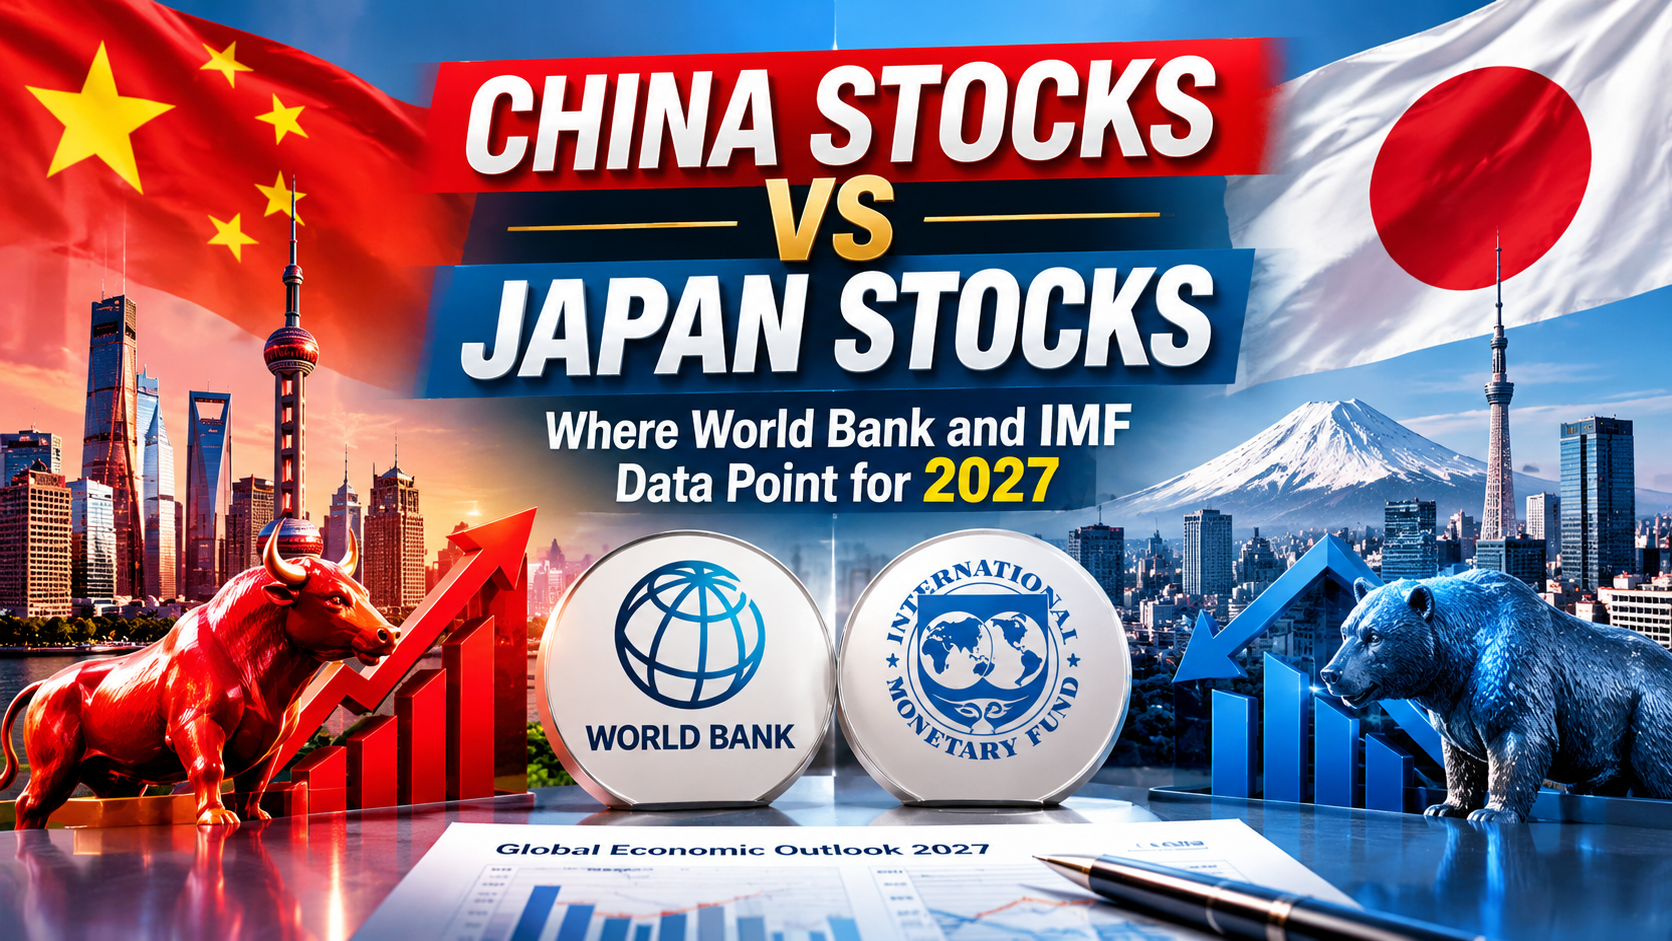
- Japan’s Nikkei 225 has been one of the best-performing major indices of 2026, hitting a fresh all-time high above 72,300 in June before pulling back to the low-60,000s range by September — still up more than 40% year-over-year at points.
- China’s Shanghai Composite has moved far more modestly, advancing only marginally through comparable stretches of 2026 while the Hang Seng has lagged regional peers.
- The IMF’s April 2026 World Economic Outlook projects continued global growth of roughly 3.0–3.3% for 2026 and 3.2–3.4% for 2027, with AI-driven demand lifting economies integrated into the tech value chain — a dynamic that has disproportionately favored Japan’s semiconductor and exporter-heavy index.
- A weaker yen has continued to support Japanese exporters and technology manufacturers, while the Bank of Japan’s policy rate has climbed to its highest level since 1995.
- China’s own IMF Article IV consultation (February 2026) reflects an economy still navigating structural rebalancing, with inflation projected to rise gradually from low levels.
The Headline Numbers
| Index | 2026 Performance Signal |
|---|---|
| Nikkei 225 | Record high above 72,300 (June 2026); +33.6% YTD as of July; trading ~63,000–64,000 by September |
| Shanghai Composite | Modest single-digit moves through comparable periods; muted relative to Nikkei |
| Hang Seng | Lagging regional peers |
| BSE SENSEX (comparison) | Down ~8.9% YTD as of mid-2026 — the weakest of the major indices tracked |
Why Japan Has Outperformed
Japan’s 2026 rally has not been a single-sector story. Gains have come from technology and semiconductor names riding AI infrastructure demand, but banking, real estate, and even textile companies have participated — a sign of broad-based strength rather than a narrow bubble. Contributing factors:
- A structurally weak yen, which continues to boost yen-translated earnings for exporters even as the Bank of Japan tightens gradually (policy rate at 0.75%, the highest since 1995).
- Government-backed technology investment, particularly in AI and semiconductor manufacturing.
- A composition tilt — the Nikkei is roughly 54% weighted toward technology and exporters, making it highly sensitive to the same AI infrastructure boom lifting U.S. tech names.
Why China Has Lagged
China’s markets have moved far more cautiously, reflecting:
- Structural rebalancing away from property-driven growth, a theme the IMF has flagged repeatedly in its China consultations.
- Inflation projected to rise from low levels rather than the disinflationary pressure seen in some other major economies — complicating the policy picture.
- Geopolitical friction, including ongoing U.S.-China trade tension, which continues to weigh on investor sentiment toward Chinese equities relative to other Asian markets.
What the IMF’s 2027 Outlook Suggests
The IMF’s global growth projections for 2027 (roughly 3.2–3.4%) describe an uneven picture: war-related shocks continuing to weigh on energy importers and vulnerable economies, while AI-driven demand lifts countries integrated into the global technology value chain. Japan currently sits more clearly in the second camp than China does.
Are Japanese stocks outperforming Chinese stocks in 2026?
Yes, significantly. Japan’s Nikkei 225 hit an all-time high above 72,300 in June 2026 and was up more than 30% year-to-date at points, driven by a weak yen, AI-related semiconductor demand, and broad-based sector participation. China’s Shanghai Composite and Hong Kong’s Hang Seng have posted far more modest gains over comparable periods.
Discover more from The Economy
Subscribe to get the latest posts sent to your email.
Key Takeaways
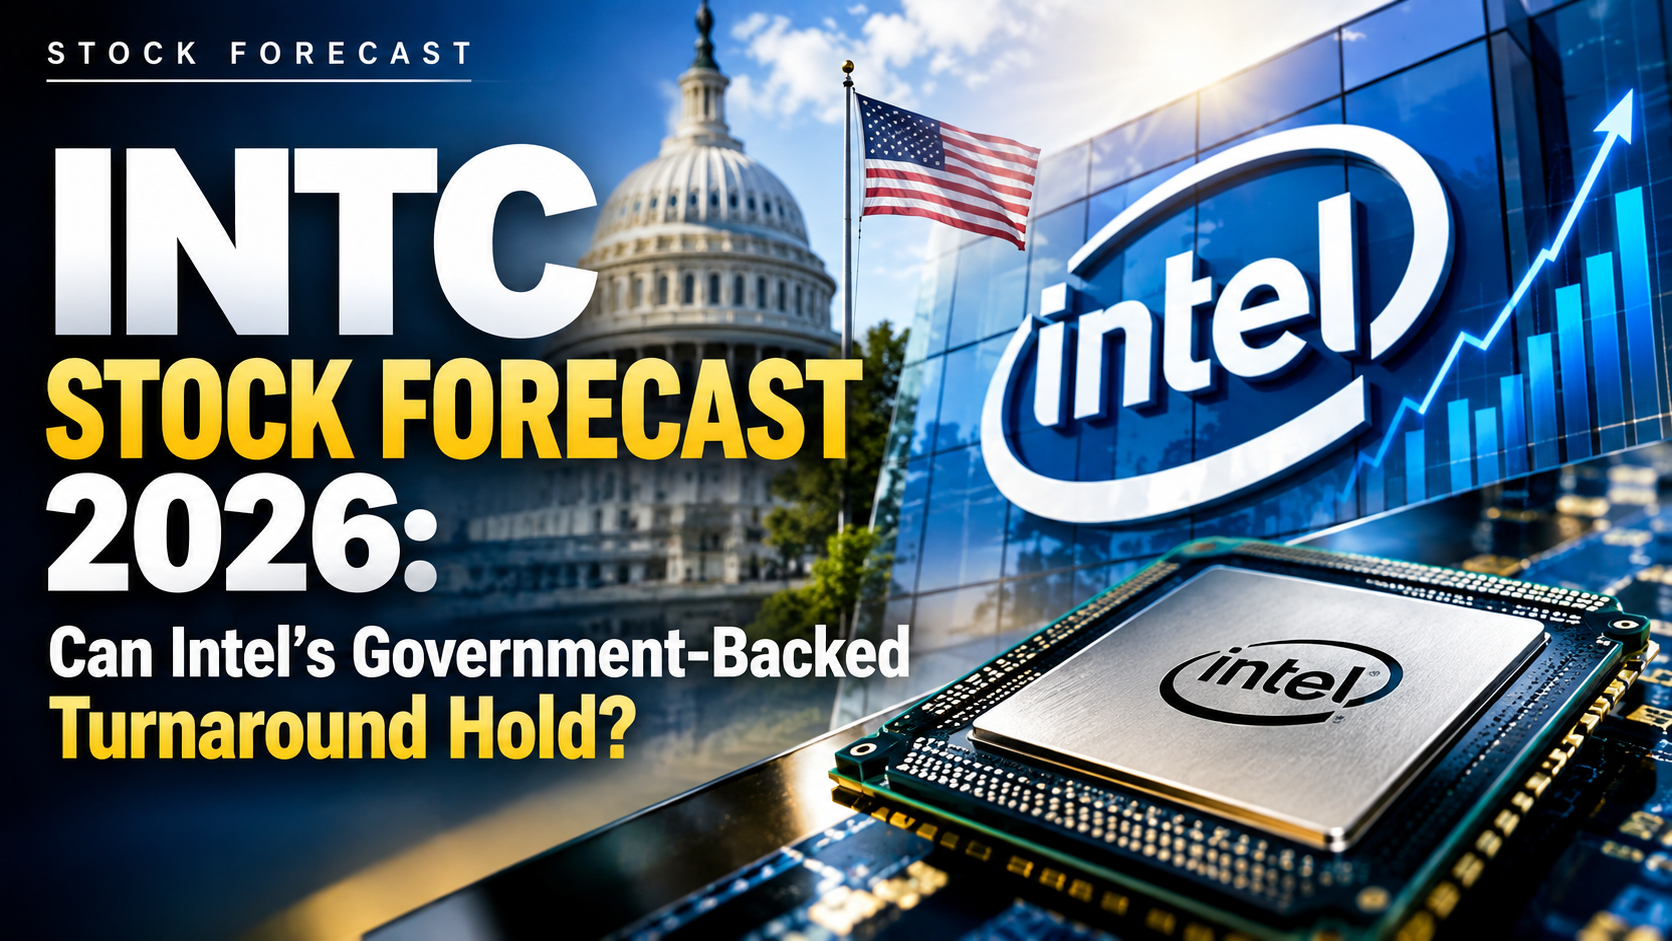
- The U.S. government holds an approximately 10% passive equity stake in Intel, acquired around $20.47/share in August 2025 as part of a finalized CHIPS Act arrangement — a stake now up tens of billions of dollars on paper.
- Intel shares are reportedly up over 160% year-to-date in 2026, driven by pricing changes, AI partnerships, and manufacturing progress.
- Wall Street’s median 12-month price target sits near $110, though the full analyst range spans roughly $75–$200 — an unusually wide dispersion reflecting genuine disagreement about the foundry bet.
- Intel’s 18A manufacturing node is now in high-volume production, with Panther Lake as the first shipping product and external customers reportedly engaging Intel Foundry for next-generation nodes.
- Intel plans to raise PC CPU prices roughly 10% starting in early October 2026 — a margin-protection move rather than a volume play.
Why the Government Is a Shareholder
Following disruptions to the domestic chip supply chain and the 2022 CHIPS Act, Washington took the unusual step of converting some of Intel’s federal support into direct equity — around a 10% stake — with conditions that Intel keep its foundry business intact for at least five years. The rationale: a viable, U.S.-based advanced-logic manufacturer is treated as a national security asset, not just a commercial one, given how concentrated advanced chip manufacturing has become in Taiwan.
That backing functions as a floor under the stock in a way few other semiconductor names have — Intel effectively carries “national champion” status, with preferential access to defense and classified workloads as part of the arrangement.
The Foundry Turnaround, By the Numbers
| Metric | Status (2026) |
|---|---|
| 18A node | In high-volume production; Panther Lake shipping |
| U.S. government stake | ~10%, acquired ~$20.47/share |
| YTD stock performance | Reportedly +160%+ |
| Analyst price target range | $75–$200 (median ~$110) |
| Planned CPU price increase | ~10%, effective early October 2026 |
Intel’s Foundry division has posted multi-billion-dollar operating losses in recent years as external customer revenue continues to lag internal demand — the central risk in the bull case.
The Bull Case
- Intel is targeting roughly 20% of the world’s most advanced logic manufacturing capacity by late 2026, positioning it as the only credible U.S.-based alternative to Taiwan-concentrated advanced-node production.
- Government backing (CHIPS Act equity, SoftBank investment, NVIDIA partnership signals) de-risks the multi-year capital intensity of the foundry buildout.
- Rising global chip demand — the World Semiconductor Trade Statistics organization has projected sharp growth in overall chip sales, with memory pricing acting as a particular tailwind — supports the broader sector even if Intel-specific execution lags.
The Bear Case
- Foundry losses remain large, and external customer revenue — the metric that would validate the “TSMC-style” foundry model — still lags well behind internal Intel demand.
- Heavy, sustained capital expenditure (north of $20 billion annually) pressures free cash flow regardless of top-line improvement.
- The wide analyst target dispersion ($75–$200) itself signals that Wall Street has not reached consensus on whether the turnaround is durable or a government-subsidized reprieve.
Is Intel stock a buy in 2026?
Analyst opinion is split: Intel’s median 12-month price target is roughly $110, but targets range from $75 to $200, reflecting disagreement over whether its government-backed foundry turnaround (18A node, external customer wins) offsets continued foundry losses and heavy capital spending.
Discover more from The Economy
Subscribe to get the latest posts sent to your email.

Marie Gluesenkamp Perez: How a Former Shop Owner’s Moderate Politics Are Shaping Tech and Economy Bills

The Future of Silicon: Supply Chain Vulnerabilities in the 2026 Tech Sector

Rolex Perpetual Market Value 2026: Why Luxury Watches Remain a Top Alternative Asset

PSX and KSE-100: How Pakistan’s Market Became One of Asia’s Best Performers

China Stocks vs. Japan Stocks: Where World Bank and IMF Data Point for 2027

Beyond Rhetoric: How the EU Is Deploying ‘All Tools’ to Rebalance Its €1 Billion-a-Day Trade Deficit with China

Elon Musk’s Next Moves: Disrupting the 2026 Global Economy

INTC Stock Forecast 2026: Can Intel’s Government-Backed Turnaround Hold?

Bitcoin Price Action in Q4 2026: Safe-Haven Asset or High-Risk Tech Play?

The Target Pokémon x Owala Drop: Everything to Know Before It Sells Out

The U.S. Just Confirmed It Has Weapons in Space — Here’s What It Means for Defense Stocks

IRS 2027 Tax Bracket Projections: How to Get Ahead of Bracket Creep

Dow Jones vs. Middle East Tensions: How Wall Street Is Pricing In a 2026 Conflict Nobody Saw Coming

Bank of England’s September 17 Decision: Will UK Interest Rates Finally Move?

State Farm’s $5B Dividend 2026: Who Qualifies & Payout Dates

US-China Relations in Q3 2026: Trade Tariffs and Supply Chain Risks

Oil Surges as Strait of Hormuz Traffic Collapses Again

SpaceX Starship Flight 14: First Orbital Attempt & Starlink V3 Launch Explained

Bank of England Set to Hold Rates Through Year-End, Reuters Poll Shows

Top 30 Stocks for Investment in PSX for Massive ROI in 2026

The 2026 Crypto Regulatory Shift: What It Means for Institutional Investors

AI Chip Stocks 2026: The Best Semiconductor Investments Beyond Marvell

AI-Powered Training: The Next Multi-Billion Dollar Ecosystem in Fitness

Tween Back-to-School Trends 2026: What’s Driving the $85B Season

Russia’s Black Sea Oil Exports Fall for a Fifth Straight Week

Shein Clothes Quality & Safety in 2026: What Lab Tests Show

Global Chip Selloff Deepens: What’s Driving the Aug. 19 Semiconductor Rout

10-Year Treasury Yield Hits 4.80%: What It Means for Rates & Portfolios
-

 Markets & Finance8 months ago
Top 15 Stocks for Investment in 2026 in PSX: Your Complete Guide to Pakistan’s Best Investment Opportunities
-

 Analysis7 months ago
Johor’s Investment Boom: The Hidden Costs Behind Malaysia’s Most Ambitious Economic Surge
-

 Analysis7 months ago
Top 10 Stocks for Investment in PSX for Quick Returns in 2026
-

 Analysis7 months ago
Brazil’s Rare Earth Race: US, EU, and China Compete for Critical Minerals as Tensions Rise
-

 Banks8 months ago
Best Investments in Pakistan 2026: Top 10 Low-Price Shares and Long-Term Picks for the PSX
-

 Investment8 months ago
Top 10 Mutual Fund Managers in Pakistan for Investment in 2026: A Comprehensive Guide for Optimal Returns
-

 Global Economy9 months ago
15 Most Lucrative Sectors for Investment in Pakistan: A 2025 Data-Driven Analysis
-

 Global Economy9 months ago
Pakistan’s Export Goldmine: 10 Game-Changing Markets Where Pakistani Businesses Are Winning Big in 2025