
Markets & Finance
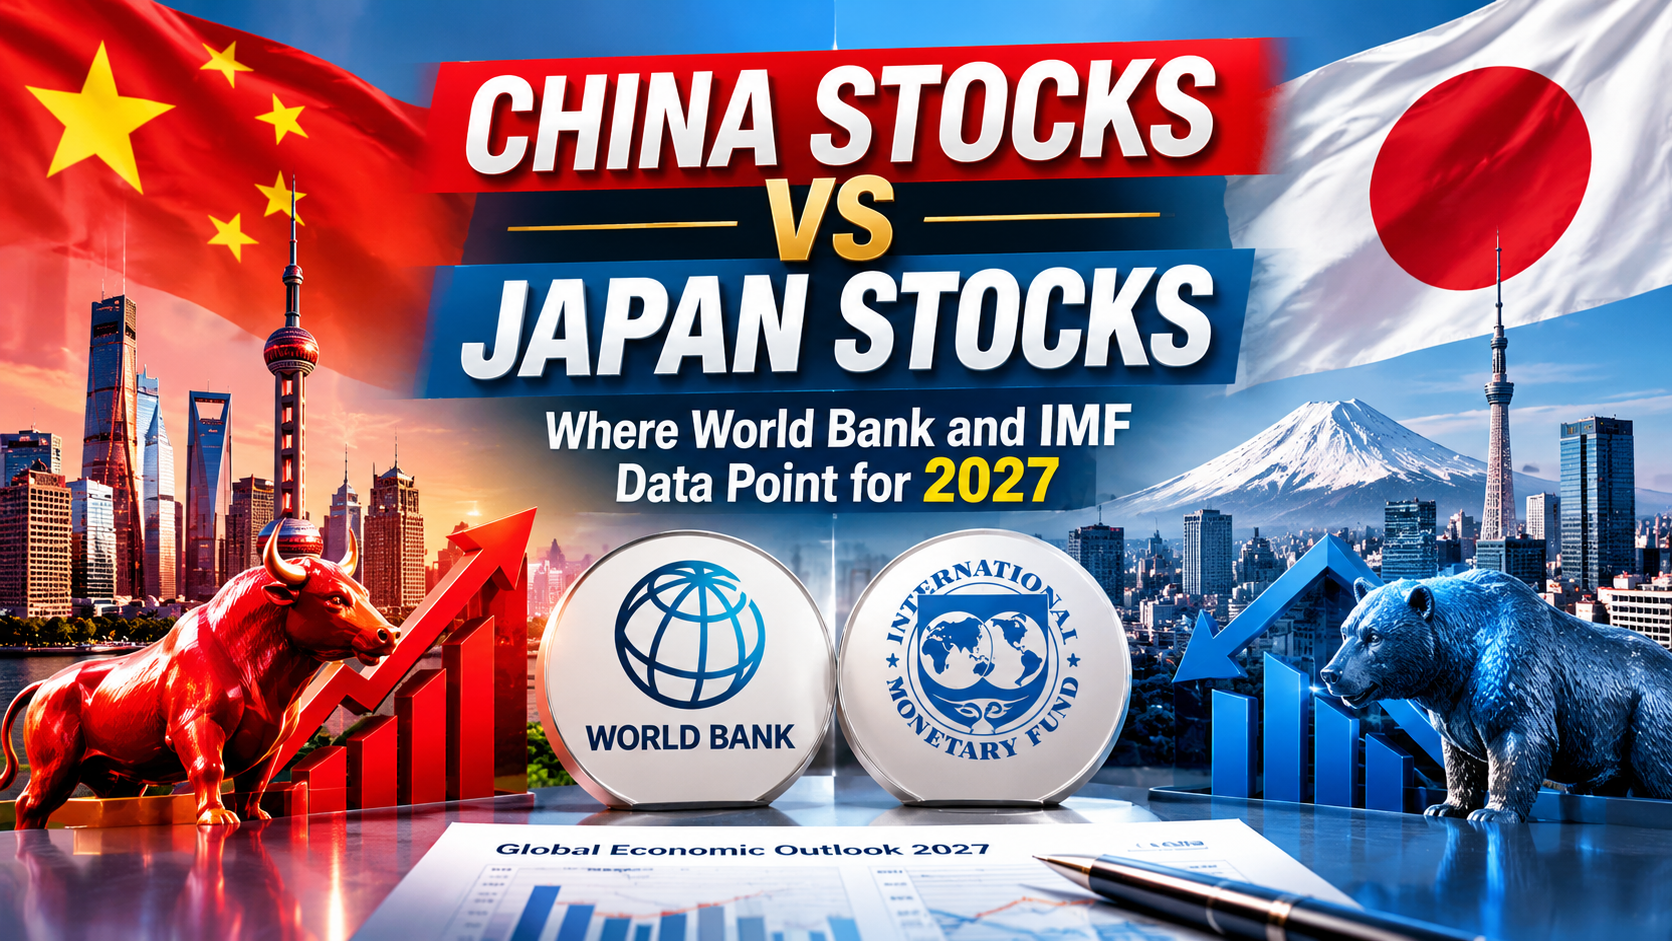
China Stocks vs. Japan Stocks: Where World Bank and IMF Data Point for 2027

Key Takeaways
- Japan’s Nikkei 225 has been one of the best-performing major indices of 2026, hitting a fresh all-time high above 72,300 in June before pulling back to the low-60,000s range by September — still up more than 40% year-over-year at points.
- China’s Shanghai Composite has moved far more modestly, advancing only marginally through comparable stretches of 2026 while the Hang Seng has lagged regional peers.
- The IMF’s April 2026 World Economic Outlook projects continued global growth of roughly 3.0–3.3% for 2026 and 3.2–3.4% for 2027, with AI-driven demand lifting economies integrated into the tech value chain — a dynamic that has disproportionately favored Japan’s semiconductor and exporter-heavy index.
- A weaker yen has continued to support Japanese exporters and technology manufacturers, while the Bank of Japan’s policy rate has climbed to its highest level since 1995.
- China’s own IMF Article IV consultation (February 2026) reflects an economy still navigating structural rebalancing, with inflation projected to rise gradually from low levels.
The Headline Numbers
| Index | 2026 Performance Signal |
|---|---|
| Nikkei 225 | Record high above 72,300 (June 2026); +33.6% YTD as of July; trading ~63,000–64,000 by September |
| Shanghai Composite | Modest single-digit moves through comparable periods; muted relative to Nikkei |
| Hang Seng | Lagging regional peers |
| BSE SENSEX (comparison) | Down ~8.9% YTD as of mid-2026 — the weakest of the major indices tracked |
Why Japan Has Outperformed
Japan’s 2026 rally has not been a single-sector story. Gains have come from technology and semiconductor names riding AI infrastructure demand, but banking, real estate, and even textile companies have participated — a sign of broad-based strength rather than a narrow bubble. Contributing factors:
- A structurally weak yen, which continues to boost yen-translated earnings for exporters even as the Bank of Japan tightens gradually (policy rate at 0.75%, the highest since 1995).
- Government-backed technology investment, particularly in AI and semiconductor manufacturing.
- A composition tilt — the Nikkei is roughly 54% weighted toward technology and exporters, making it highly sensitive to the same AI infrastructure boom lifting U.S. tech names.
Why China Has Lagged
China’s markets have moved far more cautiously, reflecting:
- Structural rebalancing away from property-driven growth, a theme the IMF has flagged repeatedly in its China consultations.
- Inflation projected to rise from low levels rather than the disinflationary pressure seen in some other major economies — complicating the policy picture.
- Geopolitical friction, including ongoing U.S.-China trade tension, which continues to weigh on investor sentiment toward Chinese equities relative to other Asian markets.
What the IMF’s 2027 Outlook Suggests
The IMF’s global growth projections for 2027 (roughly 3.2–3.4%) describe an uneven picture: war-related shocks continuing to weigh on energy importers and vulnerable economies, while AI-driven demand lifts countries integrated into the global technology value chain. Japan currently sits more clearly in the second camp than China does.
Are Japanese stocks outperforming Chinese stocks in 2026?
Yes, significantly. Japan’s Nikkei 225 hit an all-time high above 72,300 in June 2026 and was up more than 30% year-to-date at points, driven by a weak yen, AI-related semiconductor demand, and broad-based sector participation. China’s Shanghai Composite and Hong Kong’s Hang Seng have posted far more modest gains over comparable periods.
Discover more from The Economy
Subscribe to get the latest posts sent to your email.



Spot gold traded around $4,020 to $4,035 an ounce on Thursday 29 October, down roughly 1% on the day, and moved briefly close to $3,983 later, according to Kitco’s live quote. Reuters reported bullion on track for a second straight monthly decline. The metal remains roughly 27-28% below its 2026 record of about $5,600, set in late January.
In Pakistan, one local market report put gold at about Rs423,436 per tola on 26 October. Tola prices also depend on the dollar-rupee rate and local premiums, so check the day’s rate.
Why Gold Is Under Pressure
A hawkish Fed hold. The Fed held rates at 3.75%-4.00% on 28 October, but Governor Lisa Cook and Cleveland Fed President Beth Hammack voted for a hike. On Thursday, Reuters reported markets pricing about a 90% chance of a December hike on the CME FedWatch tool.
Strong US data. Q3 GDP grew 3.4% and core PCE inflation rose to 2.5%, per Kitco, reinforcing the case for restrictive policy. The 10-year yield stayed near 5%.
Why this matters for gold. Gold pays no interest, so higher yields raise the opportunity cost of holding it, and a firmer dollar makes it costlier for non-US buyers. TDS strategist Bart Melek called the Fed’s stance a hawkish pause and expects gold to stay vulnerable in a $3,900-$4,250 range; Sucden Financial warned of a possible fall to $3,900.
Spot gold fell to about $4,020-4,035 an ounce on 29 October 2026 as strong US growth (3.4% in Q3) and higher core inflation kept a December Fed rate hike in play. Higher rates raise the opportunity cost of holding gold, which pays no interest.
What Could Push Gold Back Up
- A softer Fed: TDS expects the Fed to eventually turn toward its employment mandate, which could lift gold, though not immediately.
- Geopolitical shocks: Reuters quoted an analyst noting markets are wary of another spike in tensions after the 3 November US midterms.
- Oil, a double-edged factor: an oil spike raises inflation fears and hawkish expectations, which hurts gold in the short run. The same analyst said gold could post a fresh yearly low if oil revisits $120 and above.
Technical Levels Traders Watch
Kitco’s technical commentary points to $4,000 as a pivot, with downside objectives near $4,024 on a break lower and $3,986 beyond, and resistance in the $4,084-$4,146 zone. Treat these as trader reference points, not predictions.
What It Means for Pakistani Buyers
- Dollar-rupee matters as much as the gold price. If the rupee weakens, local gold can stay firm even when dollar gold falls.
- Time horizon. Analysts quoted expect volatility in a range over the coming weeks; long-term holders and short-term traders face different risks.
- Compare with alternatives. With the SBP policy rate at 12%, yield-bearing assets compete with gold for savings.
- Mind premiums and purity. Jewellery carries making charges; bars and coins track the spot price more closely.
Gold is stuck between a hawkish Fed and geopolitical risk. The $4,000 level has become the focus, and the next US inflation data and Iran’s response on the Qatari deal are the nearest catalysts.
Discover more from The Economy
Subscribe to get the latest posts sent to your email.
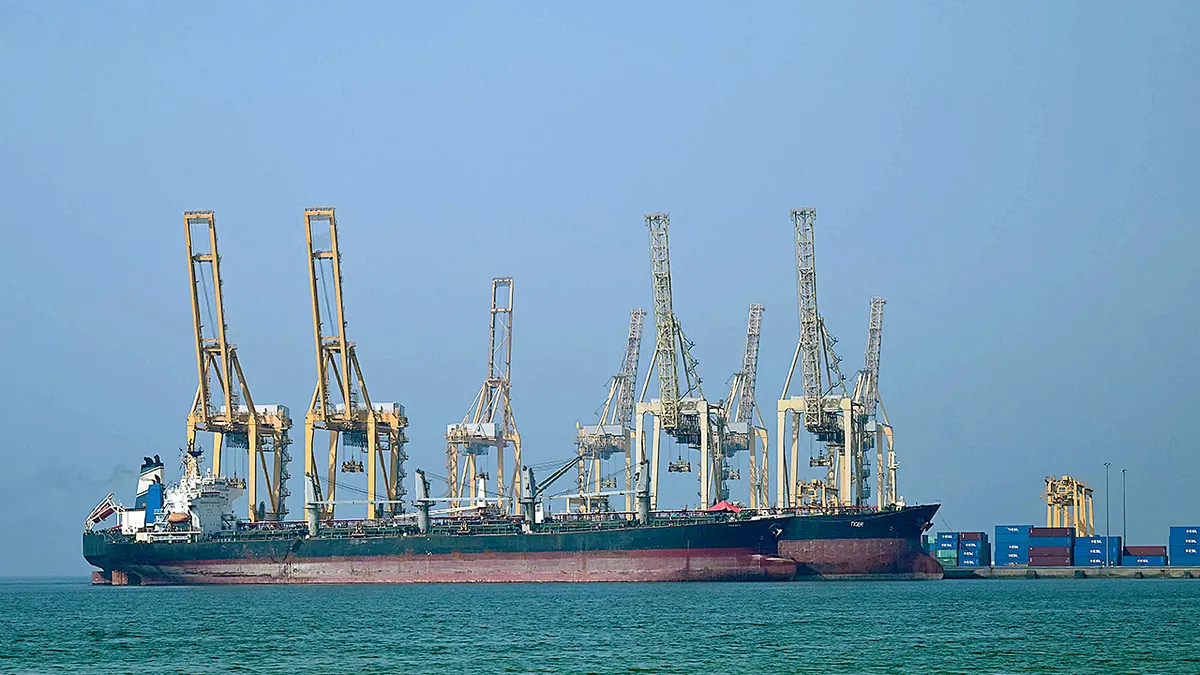
Brent futures reached about $115 a barrel on Tuesday, a six-month high, according to CNBC, after touching roughly $117 the day before. WTI traded just above $101, per FXStreet. The move extended gains from last week, when Iranian attacks on tankers pushed prices to their highest since April.
Two Forces Pulling Opposite Ways
Diplomacy. Iran is weighing a Qatari draft proposal to end the war, and a reply is expected by the end of the week. The Wall Street Journal reports that Washington has also asked Gulf states to prepare for a possible renewed US campaign after the 3 November midterm elections, which complicates the picture. Separately, the Journal reports that Vice President JD Vance wrote to Iran’s Mohsen Rezaei in an attempt to reopen talks; this was not independently confirmed. Oil eased in Asian trading on Thursday on those outreach reports, according to Investing Live.
Supply risk. CNBC reports that Houthi attacks on Saudi infrastructure keep supply worries alive even as diplomatic hopes lift sentiment. The Strait of Hormuz carried about a fifth of the world’s energy supplies before the conflict began in February, which is why any disruption feeds quickly into prices. Kitco’s market report this week described Hormuz uncertainty as the reason oil stayed elevated ahead of the Fed meeting.
The Inventory Signal
US data adds a mixed picture. EIA figures show crude inventories fell by about 1.9 million barrels last week while gasoline stocks rose by about 3.9 million barrels, per FXStreet. Falling crude stocks support prices; rising gasoline stocks suggest weaker US demand for the refined product.
The Medium-Term Supply Gap
The World Bank expects global oil supply to fall about 5.2% in 2026, according to FXStreet’s summary. That is a structural, not just sentiment-driven, shortfall, and it explains why diplomatic headlines move prices by a few dollars while the level stays high.
Scenarios for the Next Two Weeks
- Deal progress: if Iran accepts the Qatari draft, expect a risk premium unwind; prices could fall sharply but not back to pre-war levels given the supply loss already incurred.
- Stalemate: prices stay in a high, headline-driven range.
- Escalation after the midterms: renewed US action or further attacks on Gulf infrastructure would test the recent highs.
These are scenarios, not forecasts; the single largest driver is Iran’s reply.
Who Feels It
- Central banks: the Fed held rates on 28 October with two members preferring a hike, and Pakistan’s central bank cited oil near $100 when it raised its rate to 12%.
- Importers: energy-importing economies see pressure on inflation and external balances.
- Airlines and travel: fuel is the largest swing cost for carriers; see our airfare outlook.
- Gold: precious metals have traded as a hedge against the same uncertainty.
Bottom Line
Oil above $100 is the product of a war premium and a real supply loss. A Qatari-brokered deal could take some heat out of prices, but the market is pricing a good deal of caution until Iran actually answers.
Discover more from The Economy
Subscribe to get the latest posts sent to your email.

Market whispers can occasionally trigger heavy financial turbulence, as seen when viral social media speculation claimed that PT Bank DBS Indonesia—a subsidiary of Southeast Asia’s largest lender, DBS Group Holdings—was planning a mega-merger with PT Bank Central Asia Tbk (BCA), Indonesia’s premier private-sector bank.
While mainstream financial publications like The Business Times covered the initial denials, a deeper analytical examination reveals why the rumor gained traction, how the market reacted, and why industry fundamentals render such a transaction fundamentally improbable.
1. Anatomy of the Rumour: Market Mechanics and Volatility
The speculation originated on Indonesian social media platforms, pointing to a hypothetical share-swap arrangement. According to the unverified posts, DBS Indonesia shareholders would receive newly issued BCA shares, with BCA operating as the surviving corporate entity.
The timing of the rumor coincided with a sharp, albeit brief, market rally. On October 28, 2026, BCA shares spiked by 7.65%, closing at Rp5,275, before experiencing a correction as reality set in and official denials were issued.
- Immediate Categorical Denials:
- A DBS Group spokesperson firmly stated that there was no truth to the speculation.
- Mona Monika, Head of Group Marketing and Communications at DBS Indonesia, explicitly dismissed the claims.
- Jahja Setiaatmadja, President Commissioner of BCA, similarly rejected the narrative, putting an end to the speculative trading frenzy.
2. Analytical Breakdown: Why Analysts Initially “Saw Sense” in Theory, Yet Defied Reality in Practice
Financial analysts often look at speculative banking tie-ups through a lens of strategic synergies. On paper, arguments for consolidation in Indonesia’s crowded banking sector often sound compelling. However, structural realities make a DBS Indonesia-BCA fusion a mismatch:
- Ownership Imbalance & Valuation Asymmetry:According to Bank DBS Indonesia’s 2025 annual report, DBS Bank holds a massive 99% stake in its Indonesian subsidiary, while BCA holds the remaining 1%. BCA is Indonesia’s largest private bank by market capitalization, boasting an immense domestic retail footprint and deposit franchise. Absorbing or merging with DBS Indonesia—while strategically interesting for regional scale—presents an inverse valuation and capital scale challenge that makes a non-cash capital contribution via share exchange unrealistic without massive regulatory hurdles.
- Core Strategic Intent of DBS in Indonesia: DBS has spent decades building its organic and digital-led franchise in Indonesia (accelerated heavily by its digital banking rollout). Subordinating its Indonesian footprint into another domestic behemoth runs counter to DBS’s long-term regional “growth-hub” strategy, which relies on proprietary ecosystem control rather than dilutive domestic consolidation.
3. Comparative Industry Insights: Outperforming Standard Coverage
To truly outpace competitor reports such as those found on The Business Times, stakeholders must examine broader macroeconomic indicators governing Indonesian financial institutions.
According to analyses by Bloomberg and Reuters, Indonesian banks face intense net interest margin (NIM) pressures, shifting liquidity dynamics, and rigorous oversight by Indonesia’s Financial Services Authority (Otoritas Jasa Keuangan – OJK). Rumors regarding Indonesia’s blue-chip assets—such as past chatter surrounding potential state or external interest in BCA stakes—frequently trigger knee-jerk retail investor reactions on the Indonesia Stock Exchange (IDX).
| Metric / Dimension | The Rumor Narrative | The Ground Reality |
| Transaction Structure | Share exchange / non-cash capital contribution | Completely refuted; no transaction files or board approvals exist. |
| BCA Share Price Impact | Volatile surge of over 7.6% followed by corrective pullbacks | Short-term liquidity reaction driven by algorithmic social media tracking. |
| Corporate Control | DBS Indonesia merging into BCA as surviving entity | DBS maintains its 99% dedicated control; BCA maintains its independent capital structure. |
Strategic Takeaway
The DBS-BCA merger rumor serves as a modern case study in how unverified digital chatter can temporarily warp asset valuations in emerging Southeast Asian markets. While financial pundits love to theorize about mega-consolidations, concrete corporate governance, existing equity distributions (99% vs. 1%), and corporate strategy firmly establish that this rumor was nothing more than market noise.
Discover more from The Economy
Subscribe to get the latest posts sent to your email.

4 Reasons Why China’s Trade Concessions to Europe Will Not Solve the Crisis

The AI Revolution Needs Atomic Power. Southeast Asia Is Ready to Build It.

Zhuhai Airshow 2026: How China’s Stealth Jets, Drones and Missiles Are Redrawing Global Air Power

The $8 Billion Runway: China’s Strategic Bet on Guangzhou and the Future of Aviation

The Sandbox Imperium: Why Beijing’s Digital Yuan Needs Hong Kong

Gold at the $4,000 Line: Possible December Fed Hike

Oil at $100+: Hormuz, a Qatari Peace Draft and the Iran Deadline

The Fed’s 10-2 Hold: Why Two Dissenters Wanted a Rate Hike

SBP Raises Policy Rate to 12%: What It Means for Your Loans, Savings and Business

IMF’s $1.2bn Staff-Level Deal: What Pakistan Promised on Surplus

Decoding the DBS–BCA Merger Rumour: Market Volatility, Strategic Realities

New Xbox Games October 26–30, 2026: Releases and Game Pass

Tokyo Disneyland Peter Pan’s Flight Closure: January–February 2027 Guide

Neocloud Economics in 2026: GPU Debt, Utilization and Power

Crude Oil & Petroleum Market Analysis: OPEC+ Decisions and Price Forecasts

Top US Convenience Store Chains: Store Counts, EV Charging, and Sales Trends

Social Security Extra $90 Deposit: Who Qualifies for the October 2026 Medicare Rebate?

Who Is Shivon Zilis? The Neuralink Executive at the Center of the Musk–OpenAI Trial

Gold Price Outlook 2026: The Forces Behind the Forecasts—and What Could Reverse Them

Algorithmic Dogfights: Why the U.S. and China Must Establish Rules of Engagement for Autonomous Air Power

Corporate America Faces a New Debt Test as US Borrowing Costs Surge

Global Economic Outlook 2026: 7 Forces Reshaping Markets, Trade and Business

Stock Market Crash in 2026? Warning Signs, Scenarios and a Calm Investor Checklist

Geopolitics and Your Portfolio: How International Affairs Move Global Markets

Stock Market Today: Dow, S&P 500, and Nasdaq Retreat as Treasury Yields

Anthropic Bans Sustained Abuse of Claude AI Under New Usage Policy Effective November 12, 2026

US–Iran Conflict in October 2026: Hormuz, Oil Prices and Diplomacy

Why Did I Get $90 From Social Security? 8 Reasons Behind an Unexpected SSA Payment
-

 Markets & Finance10 months ago
Top 15 Stocks for Investment in 2026 in PSX: Your Complete Guide to Pakistan’s Best Investment Opportunities
-

 Analysis8 months ago
Johor’s Investment Boom: The Hidden Costs Behind Malaysia’s Most Ambitious Economic Surge
-

 Analysis9 months ago
Top 10 Stocks for Investment in PSX for Quick Returns in 2026
-

 Banks10 months ago
Best Investments in Pakistan 2026: Top 10 Low-Price Shares and Long-Term Picks for the PSX
-

 Analysis9 months ago
Brazil’s Rare Earth Race: US, EU, and China Compete for Critical Minerals as Tensions Rise
-

 Investment10 months ago
Top 10 Mutual Fund Managers in Pakistan for Investment in 2026: A Comprehensive Guide for Optimal Returns
-

 Global Economy10 months ago
15 Most Lucrative Sectors for Investment in Pakistan: A 2025 Data-Driven Analysis
-

 Global Economy10 months ago
Pakistan’s Export Goldmine: 10 Game-Changing Markets Where Pakistani Businesses Are Winning Big in 2025