
Markets & Finance
Geopolitics and Your Portfolio: How International Affairs Move Global Markets


Key Takeaways
- Geopolitical risk is a measurable drag, not just a headline. A widely cited Federal Reserve study finds that higher geopolitical risk foreshadows lower investment and employment, and that the damage comes from both the threat of events and the events themselves.
- 2026 broke a familiar hedge. With oil driven higher by the Iran war, the U.S. 10-year Treasury yield briefly touched about 5.34%, its highest since 2002, so bonds did not cushion stocks the way textbooks promise.
- Energy is the transmission belt. Roughly a fifth of the world’s oil normally sails through the Strait of Hormuz, which is why a regional conflict becomes a global inflation story.
- Indexes can look calm while the market underneath is not. The S&P 500 sits within a couple of percent of its August record, yet market breadth is weak.
- The practical response is structural, not tactical. Diversification, a sensible time horizon and a plan for rebalancing do more than guessing the next headline.
Every few years a news story makes investors feel that the world has changed overnight. A tanker stops moving. A central bank surprises the room. A border closes. Then your portfolio app lights up red, and the temptation to do something becomes almost physical.
This guide is about doing the right something. It explains how international affairs actually reach your investments, what the evidence says about geopolitical shocks, what has happened in 2026 so far, and how to build a portfolio that can absorb the next surprise without a panic sale. It is general information, not personalized financial advice.
How a Distant Conflict Ends Up in Your Account
Geopolitics doesn’t touch prices directly. It moves through a few well-worn channels.
- Commodities. War and sanctions disrupt supply of oil, gas, grain and fertilizer. Prices jump, and costs ripple through transport, food and manufacturing.
- Inflation and interest rates. Higher energy prices push inflation up, which can force central banks to raise rates or delay cuts.
- Currencies and capital flows. Money rotates toward perceived safe havens and away from import-dependent economies.
- Corporate planning. Executives delay investment when the outlook is murky, which is exactly the effect researchers measure.
- Sentiment. Fear alone can reprice risk assets, even before any physical disruption shows up in the data.
The academic backbone here is the geopolitical risk index built by Fed economists Dario Caldara and Matteo Iacoviello. Their paper, published in the American Economic Review, finds that higher geopolitical risk is associated with lower investment and employment and with a greater probability of disasters and larger downside risks. Industries and firms more exposed to those risks cut investment more.
What 2026 Has Looked Like So Far
Start with the shock. Iran’s reported closure of the Strait of Hormuz in early March sent Brent crude sharply higher, as Yahoo Finance reported at the time, and Treasury yields rose on bets that inflation would run hotter. Within about a week, an AP report cited Rystad Energy estimating that more than 12 million barrels of oil equivalent per day had been taken offline.
Since then, the conflict has produced a pattern of hope and disappointment. Brent fell more than 7% in one early-August week on signals of a deal to reopen the strait, per CNBC, then rebounded as the prospects faded. By October 1, Brent was back above $100.
The knock-on effects reached everyday costs. U.S. on-highway diesel averaged $6.382 a gallon in the week of September 28, about $2.63 more than a year earlier.
Where markets stood on October 5
| Indicator | Level | What it signals |
|---|---|---|
| S&P 500 | About 7,720 | Near records, but narrow leadership |
| Nasdaq Composite | About 27,190 | Tech still carrying the index |
| U.S. 10-year Treasury yield | About 5.28% | Borrowing costs near two-decade highs |
| WTI crude | About $90 | Energy still priced for disruption |
| Gold | About $4,190 an ounce | Elevated, but not a one-way bet |
| U.S. Dollar Index | About 102 | A firm dollar tightens conditions abroad |
Figures are from Schwab’s market update and are rounded. Schwab also noted that the S&P 500 Equal Weight Index had posted its seventh straight weekly loss, a sign that gains are concentrated in a small group of large stocks.
The Hedge That Didn’t Hedge
For decades, investors assumed bonds would rise when stocks fell. A geopolitical energy shock can break that assumption, because the problem isn’t weak growth. It’s inflation, and inflation pushes bond yields up and prices down.
You can see it in 2026. The 10-year Treasury hit highs not seen since 2023 in early September, according to CNBC, and then climbed past 5.3% by October 1, a level last seen decades ago. The Federal Reserve raised rates in September to a 3.75% to 4.00% range, its first hike since 2023, and its next meeting is October 27 to 28.
The UK shows the same pattern. Its 10-year gilt yield hovered near 5.4% and the 30-year yield approached 6%, according to Trading Economics, as a global bond sell-off hit one market after another.
The lesson isn’t that bonds are broken. It’s that which kind of shock you face determines which assets protect you. A growth scare favors long-duration government bonds. An inflation scare punishes them.
How Different Assets Tend to React
| Asset | Typical behavior in a Gulf supply shock | Caveat from 2026 |
|---|---|---|
| Energy stocks and commodities | Often benefit as prices rise | Prices can reverse fast on peace headlines |
| Broad equities | Dip on the shock, then recover if growth holds | Leadership can be narrow and fragile |
| Long-term government bonds | Normally a safe haven | Fell when the shock was inflationary |
| Gold | Traditional geopolitical hedge | Highly volatile; forecasts miss often |
| Cash and short-term bills | Stable, with rising yields | Loses ground if inflation persists |
| Import-dependent currencies | Pressured by a higher oil bill | Depends on reserves and policy credibility |
On gold, remember how hard it is to time. JPMorgan was reported in March forecasting gold at $6,300 an ounce by the end of 2026. In early October it traded near $4,190. A gold gain of 7.1% in a single August week was its best weekly performance since January, which also shows how violently it can move in both directions.
Why Your Home Market Matters
Geopolitics hits countries unevenly. An oil shock is a windfall for some and a bill for others.
| Exposure type | Typical pressure points | Examples |
|---|---|---|
| Net energy importers | Higher import bills, weaker currencies, inflation | Pakistan, China |
| Major energy exporters | Stronger trade balances, sanction and logistics risk | Canada, Russia |
| Trade and finance hubs | Shipping costs, risk-off capital flows | Singapore, UK |
| Mixed commodity economies | Depends on the commodity mix | Malaysia, Indonesia |
If most of your income, spending and savings sit in one currency and one market, a geopolitical shock that hurts that economy hits you three times. Spreading exposure across regions and currencies is the cheapest protection available.
A Practical Framework for Investors
None of this requires predicting the next headline. It requires a plan you can follow when the headline arrives.
1. Decide what job each asset does
Equities for growth. Government bonds for stability in growth scares. Real assets or inflation-linked instruments for inflation scares. Cash for liquidity. If you can’t name the job, you probably don’t understand the risk.
2. Match your horizon to your holdings
Money you need within a few years shouldn’t sit in assets that can fall sharply during a crisis. Money you won’t touch for decades can ride out volatility that would be unbearable on a shorter clock.
3. Rebalance by rule, not by mood
Set thresholds in advance, such as reviewing when an asset class drifts five percentage points from target. Rebalancing forces you to trim what has run up and add to what has fallen, which feels wrong in the moment and works over time.
4. Check your inflation sensitivity
Ask what your portfolio does if energy prices stay high for a year. Long-duration bonds, rate-sensitive stocks and thin-margin businesses tend to struggle. Companies with pricing power tend to cope better.
5. Watch the transmission, not the noise
Four numbers tell you more than most cable-news segments: oil prices, bond yields, the dollar and central-bank decisions. If they are calm, the headline is probably just a headline.
Mistakes to Avoid
- Selling after the drop. Geopolitical selloffs are often sharpest early, so panic exits tend to lock in losses.
- Treating gold or any single asset as a guarantee. Hedges are probabilities, not promises.
- Ignoring currency risk. A foreign investment can rise in local terms and still lose in yours.
- Overreacting to forecasts. Price targets and scenario headlines are guesses, as the gold example shows.
Asked & Answered
Do wars always crash the stock market?
No. Research finds that higher geopolitical risk tends to weigh on investment, employment and stock returns, but the size and duration vary widely. Markets often absorb a shock and recover if the economy underneath stays healthy.
Why did bonds fall when stocks were under pressure in 2026?
Because the shock was inflationary. Higher oil prices raised inflation expectations, which pushed yields up and bond prices down, even while equities wobbled.
Is gold a reliable geopolitical hedge?
It can help, but it is volatile and hard to time. Gold moved sharply in both directions this year, and forecasts have repeatedly missed.
How does a Strait of Hormuz disruption affect everyday costs?
Roughly a fifth of the world’s oil normally passes through the strait. When that flow is disrupted, crude, diesel and shipping costs rise, which feeds into transport, food and manufacturing prices.
What should I do with my portfolio when conflict flares?
Start with your plan, not the news. Confirm your asset allocation matches your goals and time horizon, rebalance if you’ve drifted, and avoid large moves made in a hurry. For decisions specific to your situation, talk to a qualified financial adviser.
Discover more from The Economy
Subscribe to get the latest posts sent to your email.



Key Takeaways
- The “Planet Labs and Goldman” link is research coverage, not a partnership. We found no public announcement of a commercial deal. Goldman Sachs analysts cover Planet Labs (NYSE: PL) with a Neutral rating and have raised their price target at least twice this year, first to $18 and then to $20.
- The business is growing fast. Planet’s second-quarter fiscal 2027 revenue hit a record $116.1 million, up 58% year over year, with backlog of about $814.9 million.
- The stock has been a roller coaster. It peaked at $51.76 on May 28, according to TheStreet, and is now down roughly 11% for the year.
- Satellite data has been a Wall Street edge for over a decade. Academic work on parking-lot imagery shows funds have profited from it, and that the advantage stayed concentrated among a select few large investors.
- The next chapter is defense, sovereign demand and AI in orbit. Those are lumpier, bigger-ticket revenue streams than retail parking lots ever were.
Type “Planet Labs Goldman” into a search bar and you’ll find a jumble of analyst notes, price targets and stock-move headlines. It’s natural to assume the two companies are working together. As far as the public record shows, they aren’t.
The real connection is more interesting. Planet Labs is one of the clearest examples of a company turning pictures of Earth into financial-grade information, and Goldman Sachs is one of the institutions deciding what that business is worth. Meanwhile, the broader market for satellite imagery in investing has been quietly maturing for more than a decade.
This guide separates the signal from the noise: who Planet is, what Goldman thinks, how Wall Street has used satellite data, and what to track if you want to evaluate the opportunity yourself. It’s information, not investment advice.
What Planet Labs Actually Sells
Planet Labs PBC, based in San Francisco, operates a large fleet of Earth-observation satellites. The company provides near-daily imagery of the planet’s landmass and sells it, along with analytics, to governments and commercial customers in agriculture, energy, environmental monitoring and defense.
Three product ideas matter for this story:
- Daily, wide-area imagery. Frequency is the product. A picture that updates every day reveals change, and change is what investors and intelligence analysts pay for.
- Specialized sensors. Planet’s Tanager spacecraft targets greenhouse gases such as methane, which turns an environmental question into a measurable data feed.
- Satellite services for sovereign customers. Governments increasingly want their own dedicated capability, and Planet builds and operates it for them.
The Latest Scorecard
Planet reported second-quarter fiscal 2027 results (quarter ended July 31, 2026) in early September. Here is how the numbers looked, from the company’s earnings release and the earnings-call recap.
| Metric | Result | Why it matters |
|---|---|---|
| Revenue | $116.1M, up 58% year over year | A record quarter, well above what analysts expected |
| Net loss | $9.4M, versus $22.6M a year earlier | Losses are shrinking |
| Adjusted EBITDA | $13.9M profit | Operating leverage is showing up |
| Backlog | About $814.9M; roughly half converts within 12 months | Gives forward visibility |
| Cash and short-term investments | $865.4M | Funds capital-intensive satellite builds |
| Defense and intelligence revenue | Up more than 90% | The fastest-growing customer group |
| Third-quarter guidance | $101M to $105M | Below the roughly $114M analysts expected |
| Fiscal 2027 revenue guidance | $430M to $441M, up 40% to 43% | Raised at the low end |
Two things deserve a flag. First, about 12% of second-quarter revenue was “point-in-time” revenue from a satellite handover, versus 1% a year earlier. That kind of revenue is real, but lumpy. Second, the soft third-quarter guide is exactly why the stock reacted so sharply, as 247WallSt noted.
Where Goldman Sachs Fits In
Goldman’s role in this story is as an evaluator. Its equity-research team rates Planet Neutral, which generally signals that the analysts don’t expect the shares to meaningfully beat or lag their coverage group.
The firm’s price-target path tells you how its view evolved:
- March 23, 2026: target raised to $18 from $16.40 after quarterly results beat expectations, driven by defense, intelligence and civil government demand.
- April 20, 2026: target raised to $20 from $18, reflecting improved confidence in the commercial outlook.
In the March note, the analyst said Planet was seeing strong demand signals and making sensible long-term investments. In other words, Goldman liked the business but wasn’t sold on the price. That’s the common story with a stock that had already climbed about 793% over the prior year, according to Investing.com.
The Stock: Boom, Bust, Rebuild?
Planet shares rode a speculative wave early in 2026, peaked at $51.76 in May and have corrected since. TheStreet reports the stock is down about 11% year to date but up nearly 18% over twelve months.
Recent catalysts include:
- A successful launch of 20 satellites, including 18 SuperDove imaging satellites, a Tanager-2 hyperspectral satellite, and an experimental space-based AI computing node developed with Alphabet.
- A record quarter and a growing backlog.
- Sovereign wins such as a seven-figure contract with the Greek government, reported by Investing.com.
The risks are just as concrete. Capital spending is heavy, GAAP profitability remains out of reach, revenue timing can be uneven, and the sector’s enthusiasm can evaporate quickly.
How Wall Street Has Used Satellite Data
Long before Planet was a public company, investors figured out that pictures from orbit could predict earnings.
The best-known example is the parking lot. Companies began selling analysis of retailers’ car counts in the early 2010s. Researchers at UC Berkeley examined 4.8 million images covering 67,000 U.S. stores and found the strategy could indeed deliver an edge, and that the data hadn’t spread much beyond hedge funds. Their warning was blunt: the practice may disadvantage everyday investors who can’t see the same data.
A CNBC feature on alternative data explained the basic logic. Consistently empty parking lots can signal weak store traffic, giving a fund reason to bet against a retailer before the quarterly report lands.
Satellite data has since widened well beyond retail:
- Commodities: crop health, soil moisture and storage activity.
- Energy: tank levels, flaring and shipping patterns.
- Supply chains: port congestion, factory activity and construction progress.
- Climate and ESG: methane plumes, deforestation and land-use change.
A Simple Framework for Judging a Geospatial Stock
| Question | What to look for | Planet today |
|---|---|---|
| Is demand durable? | Backlog and recurring contracts | About $815M backlog; 98% of annual contract value is recurring |
| Is growth profitable? | Adjusted EBITDA and free cash flow | Adjusted EBITDA positive in Q2, guided to a loss in Q3 |
| How concentrated is the customer base? | Government vs. commercial mix | Defense and intelligence growing fastest |
| Is the balance sheet strong? | Cash versus capex needs | $865M cash against $100M to $115M of planned capex |
| Is revenue predictable? | Share of lumpy, point-in-time sales | 12% in Q2, up sharply from a year ago |
Three Risks the Headline Numbers Don’t Show
Strong quarters can hide structural questions. If you’re weighing Planet or any rival, put these three on your checklist.
- Competition. Earth observation is crowded, and governments can choose among several suppliers. One Seeking Alpha analysis argues that the business is strong but that competition remains a long-term risk and valuation may cap future returns.
- Deal conversion. Large sovereign contracts move the needle, but they arrive on irregular timelines. Coverage of the September report pointed out that Planet’s conversion rate on bigger sovereign deals is still being established, which leaves room for guidance to slip if timing moves.
- Narrative dependence. Space stocks trade as a group. When enthusiasm around the sector fades, even companies with improving fundamentals can fall hard, which is part of what the 2026 round trip from $51.76 looks like.
None of these cancel the growth story. They explain why a 58% revenue increase and a falling share price can show up in the same month, and why a Neutral rating from an analyst can be perfectly consistent with a rising business.
The Compliance Question
Is it fair for a fund to trade on satellite imagery? Generally, publicly observable data processed legally is a legitimate research input. The sensitive lines involve how data is collected, what contracts permit, and whether any of it amounts to material nonpublic information. Investors should treat the source as an essential part of due diligence.
Asked & Answered
Does Goldman Sachs partner with Planet Labs?
We found no public announcement of a commercial partnership. Goldman’s visible connection is analyst coverage: a Neutral rating with price targets raised in March and April of 2026.
What does a Neutral rating mean?
It signals that the analysts don’t expect the stock to meaningfully outperform or underperform the companies they cover. It is not a sell call.
Is Planet Labs profitable?
Not on a GAAP basis. It posted a $9.4 million net loss in the latest quarter, though adjusted EBITDA was positive at $13.9 million and losses have narrowed from a year earlier.
How do hedge funds use satellite imagery?
Typical uses include counting cars at retailers, estimating crop yields, tracking oil storage and monitoring shipping. The goal is to see change before it appears in company reports.
Is trading on satellite data legal?
Using lawfully obtained, publicly observable information is generally accepted. Problems arise with misrepresented sourcing or confidential information, so funds typically run these datasets past compliance teams.
Discover more from The Economy
Subscribe to get the latest posts sent to your email.
Markets & Finance
Red Dye Diesel in 2026: Tax Exemptions, Regulations, and the Real Agricultural Impact

Key Takeaways
- Red dye diesel is a tax marker, not a different fuel. The dye flags diesel on which the federal highway excise tax of 24.4 cents per gallon was not collected, because it is sold for exempt uses such as farming, home heating and local government, according to the IRS.
- Using it on the road is expensive. The federal penalty is the greater of $1,000 or $10 per gallon, per IRS Publication 510. That is roughly 41 times the tax a driver would be dodging.
- 2026 is an unusual year. U.S. on-highway diesel averaged $6.382 a gallon in the week of September 28, after a record $6.529 the week before and about $2.63 above a year earlier.
- States are loosening enforcement for harvest. North Carolina, Alabama and Arkansas have each acted, while the American Farm Bureau has asked Washington to waive federal penalties.
- Relief is local. State waivers do not erase federal exposure, and crossing a state line can put a driver back on the wrong side of the law.
If you have ever pulled up behind a tractor and noticed the fuel tank cap, or walked past a farm pump with a bright red nozzle, you’ve seen red dye diesel. It looks like a curiosity. It is actually one of the quietest, most important tax-enforcement tools in American agriculture.
This year it’s also a news story. Diesel hit record highs just as the fall harvest began, and the question of who can burn dyed fuel, where, and at what risk, has moved from a niche compliance topic to a governors’ agenda item.
Here is what red dye diesel is, how the tax logic works, what the penalties look like, and why 2026 has made it matter far beyond the farm gate.
What Red Dye Diesel Actually Is
Red dye diesel, often called dyed diesel, off-road diesel or farm diesel, is ordinary diesel with red dye added at the terminal. The chemistry is the same as clear diesel. The paperwork is not.
The dye exists to make tax evasion visible. Because fuel sold for exempt uses is not taxed, regulators needed a way to tell at a glance whether a tank holds taxed or untaxed fuel. Red does the job.
According to the IRS, dyed diesel is ordinarily untaxed because it’s sold for uses exempt from excise tax, such as to farmers for farming purposes, for home heating use and to local governments. The tax that normally applies to highway diesel is 24.4 cents per gallon at the federal level, and states add their own.
Dyed vs. Clear Diesel: The Comparison
| Feature | Dyed (red) diesel | Clear (undyed) diesel |
|---|---|---|
| Federal highway excise tax | Not collected for exempt uses | 24.4 cents per gallon |
| Typical allowed uses | Farm equipment, generators, heating, construction machinery off-road | On-road vehicles and general use |
| Pump price gap | Often 20 to 30 cents cheaper, per local reporting | Higher, because taxes are included |
| Highway use | Prohibited unless a specific exception or relief applies | Allowed |
| Penalty for misuse | Greater of $1,000 or $10 per gallon, plus the tax owed | Not applicable |
Notice what is missing from that table: a quality difference. Red diesel is not “dirtier” or “weaker.” The distinction is legal, not mechanical.
The Penalty Math Nobody Wants to Learn the Hard Way
The incentive to cheat looks small on paper. At 24.4 cents a gallon, filling a 100-gallon tank with dyed fuel saves about $24. But the penalty under federal law is the greater of $1,000 or $10 per gallon, as laid out in Publication 510.
Run the numbers on a bigger tank:
- 100 gallons: about $24.40 of tax avoided, versus a $1,000 minimum penalty.
- 300 gallons: about $73.20 avoided, versus $3,000.
- Per gallon: 24.4 cents against $10, a ratio of roughly 41 to 1.
On top of the federal exposure, states layer their own penalties. Arkansas, for example, noted in a recent order that improper use can bring additional tax and a $10-per-gallon penalty calculated on the full capacity of a vehicle’s tanks. Mixing dyed and undyed fuel can also trigger charges.
Why 2026 Changed the Conversation
For years, the dyed-diesel debate was a footnote. This fall it became a headline, because the price of diesel moved the economics of farming.
The price shock
The U.S. Energy Information Administration’s weekly survey put national on-highway diesel at $6.382 in the week of September 28, 2026, including taxes. That followed a record $6.529 the previous week, and it was $2.628 higher than a year earlier. California averaged about $8.18.
The driver is the war involving Iran and the disruption around the Strait of Hormuz, which has pushed up crude and distillate prices globally. Off-road diesel is cheaper at the pump because it escapes road taxes, but, as Axios reported, its price moves in tandem with the on-highway fuel.
The farm-level damage
Fuel is a modest share of farm costs in a normal year. This isn’t a normal year.
| Indicator | 2026 figure | Source |
|---|---|---|
| Fuel as a share of corn, soybean and wheat production expenses | Around 3% to 5% | Farm Bureau, via Axios |
| Estimated extra diesel cost across four southern row crops | About $247 million | Auburn University analysis |
| Farm diesel price, week ending September 18 | $5.42 per gallon | Alabama Extension |
| Fuel cost increase per acre, corn / soybeans | $11 / $7 | Purdue’s Michael Langemeier, via Farm Progress and Bloomberg |
Farmers also can’t easily pass costs along. The Farm Bureau’s John Newton has described the squeeze in simple terms: growers buy at retail and sell at wholesale. Add higher fertilizer bills from the same conflict, and many operations are working with thin margins.
States Step In: Relief for Harvest
When harvest season collides with record fuel prices, state governments have a lever they can pull quickly: temporarily relaxing enforcement of the highway-use ban on dyed fuel.
- Alabama: Governor Kay Ivey directed a 120-day halt to enforcement of off-road diesel use on state highways.
- North Carolina: Governor Josh Stein asked the Department of Revenue to waive the state penalty through December 31, 2026. The state’s notice says the relief applies to farming and agricultural highway use, and users must still pay the state excise tax of 41 cents per gallon.
- Arkansas: An executive order suspended specified taxes and penalties for qualifying farm and logging vehicles.
Rep. Don Davis (NC-01) said at least ten governors had suspended or relaxed these penalties, and he urged the IRS to grant federal relief using its existing authority.
What federal relief would look like
The IRS has done this before. In 2021, after a fuel-supply disruption, it waived the dyed-fuel penalty for highway use in a set of states for two weeks, on the condition that the operator or seller paid the 24.4-cent tax. As of the Farm Bureau’s October 1 letter, the group was asking the White House to suspend the federal highway diesel tax and waive penalties for emergency use. We found no federal waiver announced at the time of writing, so check the IRS newsroom before you rely on one.
How to Stay Compliant This Harvest
- Know your state’s rule and its end date. State relief is not federal relief, and it usually expires.
- Pay any required tax. Waivers frequently require the state or federal excise tax to be paid.
- Don’t cross state lines on the assumption you’re covered. North Carolina’s own notice warns that vehicles running dyed fuel outside the state may face federal and other-state penalties.
- Flush tanks afterward. Dye remnants can linger, and regulators advise clearing them before relief ends.
- Keep records. Receipts, farm use logs and dates protect you in a dispute.
- Consider the refund route. Buyers of clear diesel used off-highway can often claim a credit on their federal return using the fuel-tax credit form, so ask your tax preparer.
Red Diesel Outside the U.S.
The same concept exists elsewhere, with different politics. In the United Kingdom, rebated “red” diesel entitlement was sharply narrowed in April 2022. Agriculture, horticulture, forestry and fish farming kept their entitlement, while most construction users lost it. GOV.UK’s Excise Notice 75 guidance sets out the permitted uses. The lesson travels: a cheap, tax-advantaged fuel survives only as long as the rules defining its use are credible.
Asked & Answered
Is it illegal to use red dye diesel in a pickup truck on the road?
Generally yes, in the United States. Dyed diesel is intended for off-road, tax-exempt uses. Highway use can trigger the greater of a $1,000 or $10-per-gallon federal penalty, plus any tax owed, unless a specific exception or temporary relief applies.
How do authorities know I used dyed fuel?
Inspectors can check a vehicle’s fuel supply for the dye, and the red color is visible in a sample. That is the entire reason the dye exists.
Will the IRS waive dyed diesel penalties in 2026?
It has done so in past supply disruptions, and farm groups and state officials are asking for relief now. At the time of writing, we found no announced federal waiver, so check the IRS newsroom for the latest.
Does state relief protect me from federal penalties?
No. State waivers apply only to state penalties. Federal law remains in force unless the IRS issues its own relief, and other states may enforce their rules if you cross a border.
Why is red diesel cheaper than regular diesel?
Because road-use taxes aren’t collected on it. The fuel is the same, but without the 24.4-cent federal tax and typical state taxes, the pump price is lower.
Discover more from The Economy
Subscribe to get the latest posts sent to your email.
Markets & Finance
Analytical Review of The Economist’s “What is the Right Tax System for the 21st Century?”
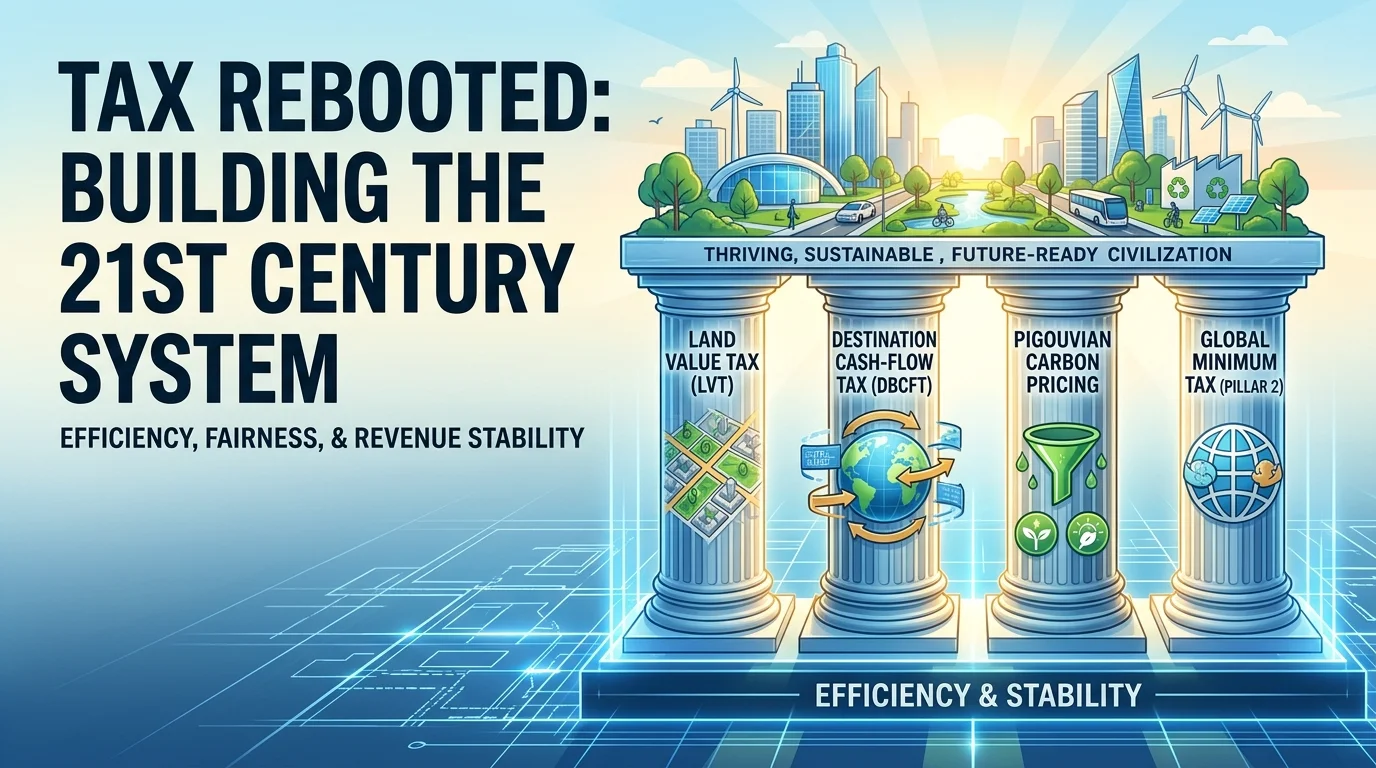
Core Premise & Scope
The Economist correctly diagnoses the structural breakdown of 20th-century tax systems across advanced economies. As sovereign debt loads surge, long-term bond yields remain elevated, demographic aging inflates entitlements, and defense and climate commitments expand, standard fiscal architectures are failing. The article argues that current systems rely too heavily on distortive income and labor taxes while ignoring immobile wealth, land, and environmental negative externalities.
Critical Analytical Gaps
While The Economist identifies key symptoms, its analysis exhibits four primary operational gaps:
- Failure to Address the AI Labor Tax Erosion: High-income nations derive over 40–60% of total tax revenues from Personal Income Tax (PIT) and Social Security Contributions (SSCs). As artificial intelligence and autonomous workflows displace high-wage cognitive labor, standard income tax bases will erode. The Economist treats labor taxation as static rather than declining.
- Abstract Land & Wealth Taxation Without Transition Economics: Advocating for Land Value Taxes (LVT) and property tax overhauls is theoretically sound but politically non-viable without explicit transitional mechanisms (such as tax credits against capital gains or phased revenue-neutral shifts).
- Over-reliance on OECD Consensus Enforcement: The piece assumes smooth global coordination via the OECD Inclusive Framework. In reality, jurisdictional profit-shifting and implementation friction between market nations and headquarters hubs create major enforcement leaks.
- Omission of Cash-Flow Expenditure Architectures: The analysis fails to evaluate Destination-Based Cash-Flow Taxation (DBCFT), which removes incentives for corporate inversion while exempting marginal investment from capital distortion.
Designing the Optimal Tax System for the 21st Century
Tax codes across the developed world are relics of a 1950s industrial economy. Built on the assumption of immobile domestic corporations, fixed physical factories, and stable wage labor, 20th-century tax models create massive deadweight losses, disincentivize capital formation, and fuel wealth inequality.
A modern tax architecture must maximize economic efficiency and neutrality while maintaining progressive distribution and fiscal solvency. Achieving this requires shifting the tax base away from productive inputs (labor and investment) toward unearned economic rents, immobile assets, and negative externalities.
       TRADITIONAL TAX BASE                   21ST-CENTURY TAX ARCHITECTURE
┌─────────────────────────────────┐       ┌─────────────────────────────────┐
│ • High Marginal Income Taxes   │       │ • Land Value Taxation (LVT)     │
│ • Corporate Income Tax (CIT)   │  ───► │ • Progressive Expenditure Tax   │
│ • Payroll & SSC Distortions    │       │ • Pigouvian Carbon Pricing      │
│ • Capital Gains Penalties       │       │ • Destination Cash-Flow Model   │
└─────────────────────────────────┘       └─────────────────────────────────┘
Structural Failures of Current Fiscal Architectures
Modern sovereign states face a structural triad of fiscal pressures:
- Demographic Entitlement Creep: Aging populations reduce the working-age tax base while accelerating expenditures on public pensions and healthcare.
- Labor Income Erosion: Technological displacement and the growth of independent digital work dismantle traditional payroll tax collection mechanisms.
- Capital Mobility & Base Erosion: Intangible assets (IP, algorithms, digital platforms) allow multinational entities to shift taxable profits across borders, undermining standard corporate income taxes.
According to data from the Urban-Brookings Tax Policy Center, high marginal tax rates on capital and labor depress long-run economic growth by creating deadweight loss wedges between pre-tax returns and post-tax rewards.
The Four Pillars of the Modern Tax System
                  ┌─────────────────────────────────────────┐
                  │    21st Century Tax Architecture        │
                  └────────────────────┬────────────────────┘
                                       │
        ┌──────────────────┬───────────┴───────────┬──────────────────┐
        ▼                  ▼                       ▼                  ▼
┌───────────────┐  ┌───────────────┐       ┌───────────────┐  ┌───────────────┐
│  Land Value   │  │  Destination  │       │   Pigouvian   │  │  Global Min   │
│ Tax (LVT)     │  │  Cash-Flow    │       │ Carbon Pricing│  │  Pillar 1/2   │
└───────────────┘  └───────────────┘       └───────────────┘  └───────────────┘
1. Land Value Taxation (LVT)
Land is inelastic in supply. Taxing the unimproved value of land creates zero economic deadweight loss because land cannot relocate or shrink in response to taxation.
- Abolish Standard Property Taxes on Improvements: Traditional property taxes penalize building construction and urban development. Taxing only the underlying land value incentivizes efficient land use and infill development.
- Recapture Unearned Location Value: Urban land values appreciate primarily due to public infrastructure (transit, utilities, public safety) and community growth. An LVT captures these economic rents for public revenue without taxing private capital improvements.
2. Progressive Destination-Based Consumption Tax
Replacing corporate income taxes and high personal income brackets with a progressive cash-flow consumption tax removes the double-taxation penalty on savings and investment.
- Destination-Based Cash-Flow Tax (DBCFT): Tax is levied where goods or services are consumed, rendering corporate tax avoidance via offshore profit-shifting obsolete.
- Full Expensing of Capital Investments: Businesses immediately deduct all capital expenditures, removing investment distortions and accelerating productivity growth.
- Individual Progressive Consumption Tax: Individuals report total income minus net savings. The remaining spending is taxed at progressive rates, shielding low-income households via prebates or personal allowances.
3. Pigouvian Externality Pricing
Taxes should actively discourage activities that impose unpriced costs on society. Pigouvian levies convert social harms into direct fiscal revenue.
- Upstream Carbon Taxation: Implementing a border-adjusted carbon tax prices environmental damage directly into energy and goods production. As outlined in the IMF Fiscal Policy Frameworks, pricing carbon provides market signals for green technology transitions while generating revenue to offset lower income taxes.
- Resource and Congestion Levies: Variable tolling on urban roadways and extraction fees on finite natural resources internalize spatial and environmental costs.
4. Coordinated Multilateral Corporate Minimum Taxes
To address profit-shifting by digital multinationals, international tax law must transition from physical presence rules to destination-based profit allocation.
- Implementation of OECD Pillar 1 & Pillar 2: Adopting a global minimum corporate tax rate of 15% eliminates race-to-the-bottom tax competition, as detailed in the OECD Global Tax Framework.
- Formula Apportionment for Digital Services: Allocating multinational taxable income based on sales destination and active user bases ensures fair revenue distribution without requiring physical offices.
Comparative Analysis of Tax Regimes
| Tax Model | Economic Efficiency | Distributional Equity | Evasion Resilience | Administrative Complexity |
| Traditional Income & Corporate Tax | Low (High deadweight loss, double taxation of savings) | Moderate (Progressive on paper, vulnerable to deductions) | Low (Prone to offshore shifting and tax shelters) | High (Requires extensive compliance and auditing) |
| Wealth & Inheritance Taxation | Low-Moderate (Risks capital flight and valuation disputes) | High (Targets accumulated asset concentration) | Low (Capital moves to non-reporting jurisdictions) | Very High (Requires complex annual asset valuations) |
| Land Value Taxation (LVT) | Maximum (Zero supply distortion on unimproved land) | High (Progressive; land ownership is heavily concentrated) | Maximum (Immobile physical asset) | Low (Requires transparent cadastral land valuation) |
| Destination Cash-Flow Consumption Tax | High (Promotes investment, eliminates capital penalties) | High (Progressive spending tiers + prebates) | High (Border adjustments eliminate transfer pricing) | Moderate (Relies on border adjustments and financial transaction data) |
Mitigating AI-Driven Disruption to Public Finance
As AI tools and automation displace labor income, tax systems relying on payroll fees face declining receipts. Attempting to tax AI directly through “robot taxes” slows innovation and distorts technical adoption.
┌────────────────────────────────────────────────────────────────────────┐
│                        AI DISRUPTION & TAX BASE                        │
├──────────────────────────────────┬─────────────────────────────────────┤
│  Flawed Approach: Robot Taxes    │  Optimal Approach: Cash-Flow Tax    │
├──────────────────────────────────┼─────────────────────────────────────┤
│ • Penalizes technology adoption  │ • Taxes economic output at spending │
│ • Arbitrary definition of "robot" │ • Captures AI super-normal rents    │
│ • Slows productivity growth      │ • Neutral to technology choice      │
└──────────────────────────────────┴─────────────────────────────────────┘
The solution is to decouple public revenues from labor payrolls altogether:
- Shift Base to Corporate Cash-Flow and Land: As capital yields an increasing share of national income relative to wages, taxation must target corporate economic rents and land values rather than wage receipts.
- Eliminate Payroll Tax Caps: Remove income thresholds on social insurance contributions to maintain equity during structural shifts in high-earner distributions.
- Expand Universal Citizen Dividends: Fund social safety nets using revenues generated from Pigouvian carbon taxes and land value capture rather than taxing wage transactions.
Political Execution & Transition Roadmap
Reforming a tax code requires managing transition shocks to prevent capital flight or political paralysis.
Phase 1: Stabilization (Years 1-2)
├── Introduce upstream Carbon Tax with dividend returns
└── Enact OECD Pillar 2 15% global minimum tax

Phase 2: Base Shift (Years 3-5)
├── Replace local property taxes with Land Value Tax (LVT)
└── Allow 100% immediate expensing for business investments

Phase 3: Structural Realignment (Years 6-10)
├── Consolidate Personal Income Tax into Progressive Consumption Tax
└── Phase down distortionary corporate income tax rates
- Revenue-Neutral Phase-In: Pair new Land Value Taxes and carbon levies with immediate rate reductions on wage income and full capital expensing for businesses.
- Granular Tax Prebates: Mitigate regressivity in consumption taxes by distributing monthly advance rebates to low-and-middle-income households.
- International Harmonization: Secure treaty compliance through the IMF International Tax Reform Guidelines, ensuring uniform adoption of destination-based rules across major trading blocs.
Discover more from The Economy
Subscribe to get the latest posts sent to your email.

Geopolitics and Your Portfolio: How International Affairs Move Global Markets

Conservative Party Conference 2026: What Badenoch’s Tax and Deregulation Pitch Means for the UK Economy

Planet Labs and Goldman: How Satellite Geospatial Data Is Reshaping Wall Street

Red Dye Diesel in 2026: Tax Exemptions, Regulations, and the Real Agricultural Impact

Student Loans in 2026: Forgiveness Updates, Consolidation, and Repayment Strategies

Why Did I Get $90 From Social Security? 8 Reasons Behind an Unexpected SSA Payment

Corporate America Faces a New Debt Test as US Borrowing Costs Surge

Goldman vs. Citi: Which Banking Giant Leads Modern Global Finance in 2026?

Beyond Hanoi & HCMC: How Northern Industrial Clusters Are Driving Vietnam’s 10% Growth Surge

Analytical Review of The Economist’s “What is the Right Tax System for the 21st Century?”

Southeast Asia’s LNG Dilemma: Navigating Price Volatility, Infrastructure Gaps, and Energy Security

Who Is Shivon Zilis? The Neuralink Executive at the Center of the Musk–OpenAI Trial

ChatGPT Traffic Rebounds in 2026: Why OpenAI’s AI Giant Is Winning Users Back

U.S.-Ireland Trade Dynamics: Trump’s Investment Push

Oil Prices Break $100 in 2026: Middle East Conflict & Energy Markets

IMF & World Bank 2026 Global Economic Outlook: Growth, Inflation, Debt

Middle East War Economics 2026: Oil Prices & Energy Markets

China Stocks Today: Are Big Economies in Asia Nearing a Market Bottom?

High-CPM Finance Niches 2026: Publisher Monetization Blueprint

Global Pension Systems Ranked: The World’s Best and Worst Retirement Frameworks

Enterprise AI Platforms Disrupting B2B SaaS in 2026: Full Analysis

Social Security Trust Fund 2032: OASI Depletion Timeline Explained

Elon Musk’s Next Moves: Disrupting the 2026 Global Economy

Crypto Daily Outlook: Bitcoin, Altcoins, and the Future of Decentralized Finance

GasBuddy Market Insights: How Crude Price Shifts Impact Local Fuel Cost Averages

World Bank & IMF Reports 2026: Why the “3% Growth” Consensus Is Actually a Debate

World’s Largest Economies: Ranking the Top Global Powers

PSX Forecast 2026: KSE-100, IMF Reviews & Geopolitics
-

 Markets & Finance9 months ago
Top 15 Stocks for Investment in 2026 in PSX: Your Complete Guide to Pakistan’s Best Investment Opportunities
-

 Analysis8 months ago
Johor’s Investment Boom: The Hidden Costs Behind Malaysia’s Most Ambitious Economic Surge
-

 Analysis8 months ago
Top 10 Stocks for Investment in PSX for Quick Returns in 2026
-

 Banks9 months ago
Best Investments in Pakistan 2026: Top 10 Low-Price Shares and Long-Term Picks for the PSX
-

 Analysis8 months ago
Brazil’s Rare Earth Race: US, EU, and China Compete for Critical Minerals as Tensions Rise
-

 Investment9 months ago
Top 10 Mutual Fund Managers in Pakistan for Investment in 2026: A Comprehensive Guide for Optimal Returns
-

 Global Economy9 months ago
15 Most Lucrative Sectors for Investment in Pakistan: A 2025 Data-Driven Analysis
-

 Global Economy9 months ago
Pakistan’s Export Goldmine: 10 Game-Changing Markets Where Pakistani Businesses Are Winning Big in 2025