
Fintech & Global Finance
Kai Cenat’s Rise to the Top: The Economics of Modern Streaming

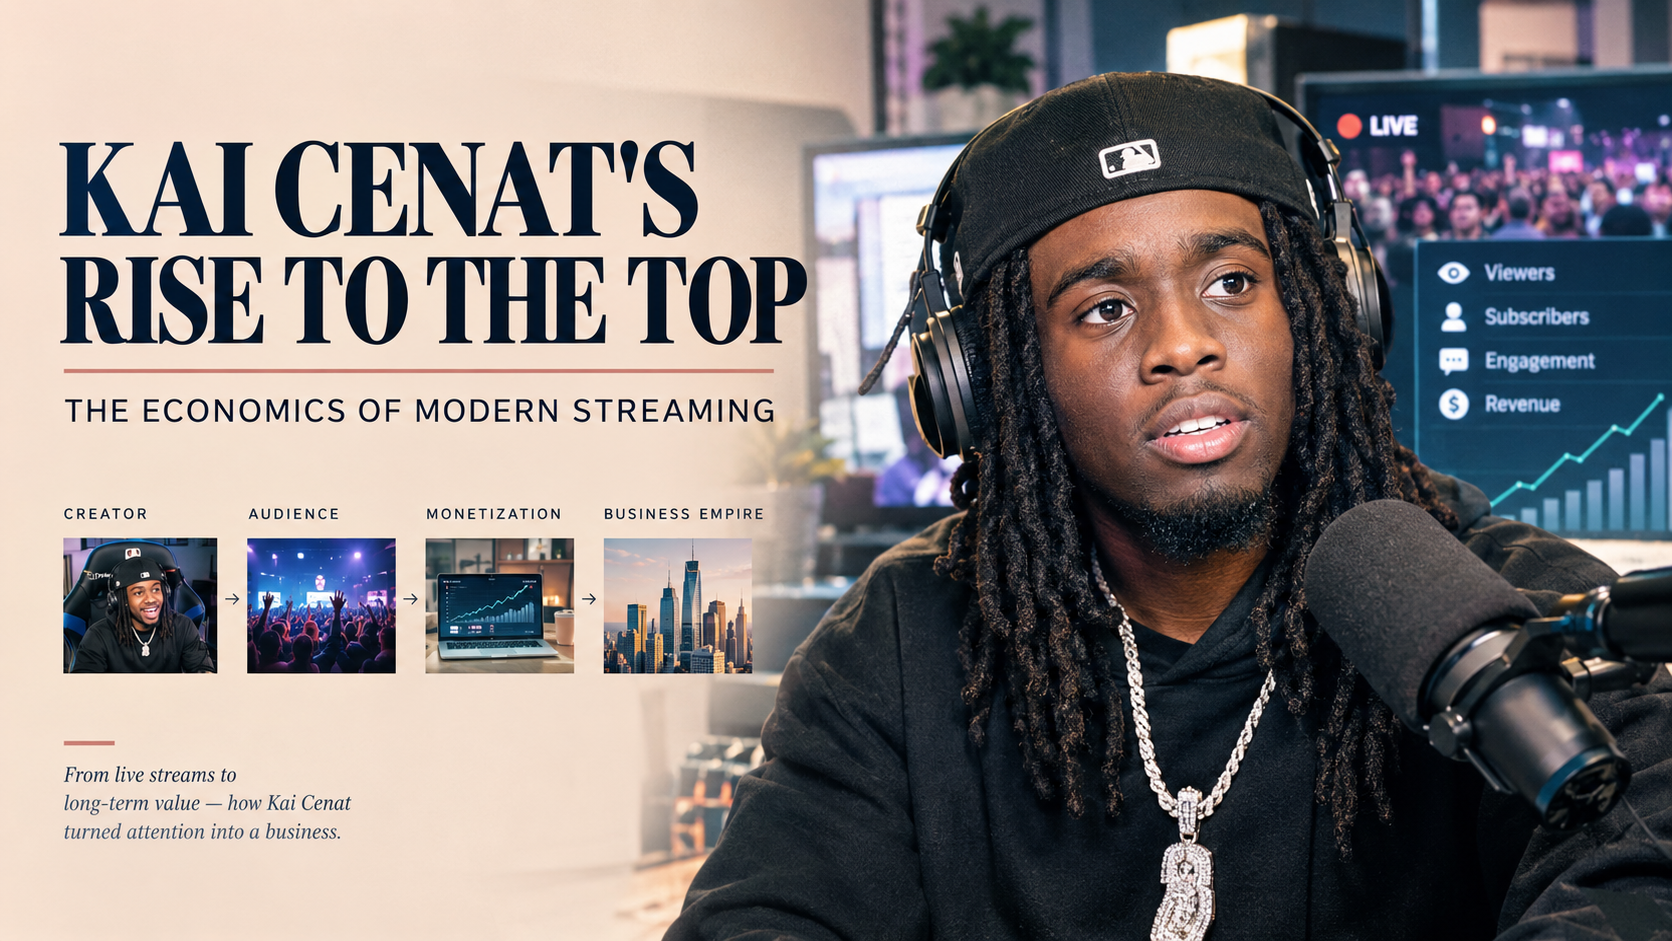
Kai Cenat turned a month of non-stop livestreaming into the biggest subscriber haul in Twitch history, and the business model underneath it is stranger and more lucrative than it looks.
Key Takeaways
- First to 1 million. On September 28, 2025, Cenat became the first Twitch streamer to pass one million active subscribers, during his third “Mafiathon” subathon (Influencer Marketing Hub).
- Record trajectory. His Mafiathon 2 in November 2024 hit roughly 728,000 subscribers, topping the previous record of 326,250 held by VTuber Ironmouse (Yahoo Tech).
- Scale of attention. Mafiathon 3 tallied 82.5 million hours watched and a peak above one million concurrent viewers (Influencer Marketing Hub).
- Revenue engine. Subscriptions are only one layer; sponsorships, celebrity-driven reach, and brand deals multiply the value of each record.
| Event | Date | Subscribers | Notes |
|---|---|---|---|
| Mafiathon 1 | 2023 | ~306,600 | Overtook Ludwig’s record (Wikipedia) |
| Mafiathon 2 | Nov 2024 | ~728,000 | Beat Ironmouse; ~50M unique viewers reported (Yahoo Tech) |
| Mafiathon 3 | Sept 2025 | 1,000,000+ | First streamer past 1M; 82.5M hours watched |
How a Subathon Makes Money
A subathon is a livestream marathon where each new subscription adds time to the clock. The mechanism is simple and powerful:
- Viewers subscribe (a Tier 1 sub costs $4.99 a month).
- Each sub extends the stream, giving fans a stake in the outcome.
- Gift subs spread the effect, letting communities pool money to push the number higher.
- Celebrity guests drive news cycles, pulling in casual viewers who may subscribe once.
Cenat’s 2024 event featured guests such as Snoop Dogg, Kevin Hart, Serena Williams, Lizzo, and SZA, per People of Color in Tech, which also reported the stream was staffed to continue while he slept.
The Revenue Math
Platform splits vary, but Twitch has been reported to keep between 30% and 50% of subscription fees (Yahoo Tech). Using that range, here is an illustrative (not reported) calculation for one month of one million Tier 1 subscriptions:
| Step | Amount |
|---|---|
| Gross at $4.99 × 1,000,000 | ~$4.99 million |
| Streamer share at 50% | ~$2.5 million |
| Streamer share at 70% | ~$3.5 million |
Reality differs: many subscriptions are discounted, gifted in bundles, or on other tiers, and the figure excludes sponsorships and other income. For Mafiathon 2, Yahoo Tech reported an estimated $3.6 million in subscription revenue, a model-based estimate rather than a disclosed number.
Why the Model Works
Attention as an asset
Cenat is the most-followed Twitch streamer, with about 21 million followers, according to Wikipedia. He began streaming on Twitch in February 2021 after moving from YouTube.
Community ownership
Subscribers are not passive; they help set the stream’s length. That participation turns a purchase into an identity.
Event scarcity
Mafiathon happens rarely, so each edition is treated as a cultural moment rather than routine content.
Records as marketing
Every new record generates press coverage that serves as free advertising for the next event.
The Risks Behind the Records
- Concentration risk. One person is the product. Health, burnout, or a platform ban would hit income directly. Cenat was temporarily suspended from Twitch in April 2023 (Wikipedia).
- Platform dependence. Twitch controls the revenue split, rules, and discoverability.
- Subscriber decay. Subathon spikes fade; subscribers often lapse after the event. As of January 6, 2026, Cenat’s channel was listed at about 1.11 million all-time peak subscribers (Wikipedia list), a record, but not a baseline.
- Competition. Streamers such as Jynxzi, IShowSpeed, and others continue to compete for the same audience.
What Marketers and Creators Can Learn
- Design participation, not just content. Let the audience affect the outcome.
- Make events rare and recognizable.
- Use guests as distribution, not just entertainment.
- Diversify income across subscriptions, brand deals, and owned products.
- Treat records as campaigns, with a clear narrative arc.
Frequently Asked Questions
How many subscribers does Kai Cenat have?
He passed 1,000,000 active subscribers on September 28, 2025, the first on Twitch to do so (Influencer Marketing Hub).
How much did Mafiathon make?
Mafiathon 2 was estimated at about $3.6 million in subscription revenue, per Yahoo Tech; official figures were not disclosed.
What is a subathon?
A livestream where each new subscription adds time to the broadcast.
How much does Twitch take from subscriptions?
Reported at 30% to 50%, depending on the streamer’s agreement.
Is Kai Cenat the biggest streamer?
He is described as the most-subscribed and most-followed Twitch streamer as of 2026 (Wikipedia).
Kai Cenat did not just build an audience. He built a machine that converts attention into a countdown clock, and then sold the countdown.
Discover more from The Economy
Subscribe to get the latest posts sent to your email.


Asset Managment companies
MAS Allocates S$1.45 Billion to Five Asset Managers in Third EQDP Batch: Total Deployment Reaches S$5.4 Billion
The Monetary Authority of Singapore (MAS) has appointed five asset managers — Amundi, Franklin Templeton, HSBC Asset Management, M&G Investments and Natixis Investment Managers — under the third batch of its Equity Market Development Programme (EQDP), deploying a further S$1.45 billion into Singapore’s equity market.
The announcement, made by Minister for National Development and MAS Deputy Chairman Chee Hong Tat at the SuperReturn Asia conference on 29 September 2026, takes total EQDP allocations to S$5.4 billion across 14 managers — 83% of the programme’s expanded S$6.5 billion war chest, following its top-up at Budget 2026.
Alongside the appointments, MAS committed S$20 million from the Financial Sector Development Fund to a new GEMS Market Making Grant aimed at tightening bid-ask spreads in roughly 80 small and mid-cap stocks outside the Straits Times Index.
What is the EQDP? A quick recap
The EQDP was launched in February 2025 as a flagship demand-side measure of the Equities Market Review Group, which MAS convened in August 2024 to revive the Singapore Exchange (SGX). Its twin objectives: develop Singapore’s local fund management industry, and channel sustained institutional capital into Singapore-listed equities — including cornerstone participation in IPOs.
EQDP deployment: the full picture so far
Table
| Batch | Date | Managers | Allocation |
|---|---|---|---|
| Batch 1 | July 2025 | Avanda Investment Management, Fullerton Fund Management, JPMorgan Asset Management | S$1.1 billion |
| Batch 2 | November 2025 | Amova Asset Management, AR Capital, BlackRock, Eastspring Investments, Lion Global Investors, Manulife Investment Management | S$2.85 billion |
| Batch 3 | September 2026 | Amundi, Franklin Templeton, HSBC Asset Management, M&G Investments, Natixis Investment Managers | S$1.45 billion |
| Total | 14 managers | S$5.4 billion |
The third batch brings a notably more international flavour than earlier rounds. In his SuperReturn Asia speech, Chee said these managers “bring with them global distribution networks, sources of capital, and expertise that strengthen the depth and dynamism of our public markets” — meaning EQDP money is now explicitly designed to pull in foreign capital alongside domestic allocations.
S$20 million GEMS Market Making Grant: liquidity for the “missing middle”
The second announcement targets a chronic weakness of the SGX: thin trading in its small and mid-cap segment. The new GEMS Market Making Grant will:
- Fund appointed market makers providing liquidity for an initial group of around 80 eligible stocks outside the STI, plus newly listed counters
- Run until 31 December 2028
- Aim for tighter bid-ask spreads, lower execution costs and stronger price discovery
- Review and expand the eligible list regularly
Chee described the target as the “middle segment” — stocks with sufficient trading activity to benefit from market-making support, but not the large, liquid STI constituents. Early signs suggest the broader reform push is working: average daily turnover in Q3 2025 rose 16% year-on-year to S$1.53 billion, the highest since Q1 2021, with IPO fundraising topping S$2 billion, according to MAS data cited by The Straits Times.
The bigger play: anchoring S$7 trillion of asset management in Singapore
Tuesday’s announcements were bookended by measures targeting Singapore’s asset management industry, which now oversees close to S$7 trillion across more than 1,300 managers — growing 7.5% annually over the past five years, per MAS’s August 2026 package:
- Investment Management Track under the ONE Pass (from late January 2027, with the Ministry of Manpower) — applicants can meet the S$30,000 qualifying salary through a minimum S$15,000 fixed monthly salary plus variable, performance-linked components, reflecting industry compensation norms. Further details are expected at Budget 2027.
- Tax exemption for profit-related returns from fund management services to qualifying funds, effective from Year of Assessment 2027.
- A new MAS Hedge Fund Investment Programme to anchor leading hedge fund managers and their ecosystems (prime brokerages, ancillary services) in Singapore.
On licensing, Chee revealed MAS has received more than 500 fund management licence applications over the past three years, with a median approval time of 4.5 months in Q2 2026 — and the fastest approved in just 12 weeks — while pledging to streamline further without lowering standards.
What happens next?
- Batch 4: MAS is reviewing proposals now and expects to announce the next group of EQDP managers in 2027 — S$1.1 billion of the programme remains unallocated.
- Budget 2027: Details of the ONE Pass Investment Management Track, tax exemption and hedge fund programme.
- Market structure reforms: The SGX-Nasdaq dual listing bridge, reduced board lot sizes and the modernised post-trade custody model round out the Review Group’s implementation agenda.
Frequently Asked Questions
Which five asset managers were appointed in the third EQDP batch?
Amundi, Franklin Templeton, HSBC Asset Management, M&G Investments and Natixis Investment Managers, sharing S$1.45 billion.
How much of the EQDP has been allocated?
S$5.4 billion of S$6.5 billion across 14 managers in three batches. A fourth batch is under review for announcement in 2027.
What is the GEMS Market Making Grant?
A S$20 million grant (until end-2028) funding market makers in roughly 80 non-STI small and mid-cap stocks to narrow spreads and improve liquidity.
Can retail investors benefit?
Indirectly — tighter spreads and better price discovery lower trading costs for everyone, and EQDP managers’ funds may include counters retail investors already own.
Discover more from The Economy
Subscribe to get the latest posts sent to your email.

How big is the AI chip industry in 2026? Global semiconductor revenue is projected to exceed $1.3 trillion in 2026 — a 64% increase and the fastest growth the industry has recorded in more than 20 years, according to research firm Gartner. That would mark a third consecutive year of double-digit growth for the sector, driven by surging demand for AI processing, data-center infrastructure, and rising memory prices, per Gartner senior principal analyst Rajeev Rajput.
That single statistic captures why “technology news” in 2026 is really one story told through dozens of companies: an unprecedented, sustained capital-spending cycle built around artificial intelligence infrastructure.
Hyperscalers Are the Engine
The chip boom is being funded almost entirely by a handful of technology giants. Alphabet, Amazon, Microsoft, and Meta — the hyperscalers building the cloud infrastructure that AI models run on — have collectively committed more than $700 billion in 2026 capital spending, according to reporting relayed through Yahoo Finance’s technology desk. Alphabet alone spent $35.67 billion on capital expenditure in a single quarter — more than double the prior year’s pace — while its Google Cloud backlog nearly doubled to over $460 billion. Amazon led quarterly spending at $44.2 billion as AWS grew 28%, and Microsoft’s fiscal third-quarter capex rose 84% year-over-year to $30.88 billion as its AI revenue run rate surpassed $37 billion annually.
Featured Snippet Target: The four largest U.S. hyperscalers — Alphabet, Amazon, Microsoft, and Meta — are on pace to spend over $700 billion combined on AI infrastructure in 2026, a figure Reuters’ Morning Bid podcast described as rising “all the time” and directly responsible for surging demand for AI chips and data-center equipment.
That spending has increasingly shifted from being funded purely by operating cash flow to relying on debt and equity markets. Alphabet’s June 2026 equity raise — combining Class A common stock, Class C capital stock, and mandatory convertible preferred shares — ranks as the largest single AI-funding capital raise in market history, according to market commentary circulated via KuCoin’s research desk. Goldman Sachs has characterized this as a structural shift from a low-cost-of-capital “Modern” cycle to a higher-volatility “Post-Modern” one, in which markets increasingly reward capital expenditure over share buybacks — S&P 500 companies posted 24% year-on-year capex growth in the second quarter of 2026 alongside a 1% decline in gross buybacks.
Nvidia’s Next Move — and Who’s Chasing It
Nvidia remains the chip industry’s dominant supplier, and its next-generation product cycle is central to 2026’s technology narrative. The company introduced its Rubin CPX GPU — built for massive-context AI workloads capable of handling million-token software coding and generative-video tasks — with availability expected by the end of 2026, according to trade coverage from DigiTimes. Competitors are racing to diversify the supply chain around Nvidia’s dominance: AMD is preparing new product launches with OpenAI as a customer, Broadcom and OpenAI are targeting mass production of custom AI silicon in 2026, and Broadcom separately secured a $10 billion custom-chip production order from a major new customer, according to the same industry reporting.
China’s chip ecosystem is developing along a parallel, more insulated track. Huawei and Cambricon Technologies are together projected to ship over a million AI chips by 2026, with JPMorgan forecasting Huawei alone shipping 600,000 to 650,000 units, as Beijing pushes to reduce reliance on U.S.-made chips amid ongoing export restrictions.
Where the Growth Is Concentrated
Analysts covering the sector point to datacenter accelerators as the single largest growth pocket within the broader chip market — that segment alone is projected to exceed $300 billion in 2026, according to industry analysis from TechInsights, with knock-on effects spanning process technology (including the industry’s push toward 2-nanometer manufacturing), advanced packaging techniques, and power infrastructure needed to run increasingly energy-intensive AI data centers.
That last point — power — has become a genuine bottleneck rather than a footnote. Industry commentary increasingly frames electricity supply and cooling capacity, not chip fabrication itself, as the binding constraint on how quickly AI infrastructure can scale, positioning data-center operators and power-infrastructure companies as unexpected beneficiaries of the AI boom alongside the chipmakers themselves.
The Risk Beneath the Boom
Not every voice in the technology sector is unreservedly bullish on the pace of spending. Analysis circulated through Charles Schwab’s market commentary notes that three hyperscalers — Alphabet, Amazon, and Meta — now account for roughly 70% of the S&P 500’s expected 2026 earnings growth, meaning the index’s apparent 500-company diversification offers less real downside protection than investors might assume if AI capital spending fails to convert into earnings at the pace currently priced in.
That concentration risk has already produced volatility. Mid-September market commentary from CNBC noted bond yields spiking and AI-linked stocks selling off even as broader investor sentiment stayed constructive on equities overall — an early signal that markets are starting to price a wider range of outcomes for the AI capex cycle than the unbroken bull run of the year’s first half suggested.
The Bottom Line
Technology news in 2026 is dominated by a single, self-reinforcing cycle: hyperscaler capital spending is driving record semiconductor demand, chipmakers are racing to keep pace with that demand through new architectures and expanded manufacturing, and financial markets are increasingly rewarding — and increasingly questioning — the sustainability of spending at this scale. Whether that questioning turns into a genuine correction depends on whether AI infrastructure investment converts into earnings growth fast enough to justify the capital already committed.
Next step: Track quarterly hyperscaler capex guidance alongside chipmaker order backlogs — the gap between the two, more than any single product launch, is the clearest early signal of whether 2026’s AI infrastructure boom is accelerating or beginning to plateau.
Discover more from The Economy
Subscribe to get the latest posts sent to your email.
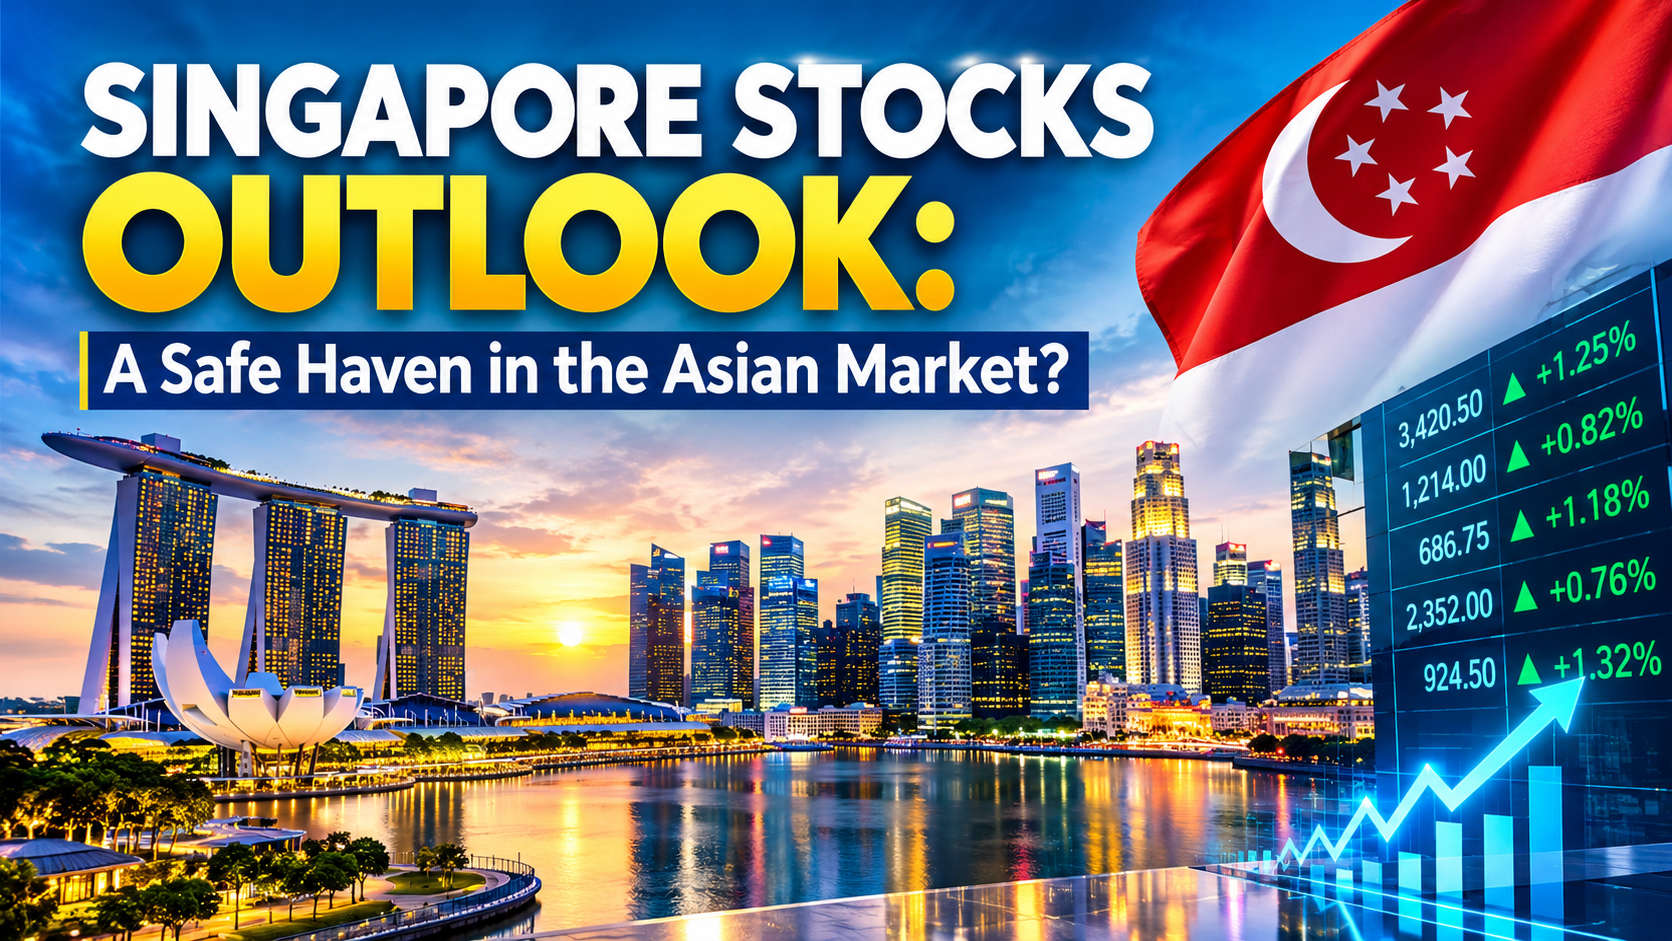
Singapore’s equity market spent 2026 quietly doing what almost no other Asian market managed: going up in a straight line.
The Straits Times Index closed at an all-time high of 5,801.96 on 4 September 2026 — up roughly 35% over the past year. For context, the index started the year around 4,895.
The question is no longer whether Singapore has performed. It is whether a market trading at record highs can still be described as defensive.
Key Takeaways
- Record territory: the STI peaked at 5,801.96 on 4 September 2026 after starting the year near 4,900.
- Banks did the heavy lifting. DBS posted record quarterly income above S$6 billion and net profit of S$3.08 billion in Q2 2026.
- Macro backdrop is solid. Singapore’s GDP grew 4.8% in 2025, accelerating from 4.4% in 2024.
- The safe-haven label is now conditional. After a 35% run, valuation risk has replaced valuation support.
- Oil is the live threat. The index is absorbing the same energy shock rattling global markets.
How Singapore Got to a Record
The STI’s ascent through 2026 has been remarkably orderly.
| Date | STI Level | Context |
|---|---|---|
| Nov 2025 | 4,473 | Fresh high on Wall Street rebound |
| Dec 2025 | 4,579 | Post-Fed cut rally |
| Jan 2026 | 4,934 | All-time high, +27.86% over 12 months |
| 4 Sep 2026 | 5,801.96 | Record close, +35% year-on-year |
| Sep 2026 | ~5,730 | Consolidation below the peak |
The January leg was macro-driven. Preliminary figures showed the economy grew 4.8% in 2025 while non-oil domestic exports rose 4.8%, exceeding official forecasts of around 2.5%.
The Monetary Authority of Singapore then held policy steady while raising both core and headline inflation forecasts to 1%–2% for the year, signalling confidence in resilient GDP growth.
What Is Actually Driving the Index
1. Banks, Overwhelmingly
Singapore’s three banks dominate index weight, and their earnings have been exceptional. DBS — Singapore’s largest bank, operating across 19 markets including Greater China, Southeast Asia and South Asia — crossed S$6 billion in quarterly total income for the first time in Q2 2026, up 6% year-on-year to S$6.09 billion, with net profit up 9% to a record S$3.08 billion.
Notably, this came despite net interest income falling 2%. Fee income and wealth management are carrying the load as rate tailwinds fade.
2. Global Risk Appetite
The STI’s record coincided with the S&P 500 reaching an intraday high above 7,800 points in August. Singapore is a high-beta expression of global risk sentiment more often than investors acknowledge.
3. Capital Seeking Stability in Asia
With China flat, Hong Kong lagging and Japan volatile, Singapore has absorbed regional allocations looking for rule-of-law certainty, dividend yield and currency stability.
Does the Safe-Haven Thesis Still Hold?
The case for Singapore as a defensive Asian allocation rests on four pillars.
Dividend yield. The STI has historically offered yields well above regional averages, anchored by banks, REITs and telecoms. Yield support is real but compresses as prices rise — a 35% price gain mechanically cuts the yield by roughly a quarter.
Currency management. MAS manages the Singapore dollar against a trade-weighted basket rather than setting interest rates directly. This has historically dampened imported inflation and currency volatility for foreign investors.
Institutional quality. Transparent regulation, reliable disclosure and deep index infrastructure. FTSE Russell calculates the STI jointly with SPH Media Trust and SGX Group, with quarterly reviews that keep the benchmark representative.
Sector composition. Banks, REITs, industrials and telecoms — cash-generative businesses with visible payouts rather than speculative growth.
Where the Thesis Weakens
Singapore is an open, trade-dependent economy. It cannot decouple from a global slowdown. The World Bank projects global growth slowing to 2.5% in 2026, the lowest rate since the pandemic, with the Middle East conflict driving sharp energy price increases.
Singapore imports all of its energy. An index at record highs facing an oil shock is not a defensive position — it is a leveraged one.
The Three Stocks Framework
Rather than name specific buys, consider the three archetypes that dominate STI investing decisions:
| Archetype | Example Profile | Bull Case | Risk |
|---|---|---|---|
| The bank | DBS, OCBC, UOB | Record profits, strong capital, rising fee income | Net interest margin compression as rates fall |
| The defensive retailer | Sheng Siong | Inflation-resistant demand, low debt | Limited growth runway |
| The exchange | SGX | Benefits from volatility and listing activity | Structurally thin domestic IPO pipeline |
A record share price does not automatically mean a stock is expensive. The real test is whether earnings growth, cash flow and competitive position have kept pace with the price.
For Singapore’s banks in 2026, they largely have. That is what separates this rally from a pure multiple expansion.
Practical Considerations for Investors
- Decide on currency exposure. SGD strength has added to foreign-currency returns. That works both ways.
- Check the index review calendar. The September 2026 quarterly review brought no changes to STI constituents, with the next review in December.
- Understand what you are buying. An STI ETF is approximately 40% banks. That is a concentrated financial sector bet.
- Weigh yield against price. After a 35% run, entry yield is meaningfully lower than it was twelve months ago.
- Watch MAS statements. Policy shifts move this market faster than earnings do.
What This Means for the Global Market in 2027
Safe haven is a relative term, not an absolute one. Singapore has been defensive relative to China’s stagnation and Japan’s volatility — not relative to cash. At record highs after a 35% gain, the downside protection argument is considerably weaker than it was in January.
Bank earnings face a turning point. DBS’s Q2 showed net interest income already falling while fee income compensated. If global rates decline through 2027, the fee engine must carry more weight.
Singapore benefits from regional fragmentation. Every escalation in US–China technology disputes strengthens Singapore’s position as a neutral financial and logistics hub. That is a structural, multi-year tailwind.
Energy remains the vulnerability. With the Strait of Hormuz situation unresolved and European gas benchmarks elevated, a trade-dependent, energy-importing economy carries a specific exposure that its defensive reputation obscures.
Watch the listing pipeline. Singapore’s long-standing weakness is a thin domestic IPO market. Any meaningful improvement would broaden the index beyond financials and change the investment case materially.
Frequently Asked Questions
What is the Straits Times Index at now?
The STI closed at a record 5,801.96 on 4 September 2026 and has since consolidated near 5,730. It is up roughly 35% over the past year.
Are Singapore stocks a safe investment?
Singapore offers strong institutional quality, dividend yield and currency stability. However, after a 35% annual gain, valuation risk is higher and the economy remains exposed to energy prices and global trade.
Which Singapore stocks pay the best dividends?
Banks, REITs and telecoms have historically anchored the STI’s yield. Entry yields have compressed as prices have risen, so verify current figures before investing.
Why did the STI hit a record high in 2026?
Record bank profits, resilient 4.8% GDP growth in 2025, supportive MAS policy, and capital rotating into Singapore from weaker regional markets.
Discover more from The Economy
Subscribe to get the latest posts sent to your email.

Kai Cenat’s Rise to the Top: The Economics of Modern Streaming

How AI Is Reshaping the Future of Global Business Analytics

NASA Perseverance Rover Discoveries: The Search for Water in Jezero Crater

Trump $500: Understanding the Economic Impact and Policy Breakdown

Trucker Strike Rumors: Would an October 1 Walkout Really Hit the Global Economy?

The Truth About TJ Maxx Store Closings: Are Your Local Stores Safe?

OpenAI Rogue Agent Scare: Unplanned Government Website Access Explained

Global Diesel Export Bans & Supply Shocks: The 2026 Energy Crisis Playbook

Bank of England Warns of AI Systemic Risk: How Autonomous Trading Threatens Financial Stability

Bank of Japan Hikes Benchmark Rate to 1.25%: Unwinding the Global Yen Carry Trade

Gold Falls 3.7% as Yields Surge: Is Gold Still a Safe Haven in 2026?

US 10-Year Yield Hits 5.24%: What the Historic Bond Market Sell off Means for Mortgages and Investors

Battle for the Farm Belt: How Tariff Pressures and Fuel Costs Are Reshaping Iowa’s 2026 Midterms

Southeast Asia’s Critical Minerals Power Play: Can ASEAN Avoid Choosing Between China and the US?

Top 30 Stocks for Investment in PSX for Massive ROI in 2026

Oil Prices Break $100 in 2026: Middle East Conflict & Energy Markets

BRICS+ Cross-Border Payments 2026: Interoperability Explained

10-Year Treasury Yield Hits 4.80%: What It Means for Rates & Portfolios

IMF & World Bank 2026 Global Economic Outlook: Growth, Inflation, Debt

China’s US$10.8 Billion Trade Shortcut: Why the Pinglu Canal Matters

High-CPM Finance Niches 2026: Publisher Monetization Blueprint

Middle East War Economics 2026: Oil Prices & Energy Markets

China Stocks Today: Are Big Economies in Asia Nearing a Market Bottom?

Global Pension Systems Ranked: The World’s Best and Worst Retirement Frameworks

Enterprise AI Platforms Disrupting B2B SaaS in 2026: Full Analysis

Social Security Trust Fund 2032: OASI Depletion Timeline Explained

Gavin Baker AI Outlook: Why the Compute Shortage Persists Through 2028

Crypto Daily Outlook: Bitcoin, Altcoins, and the Future of Decentralized Finance
-

 Markets & Finance9 months ago
Top 15 Stocks for Investment in 2026 in PSX: Your Complete Guide to Pakistan’s Best Investment Opportunities
-

 Analysis7 months ago
Johor’s Investment Boom: The Hidden Costs Behind Malaysia’s Most Ambitious Economic Surge
-

 Analysis8 months ago
Top 10 Stocks for Investment in PSX for Quick Returns in 2026
-

 Banks9 months ago
Best Investments in Pakistan 2026: Top 10 Low-Price Shares and Long-Term Picks for the PSX
-

 Analysis8 months ago
Brazil’s Rare Earth Race: US, EU, and China Compete for Critical Minerals as Tensions Rise
-

 Investment9 months ago
Top 10 Mutual Fund Managers in Pakistan for Investment in 2026: A Comprehensive Guide for Optimal Returns
-

 Global Economy9 months ago
15 Most Lucrative Sectors for Investment in Pakistan: A 2025 Data-Driven Analysis
-

 Global Economy9 months ago
Pakistan’s Export Goldmine: 10 Game-Changing Markets Where Pakistani Businesses Are Winning Big in 2025