
Central Bank
Bank of England Warns of AI Systemic Risk: How Autonomous Trading Threatens Financial Stability

Key Takeaways
- Central Bank Alert: Bank of England leadership explicitly warned that generative and autonomous AI models represent an emerging structural risk to global macro stability.
- Algorithmic Herd Behavior: Highly correlated AI agents processing similar dataset streams risk triggering simultaneous, automated market selloffs.
- Opacity and Black-Box Risks: The lack of algorithmic transparency makes it nearly impossible for financial regulators to predict automated contagion during black-swan events.
- Regulatory Pushback: UK and European regulatory bodies are drafting mandatory operational resilience rules for AI integration within institutional trading desks.
The AI Liquidity Threat: Why Central Bankers Are Concerned
As financial institutions rapidly transition from traditional rule-based quantitative models to autonomous LLMs and deep reinforcement learning agents, the micro-structure of financial markets is undergoing rapid evolution. While AI promises execution speed and micro-inefficiency discovery, central bank watchdogs warn it creates systemic vulnerabilities.
Official statements published directly by the Bank of England detail how autonomous agents operating at microsecond latencies could accelerate market stress into full-blown flash crashes.
              Cascading Risk Mechanics in AI-Driven Markets

  [Exogenous Market Shock]
            |
            v
  [AI Agents Process Identical Datasets Simultaneously]
            |
            v
  [Synchronized Liquidity Withdrawal & Automated Shorting]
            |
            v
  [Self-Reinforcing Feedback Loop / Instant Flash Crash]
Market Structure Breakdown: Traditional Quant vs. Autonomous AI
As highlighted in technology reports from CNBC, the primary structural distinction between legacy quantitative algorithms and modern autonomous AI lies in adaptability and model opacity.$$\text{Systemic Risk Index} = f(\text{Execution Speed}, \text{Algorithmic Correlation}, \text{Model Opacity})$$
Legacy algorithmic trading followed rigid “if-then” rules programmed by human quantitative traders. Modern AI agents continuously rewrite their internal decision logic based on incoming social media sentiment, news feeds, and order-book imbalances. When thousands of independent AI trading agents converge on similar decision-making parameters, market liquidity can evaporate in milliseconds.
Primary Risk Vectors Identified by Regulators:
- Correlated Model Bias: Because major financial institutions fine-tune models using similar financial datasets, AI models develop identical market blind spots.
- Hallucination-Driven Market Panics: Autonomous news-scraping models risk interpreting false or hallucinated news reports as actionable market signals, executing massive sell orders instantly.
- Regulatory Arbitrage: AI trading models automatically detect and exploit gaps between different national regulatory frameworks, bypassing capital control barriers.
Institutional Adoption vs. Systemic Risk Exposure
Financial analysis from the Financial Times illustrates the speed at which institutional asset managers are integrating autonomous execution infrastructure into high-frequency operations.
AI Integration in Financial Infrastructure
| Financial Function | AI Adoption Rate (2026) | Primary Risk Horizon | Regulatory Oversight Level |
| High-Frequency Execution | $84\%$ | Ultra-Fast Flash Crashes | High (MiFID II / FCA Guidance) |
| Credit Underwriting | $62\%$ | Automated Algorithmic Bias | Moderate (Consumer Protection) |
| Fraud Detection | $91\%$ | False Positives / System Lockout | Low (Internal Controls) |
| Macro Portfolio Hedging | $47\%$ | Sudden Liquidity Withdrawals | Critical (Central Bank Focus) |
Enterprise Risk Mitigation: Building Resilient Markets
To mitigate systemic AI risks without suppressing technological innovation, central banks and institutional firms are adopting defensive frameworks:
- Mandatory Human-in-the-Loop (HITL) Circuit Breakers: Requiring financial institutions to maintain physical execution overrides for autonomous trading engines during high volatility events.
- Algorithmic Stress Testing: Forcing major broker-dealers to subject AI models to simulated market shocks to ensure their decision loops do not execute synchronized liquidity exits.
- Model Explainability Protocols: Instituting strict auditability standards that require institutions to explain the deterministic reasoning behind automated trade executions.
Frequently Asked Questions (FAQ)
How does artificial intelligence threaten global financial stability?
AI threatens stability through correlated decision-making. If major financial institutions use similar AI models trained on similar data, those models may simultaneously sell off assets or withdraw market liquidity during a crisis, triggering severe market crashes before humans can intervene.
What is a “flash crash” in the context of AI trading?
A flash crash is an extremely rapid, deep price drop in a financial market occurring within minutes, often followed by a quick recovery. In AI trading, flash crashes happen when automated execution algorithms process market signals and flood order books with automated sell orders simultaneously.
Are central banks planning to ban AI in stock trading?
No, central banks are not planning total bans. Instead, regulators like the Bank of England, the SEC, and the European Securities and Markets Authority (ESMA) are implementing strict operational resilience rules, algorithmic stress testing, and mandatory “kill switch” mechanisms for automated systems.
Discover more from The Economy
Subscribe to get the latest posts sent to your email.


Key Takeaways
- Historic Policy Shift: The Bank of Japan (BOJ) raised its benchmark interest rate to 1.25%, moving decisively away from decades of near-zero and negative rate regimes.
- Yen Carry Trade Collapse: Institutional investors who borrowed cheap Yen to fund high-yielding global investments are forced to liquidate positions to cover escalating yen liabilities.
- Yen Appreciation: The Japanese Yen (JPY) strengthened sharply against the USD, forcing global macro funds to readjust cross-border leverage.
- Global Volatility: Emerging markets and high-growth US tech equities face short-term selloffs as cross-border foreign capital flows back into Japanese domestic assets.
The End of Cheap Money: Understanding the 1.25% Shift
For nearly three decades, Japan served as the world’s primary provider of low-cost capital. Under prolonged quantitative easing and negative interest rate policies (NIRP), global hedge funds, banks, and corporate treasuries routinely utilized the Yen Carry Trade—borrowing JPY at near-zero interest rates, converting it to USD or EUR, and investing in high-yielding assets like US Treasuries or mega-cap tech stocks.
As analyzed in economic insights from Deloitte, the BOJ’s decision to hike rates to 1.25% effectively dismantles this low-cost liquidity engine.$$\text{Carry Trade Profit} = \text{Foreign Asset Yield} – \text{Japanese Borrowing Rate} \pm \text{Currency Exchange Fluctuation}$$
With Japanese borrowing costs rising to 1.25% and the JPY rapidly appreciating, the net profit margin of these leveraged trades turns negative, triggering rapid automated unwinding.
                  Global Yen Carry Trade Unwinding Mechanics

  [Borrow Low-Cost JPY at 1.25%] ---> [Convert JPY to USD] ---> [Invest in US Tech / Bonds]
               |                                                         |
               v                                                         v
   [BOJ Rate Hike Spikes JPY] <--- [Sell Foreign Assets] <--- [Repay Appreciating JPY Debt]
Global Market Spillover: From Wall Street to Tokyo
The structural impact of the BOJ’s monetary tightening is felt far beyond Tokyo. As Japanese institutional investors—who hold trillions of dollars in foreign sovereign debt—find higher yields domestically, capital repatriates back to Japan.
Financial reporting from the Financial Times highlights that domestic Japanese institutional funds are reallocating back into 10-year Japanese Government Bonds (JGBs), reducing participation in US Treasury auctions.
Cross-Border Capital Realignment:
- US Equities Pressure: High-beta tech stocks that benefited from leveraged carry-trade inflows face liquidity contractions.
- Japanese Banking Sector Surge: Domestic Japanese financial institutions, including major retail banks, enjoy net interest margin expansions for the first time in a generation.
- Emerging Market Stress: Developing nations with high JPY-denominated debt debt services see immediate surges in sovereign repayment obligations.
Economic Metrics: Japan vs. Global Peer Comparison
Asia market tracking from Nikkei Asia illustrates how Japan’s monetary normalization compares with global peer central banks.
Central Bank Policy Matrix 2026
| Central Bank | Benchmark Rate | Policy Stance | 10-Year Sovereign Yield | Currency Trend vs USD |
| Bank of Japan (BOJ) | 1.25% | Hawkish / Tightening | 1.62% | Strong Appreciation |
| US Federal Reserve (Fed) | 3.75% – 4.00% | Hawkish / Restrictive | 5.24% | Range-Bound / Strong |
| European Central Bank (ECB) | 3.25% | Neutral / Holding | 2.85% | Moderate Depreciation |
| Bank of England (BoE) | 4.50% | Cautionary / Restrictive | 4.65% | Slight Depreciation |
Strategic Action Plan for Global Investors
To safeguard investment portfolios against the unwinding of cross-border carry trades, wealth managers recommend three immediate adjustments:
- Reduce Currency-Unhedged Foreign Exposure: Ensure global equity holdings maintain currency-hedging layers to prevent JPY appreciation from eroding capital returns.
- Capitalize on Japanese Financial Equities: Allocate capital toward major Japanese commercial banks and financial insurance firms benefiting directly from local rate expansion.
- Monitor Sovereign Yield Spreads: Track the spread between 10-year JGBs and US 10-year Treasuries; a narrowing spread signals accelerated capital flight back to Tokyo.
Frequently Asked Questions (FAQ)
What is the Yen carry trade and why does the BOJ rate hike destroy it?
The Yen carry trade involves borrowing money in Japan at very low interest rates and investing it in higher-yielding foreign assets (like US stocks or bonds). When the BOJ hikes interest rates to 1.25% and the Yen strengthens, borrowing becomes expensive and liquidations occur, unwinding the trade.
Why did the Bank of Japan raise rates to 1.25% after decades of near-zero rates?
The BOJ raised rates due to sustainable wage growth, persistent domestic inflation above its 2% target, and a desire to stabilize the Yen against severe currency devaluation, which was driving up domestic import costs.
How does the BOJ rate hike impact US stock market liquidity?
When the carry trade unwinds, global hedge funds are forced to sell US equities and other international assets to pay back their JPY-denominated loans. This sudden withdrawal of leverage creates downward price pressure on US stock exchanges.
Discover more from The Economy
Subscribe to get the latest posts sent to your email.
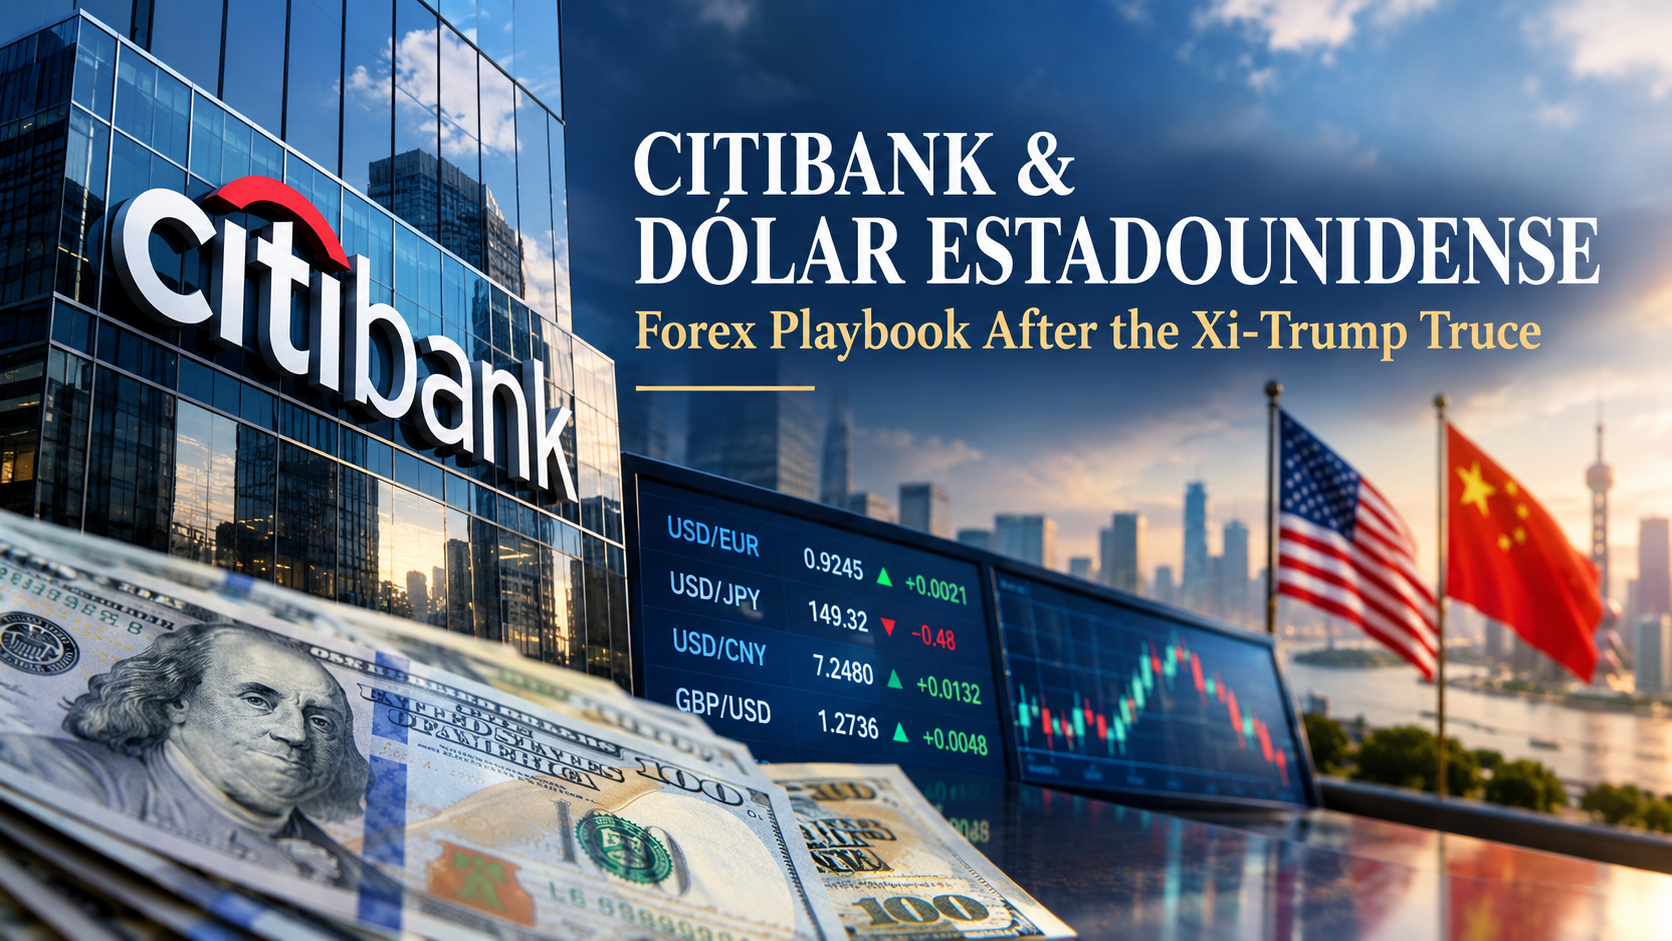
With the September 24, 2026, US-China trade truce extended rather than permanently resolved, Citibank and institutional peers are pricing dólar estadounidense forecasts around a narrow, event-driven volatility window. For cross-border businesses and remittance senders, this compressed timeline shifts the focus from a clean directional currency bet to active hedging ahead of the new Q1 2027 deadline.
Why Citibank Is a Bellwether for Dólar Estadounidense Direction
Citibank’s global markets desk remains one of the most-cited authorities in dollar-peso forecasting due to its dual footprint: a deep US retail and corporate banking presence combined with one of the most extensive correspondent-banking networks across Latin America. When Citibank’s macroeconomic strategists adjust their USD/MXN forecasts, remittance companies, importers, and forex retail platforms typically follow suit within days. Therefore, tracking Citibank’s post-summit positioning offers a highly accurate proxy for where institutional capital expects the dollar to move next.
The September 24 Trade Truce Extension: What Changed
The September 24 Trump-Xi summit at the White House did not yield the durable macroeconomic trade agreement some forex analysts had priced in. Instead, US Treasury Secretary Scott Bessent confirmed a roughly two-month extension of the existing tariff pause, which had been originally set to lapse in November 2026. Analysts at preview briefings—including China specialists at CSIS—had already flagged rare-earth export controls and AI technology restrictions as the most difficult hurdles, which proved accurate.
For currency desks, an “extension-without-resolution” sends a specific technical signal: it eliminates the tail risk of an immediate, severe trade-war escalation, but maintains the uncertainty premium that emerging market currencies have priced in since the spring. This explains the sharp, localized spike in the USD/MXN pair following the September 24 announcement, as traders unwound overly optimistic positions and re-priced for continued negotiations.
Dólar Estadounidense: Current Post-Summit Positioning
Data updated as of late September 2026.
| Metric | Current Reading / Forecast | Market Context |
| USD/MXN Spot Rate | ~17.65–17.70 pesos per dollar | Spiked from 16.95 in mid-September following the Sept 24 summit. |
| USD 12-Month Change vs. Peso | Dollar down ~2% year-over-year | Late September volatility has narrowed the dollar’s YOY deficit. |
| Citi Analyst Survey (Year-End 2026) | ~17.50 pesos per dollar | Indicates expectations of slight stabilization. |
| Monex House Forecast (2026) | ~17.80 pesos per dollar | Pricing a higher geopolitical risk premium into Q4. |
Sources: Banxico FIX rate reporting; Citi Encuesta de Expectativas survey of 37 institutions; Monex economic research.
Why the Peso Remained Historically Strong in 2026
Despite the immediate post-summit dollar spike, the peso mexicano has maintained a broader resilience through much of 2026. Three macroeconomic forces explain this dynamic:
- Persistent Carry-Trade Demand: Even with central bank adjustments, Mexico’s benchmark interest rate remains significantly higher than the US Federal Reserve’s rate. This spread keeps peso-denominated sovereign debt highly attractive to yield-seeking capital.
- Resilient Remittance and Nearshoring Flows: Despite US-China trade friction, North American supply chain integration (nearshoring) and the US-Mexico goods trade have remained robust, ensuring structural dollar inflows into Mexico.
- A Weaker Broad Dollar Trend: Tied to the broader Fed easing cycle, the dollar has occasionally softened against a basket of global currencies, limiting its ability to achieve runaway momentum against the peso.
Citibank’s Forex Playbook for the Rest of 2026
Institutional desks like Citibank are advising corporate clients to treat the current Q4 window as a critical hedging opportunity rather than a speculative directional bet. With the new truce deadline landing in the opening weeks of Q1 2027, volatility will likely cluster around that date regardless of the ultimate macroeconomic outcome.
Practical takeaways for cross-border exposure:
- Lock in Forward Contracts: Secure forex pricing before the Q1 2027 truce deadline if your business has scheduled cross-border payments in that window.
- Monitor the 10-Year Treasury Yield: Yields have acted as a more responsive, real-time indicator of trade-risk pricing this year than delayed central bank statements.
- Track the Remittance Corridor: Treat US-Mexico remittance-corridor pricing as directional context; it is one of the most liquid, closely watched proxies for broader dollar sentiment.
Q4 2026 to Q1 2027 Predictive Scenarios
| Scenario | Anticipated USD/MXN Path | Market Probability |
| Base Case: Truce holds into Q1 2027, talks continue | Peso stabilizes near the 17.40–17.70 range | Highest |
| Tail Risk: Truce collapses before the new deadline | Dollar spikes toward 18.50+ on safe-haven risk-off flows | Moderate |
| Bullish Surprise: Durable US-China deal reached | Peso strengthens back toward 16.50–16.90 | Low (Near-term) |
Frequently Asked Questions
What is the dólar estadounidense worth in pesos today?
Following the late-September 2026 summit volatility, the dollar is trading in the 17.65–17.70 peso range, up from sub-17.00 levels earlier in the month. Because forex markets fluctuate continuously, always confirm against Banxico’s FIX rate or a live institutional feed before executing a transfer.
Why does a US-China summit affect the Mexican peso?
While Mexico is not a direct party to the Xi-Trump negotiations, US-China trade tension directly impacts the broad US dollar index and global risk appetite. These macroeconomic shifts immediately spill over into every dollar-paired emerging market currency, including the highly liquid Mexican peso.
Is now a good time to send money via the US-Mexico remittance corridor?
For dollar earners sending money to Mexico, the late-September bump to ~17.67 pesos per dollar offers slightly better purchasing power than the mid-September lows. However, timing depends heavily on individual cash-flow needs rather than attempts to perfectly time geopolitical news cycles.
Discover more from The Economy
Subscribe to get the latest posts sent to your email.
Stagfaltion
Stagflation vs. Soft Landing: How Central Bank Rates Are Reshaping European and Asian Economies
Fed hiked, ECB hiked, BoE held 6-3, BoJ next. Inside the most divergent central bank week since 2022 and what it signals for stagflation risk.
Executive Summary / Key Takeaways
- Four major central banks moved within eight days: the ECB raised its deposit rate to 2.5% on 10 September, the Fed hiked to 3.75%–4.00% on 16 September, the Bank of England held at 3.75% on a 6-3 vote on 17 September, and the Bank of Japan is expected to move on 18 September.
- UK inflation has hit a five-month high of 3.1%, with the BoE warning it is likely to rise further over coming quarters.
- The Bank of England also announced an unexpected plan to sell £146 billion of UK government bonds directly to the Treasury to complete quantitative tightening.
- This is a supply-shock tightening cycle, not a demand-driven one — which is precisely what makes the stagflation question live.
- The soft-landing case rests on strong productivity and AI-driven capital investment; the stagflation case rests on energy prices that have not normalised.
1. Introduction & Immediate Context
Central banks almost never tighten into an energy shock. Doing so risks amplifying the output loss while doing little to address the price source. Over eight days in September 2026, three of the world’s four largest monetary authorities did exactly that — and the fourth is expected to follow.
The sequencing matters. The ECB raised its main rates by a quarter point at its 10 September meeting, lifting the deposit rate from 2.25% to 2.5%, and said inflationary pressures arising from the conflict in the Middle East would contribute to inflation remaining above its 2% target for an extended period, according to the House of Commons Library. That followed a June increase of the same size. The Fed moved on 16 September. The Bank of England broke the pattern on 17 September by holding.
For CFOs and macro investors the question is no longer whether policy is restrictive. It is whether restriction is being applied to the right problem.
2. Core Market / Strategic Analysis
2.1 The September policy grid
| Central Bank | Decision | Policy Rate | Vote / Signal | Source |
|---|---|---|---|---|
| Federal Reserve (16 Sep) | +25 bps | 3.75%–4.00% | Unanimous 12-0; 16 of 18 see another hike | Federal Reserve |
| ECB (10 Sep) | +25 bps | 2.50% deposit rate | Second hike since June 2026 | Commons Library |
| Bank of England (17 Sep) | Hold | 3.75% | 6-3, three voting for 4.00% | Euronews |
| Bank of Japan (18 Sep) | Expected +25 bps | 1.00% → 1.25% expected | Hike priced near certainty | FXStreet |
2.2 Why the Bank of England blinked — and why three members did not
The MPC voted six to three to leave borrowing costs unchanged, with the dissenting trio pushing for a quarter-point increase to 4%, Euronews reported. The energy shock from the Iran war has pushed UK inflation to a five-month high of 3.1%. The Committee said inflation is likely to rise further over coming quarters, pointing to crude and refined energy prices that have climbed again since its last meeting and remain more volatile and higher than pre-conflict levels.
That is a central bank telling markets it expects to miss its target by a widening margin — and choosing not to act. Bank Rate has stood at 3.75% since December 2025 following six consecutive quarter-point cuts, and the July meeting produced the same hawkish 6-3 split.
The balance-sheet news was the genuine surprise. Alongside the rate decision the Bank announced an unexpected plan to sell £146 billion of UK government bonds directly to the Treasury, Invezz reported. The proposal is intended to help complete quantitative tightening and could ease some pressure on the gilt market, though it requires the chancellor’s approval. The MPC is already reducing its asset purchase programme from a peak of £895 billion to £489 billion as of 9 September 2026.
Read together, the two decisions are coherent: hold the price of money steady, but remove duration risk from the market through a different channel.
2.3 Asia’s mirror-image problem
Japan’s position inverts everyone else’s. Its ultra-low rates financed trillions of dollars in global investment for more than a decade, making the yen one of the world’s cheapest funding currencies — an advantage that may be entering a new phase as the BoJ tightens again, FXStreet noted.
The carry-trade unwind is not a Japanese story. It is a global liquidity story, and it has already shown up in the US long end: the 10-year Treasury yield briefly crossed 5% in mid-September, driven by a combination of surging oil prices, a hotter-than-expected August CPI, heavy bond issuance and a possible unwinding of the yen carry trade as Japanese rates rise.
3. Structural Drivers and Competitor Gaps
The stagflation-versus-soft-landing frame is usually argued with sentiment. The honest version requires separating two questions.
Question one: is the inflation demand-driven? Largely not. The ECB, BoE and Fed all attribute the current impulse to energy. The IMF’s July update expects global inflation to pause its steady decline. Tightening against a supply shock compresses demand without addressing supply, which is the textbook path to a growth-inflation squeeze.
Question two: is the supply side strong enough to absorb it? Here the evidence cuts the other way. The Fed’s own statement describes productivity growth as strong and capital investment as robust, with domestic spending resilient. The IMF notes that accelerated demand-driven momentum in the global technology cycle, driven by AI advances and adoption, is partly offsetting the war’s effects.
That is the crux. A genuine stagflation requires weak supply-side growth alongside high inflation. What the data currently show is high inflation alongside unusually strong productivity and investment — an unusual and unstable combination, but not classic stagflation.
Three markers will resolve it:
- Whether energy prices normalise. Oil trading solidly above $100 per barrel around the Fed decision, per Yahoo Finance, keeps the shock live. The World Bank’s 2027 recovery scenario assumes it fades.
- Whether second-round effects appear in wages. The BoE explicitly flagged the risk of higher energy prices transmitting into household costs, wages and broader inflation.
- Whether the AI capex cycle holds. Both the IMF and the World Bank treat broader AI adoption as the principal upside risk to growth. If technology investment slows, the offset disappears and the stagflation case strengthens sharply.
4. Key Implications for Stakeholders
Corporate CFOs in Europe. Euro-area policy is still the loosest of the major blocs at a 2.5% deposit rate, but the ECB has now hiked twice since June and expects above-target inflation for an extended period. Refinancing windows are narrowing; the argument for terming out debt in Q4 2026 rather than waiting for 2027 is stronger than it was in June.
UK-exposed borrowers. A held Bank Rate does not mean held borrowing costs. With the MPC expecting inflation to rise further and three members already voting to hike, the November meeting is genuinely live. The £146 billion gilt transfer, if approved, is the variable to watch for long-end pricing.
Asian exporters. Yen weakness following the Fed’s decision improved the earnings outlook for Japan’s export-focused industries — but a BoJ hike cuts the other way. Currency hedging assumptions built on a persistently cheap yen need revisiting.
Multi-asset allocators. Divergence itself is the tradeable feature. The Fed is tightening into strength, the ECB into weakness, the BoE is paralysed by a split committee, and the BoJ is normalising from a near-zero base. Relative-value positioning in rates is more attractive than directional duration.
5. Frequently Asked Questions
Q1: Is the global economy heading into stagflation in 2026?
Not on current data. Inflation is elevated and energy-driven, but productivity growth and capital investment remain strong, which classic stagflation requires to be weak. The risk rises materially if the AI-led investment cycle slows while energy prices stay high.
Q2: Why did the Bank of England hold while the Fed and ECB hiked?
The MPC voted 6-3 to hold at 3.75% despite inflation hitting a five-month high of 3.1%, judging that the energy-driven inflation impulse did not yet warrant tightening. Three members dissented in favour of a quarter-point rise to 4%.
Q3: What is the ECB’s current interest rate?
The ECB raised its deposit rate to 2.5% on 10 September 2026, its second quarter-point increase since June. Its next scheduled policy meeting concludes on 29 October.
Q4: How does the Bank of Japan’s decision affect global markets?
A BoJ hike raises the cost of yen funding, which has underpinned global carry trades for over a decade. The unwind has already contributed to higher long-dated yields in the US and Europe.
Discover more from The Economy
Subscribe to get the latest posts sent to your email.

Bank of England Warns of AI Systemic Risk: How Autonomous Trading Threatens Financial Stability

Bank of Japan Hikes Benchmark Rate to 1.25%: Unwinding the Global Yen Carry Trade

Gold Falls 3.7% as Yields Surge: Is Gold Still a Safe Haven in 2026?

US 10-Year Yield Hits 5.24%: What the Historic Bond Market Sell off Means for Mortgages and Investors

Battle for the Farm Belt: How Tariff Pressures and Fuel Costs Are Reshaping Iowa’s 2026 Midterms

Southeast Asia’s Critical Minerals Power Play: Can ASEAN Avoid Choosing Between China and the US?

MAS Allocates S$1.45 Billion to Five Asset Managers in Third EQDP Batch: Total Deployment Reaches S$5.4 Billion

Beyond Singapore’s Borders: How Squeezed SMEs Can Unlock High-Yield Growth Across ASEAN

Bank Jago’s Wealth Management Push:Indonesia’s 31.1 Million Investors boom

Beyond the Four-Year Degree: The $100K+ Trade Careers Young Americans Are Overlooking

SpaceX Starship Achieves First Full Orbit on Historic 10-Hour Test Flight 14

Google’s $15B Finland AI Investment: Data Centers, Nuclear Power & Jobs

Fast Invoice Factoring: Rates, APR Math & Contract Traps

SOC 2 Type II Guide: Cost, Timeline & Compliance Companies

Top 30 Stocks for Investment in PSX for Massive ROI in 2026

Oil Prices Break $100 in 2026: Middle East Conflict & Energy Markets

BRICS+ Cross-Border Payments 2026: Interoperability Explained

Fidelity Investments Review 2026: SPAXX Yields & Zero-Fee Funds

10-Year Treasury Yield Hits 4.80%: What It Means for Rates & Portfolios

IMF & World Bank 2026 Global Economic Outlook: Growth, Inflation, Debt

Shein Clothes Quality & Safety in 2026: What Lab Tests Show

China’s US$10.8 Billion Trade Shortcut: Why the Pinglu Canal Matters

High-CPM Finance Niches 2026: Publisher Monetization Blueprint

Middle East War Economics 2026: Oil Prices & Energy Markets

China Stocks Today: Are Big Economies in Asia Nearing a Market Bottom?

Global Pension Systems Ranked: The World’s Best and Worst Retirement Frameworks

Social Security Trust Fund 2032: OASI Depletion Timeline Explained

Enterprise AI Platforms Disrupting B2B SaaS in 2026: Full Analysis
-

 Markets & Finance9 months ago
Top 15 Stocks for Investment in 2026 in PSX: Your Complete Guide to Pakistan’s Best Investment Opportunities
-

 Analysis7 months ago
Johor’s Investment Boom: The Hidden Costs Behind Malaysia’s Most Ambitious Economic Surge
-

 Analysis7 months ago
Top 10 Stocks for Investment in PSX for Quick Returns in 2026
-

 Banks9 months ago
Best Investments in Pakistan 2026: Top 10 Low-Price Shares and Long-Term Picks for the PSX
-

 Analysis8 months ago
Brazil’s Rare Earth Race: US, EU, and China Compete for Critical Minerals as Tensions Rise
-

 Investment9 months ago
Top 10 Mutual Fund Managers in Pakistan for Investment in 2026: A Comprehensive Guide for Optimal Returns
-

 Global Economy9 months ago
15 Most Lucrative Sectors for Investment in Pakistan: A 2025 Data-Driven Analysis
-

 Global Economy9 months ago
Pakistan’s Export Goldmine: 10 Game-Changing Markets Where Pakistani Businesses Are Winning Big in 2025