
Business
SOC 2 Type II Guide: Cost, Timeline & Compliance Companies

A first SOC 2 Type II report costs most enterprise-bound startups between $30,000 and $150,000 all-in, takes roughly nine to fifteen months from kickoff to signed opinion, and arrives as an attestation from a licensed CPA firm rather than a “certification” in the strict sense. The audit fee itself is usually the smaller part of the bill. Tooling, remediation and internal engineering time decide whether you land at the bottom or the top of that range.
Cost figures in this guide come from published 2025-2026 benchmarks by Drata, Secureframe, StrongDM and Thoropass. Standards references come from the AICPA. Ranges are directional; get three written quotes before you commit budget.
Executive Summary & Core Benchmarks
The table below consolidates the numbers finance and security leaders ask for first.
| Metric | 2026 Benchmark | Notes |
|---|---|---|
| First-year all-in cost (10-200 employees) | $30,000-$150,000 | Includes platform, auditor, readiness, pen test, remediation and internal labor |
| Type I audit fee only | $5,000-$20,000 | Point-in-time design test (Secureframe) |
| Type II audit fee only | $12,000-$100,000+ | Scales with scope, observation length and auditor tier (Drata) |
| Observation window | 3-12 months | Buyers commonly expect six months or more |
| Renewal year cost | $25,000-$75,000 | One-time setup costs drop away |
| Audit fee as share of total spend | ~30-40% | Tooling, remediation and labor make up the rest (Zip Security) |
| Big Four engagement | $100,000+ | Premium pricing for complex scopes (Thoropass) |
| Core alternatives | ISO/IEC 27001, HITRUST, SOC 2+ | Buyer questionnaire may accept one or the other |
Key takeaway: SOC 2 is a revenue-unlock expense. Budget it against the enterprise ARR it makes closable, not against your security line item.
1: Strategic Overview & Commercial Drivers
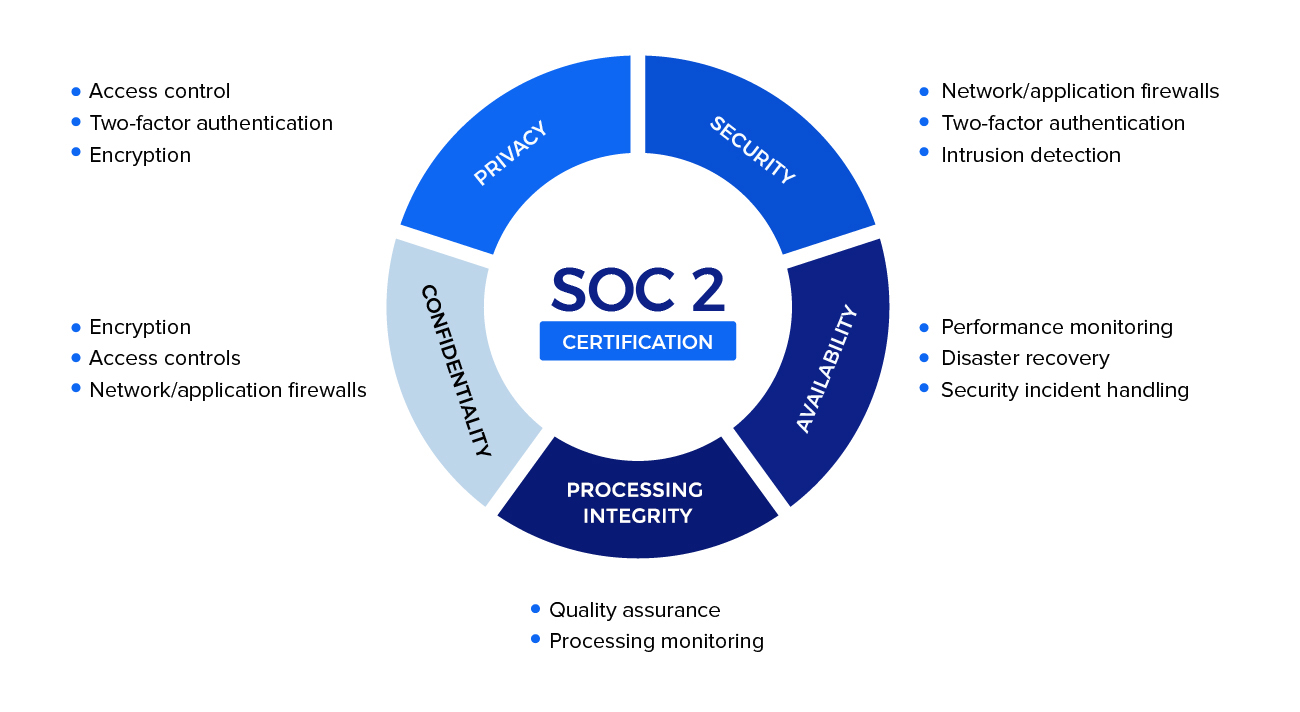
SOC 2 is an auditing framework maintained by the American Institute of CPAs. An independent CPA firm tests a service organization’s controls against the Trust Services Criteria: Security, Availability, Processing Integrity, Confidentiality and Privacy. TechTarget’s SOC 2 definition walks through the criteria structure.
Security, also called the Common Criteria, is mandatory in every report. The other four are optional. Most first-time SaaS reports scope Security only, then add Availability or Confidentiality when a customer contract requires it.
The result is a report, not a certificate. That distinction matters in procurement language. Say “SOC 2 Type II report” in contracts and RFP answers.
Why enterprise buyers demand it
Vendor-risk teams use SOC 2 as a fast filter. A Fortune 500 security questionnaire can run to hundreds of questions. A clean Type II report lets the buyer skip most of them.
The commercial triggers repeat across startups:
- Procurement adds SOC 2 to the mandatory-vendor checklist.
- A large deal stalls at security review.
- Cyber insurers or acquirers ask for proof of controls during diligence.
- A competitor’s incident makes buyers nervous.
Unit economics of waiting
The cost of not having a report is a delayed sales cycle. Model it explicitly.
Cost of Delay = Blocked Pipeline ARR × Gross Margin × (Months Delayed ÷ 12)
An illustrative example: $2,000,000 of blocked pipeline at 80% gross margin, delayed nine months, forfeits about $1,200,000 of first-year gross profit. Against that, a $90,000 program looks cheap. Your own numbers will differ, but the shape of the argument rarely does.
Type I versus Type II: which one closes deals
A Type I report evaluates whether controls are designed appropriately at one moment in time. A Type II report tests whether those controls operated effectively across an observation period. Enterprise buyers usually want Type II. Type I works as a bridge.
A common sequencing strategy is to complete Type I in three to four months, start the Type II observation period immediately, and show the Type I report to prospects while the Type II clock runs.
2: Comprehensive Evaluation Matrix
“SOC 2 compliance companies” covers three different vendor categories. Buyers often compare them as if they were the same product. They are not.
- Compliance automation platforms collect evidence, monitor controls and manage policies. Named examples in published cost guides include Drata, Secureframe, Thoropass, Sprinto and Scrut.
- CPA audit firms issue the opinion. Independent firms such as Linford & Co sit alongside Big Four practices.
- Readiness consultants run gap assessments and remediation projects.
Only the CPA firm can issue the report. Platforms cannot.
Table 1: Delivery model comparison
| Delivery model | First-year all-in cost | Typical internal effort | Audit fee range | Best fit |
|---|---|---|---|---|
| DIY with spreadsheets | $20,000-$60,000 plus heavy labor | Highest; 2-3x engineer time per one published estimate | $10,000-$40,000 | Very small teams with security expertise |
| Automation platform + independent CPA | $30,000-$100,000 | Moderate | $10,000-$50,000 | Most seed to Series B SaaS companies |
| Platform bundled with audit partner | Lower cash outlay, tiered by headcount | Moderate | Bundled | Teams wanting a single invoice |
| Big Four or large firm | $100,000+ | Moderate to high | $50,000-$100,000+ | Regulated buyers demanding brand name |
Published headcount-based ranges vary by source. Sprinto reports a first report at $6,000-$60,000 for companies under 500 people covering platform and audit only, excluding your team’s time. Zip Security models a 20-person startup near $46,500 and a 150-person SaaS company adding Availability near $162,500.
Why do these disagree? Each source defines “cost” differently. Some exclude labor. Some include remediation. Always ask what a number covers.
Table 2: Type I versus Type II
| Dimension | Type I | Type II |
|---|---|---|
| What it tests | Control design at a point in time | Control design and operating effectiveness over time |
| Audit fee | ~$5,000-$20,000 | ~$12,000-$100,000+ |
| Evidence required | Point-in-time snapshots | Continuous evidence across observation window |
| Enterprise acceptance | Stepping stone | Widely expected |
| Timeline | ~3-4 months | 3-12 month window plus fieldwork of roughly 4-8 weeks |
3: Step-by-Step Implementation & Procurement Blueprint
Use this sequence to avoid the two most expensive mistakes: over-scoping and starting the observation window before controls are stable.
Decision flow
- Confirm who is asking. Read the buyer’s security addendum. Does it say Type I, Type II, or “SOC 2”? Does it name specific criteria?
- Scope Security only unless a contract says otherwise. Every additional criterion adds audit scope. One published estimate puts the increase at 15-25% per added criterion (Petronella).
- Define system boundaries. List the production systems, data stores, vendors and people in scope.
- Run a readiness assessment. Budget $5,000-$15,000 if outsourced. Catching gaps here is cheaper than qualified findings later.
- Select tooling. Pick a platform that integrates with your cloud provider, identity provider, HRIS and ticketing system.
- Select the auditor separately. Interview at least three CPA firms. Ask about observation-window flexibility, fieldwork timeline and report turnaround.
- Remediate. Close access-control, logging, change-management and vendor-management gaps before the window opens.
- Open the observation window. Freeze the control set. Avoid mid-window architecture changes.
- Collect evidence continuously. Assign a single control owner per domain.
- Complete fieldwork and review the draft report. Check the system description and management assertion carefully.
- Publish under NDA. Share the report through a trust center or controlled data room.
Risk mitigation checks
- Before signing the auditor: confirm they are a licensed CPA firm. Only a CPA firm can issue a SOC 2 opinion.
- Before opening the window: run a mock evidence pull. If it takes more than a few hours, controls are not ready.
- Before fieldwork: reconcile the user-access list against HR records. Access reviews are a frequent source of exceptions.
- Before publishing: confirm the opinion type. An unqualified opinion is the target.
Skip the tool-comparison spreadsheet. See side-by-side SOC 2 platform demos matched to your headcount and stack. Book a comparison
4: Cost Analysis, Contract Traps & ROI Mathematics
Full cost stack
| Line item | Typical range | Source signal |
|---|---|---|
| Readiness or gap assessment | $5,000-$25,000 | Thoropass; $0 if done internally |
| Compliance automation platform (annual) | $6,000-$25,000 | Varies by headcount and vendor |
| Type II audit fee | $12,000-$100,000+ | Drata |
| Penetration test | $5,000-$15,000 | Often demanded by customers even if not strictly required |
| Consultant support | $5,000-$25,000+ | Needed when the team lacks SOC 2 experience |
| Remediation and tooling upgrades | $5,000-$250,000+ | Widest variance; depends on existing maturity |
| Internal labor | 4-6 months of a project owner at 50-100% time | The largest hidden cost |
Type I auditor fees in StrongDM’s estimate sit at $12,000-$17,000, while the same guide puts a full first-year cost at roughly $147,000 once lost productivity and new tooling are counted.
The master formula
First-Year SOC 2 Cost = Platform + Auditor + Readiness + Pen Test + Tooling Upgrades + Remediation + (Internal Hours × Loaded Hourly Rate)
Run it twice: once with your lowest quotes, once with the highest. The gap between the two outcomes is your budget risk.
Contract traps and hidden fees
Read the engagement letter and platform order form for these items:
- Scope creep pricing. Adding a criterion mid-engagement can reprice the entire audit.
- Observation-window changes. If you extend the window, confirm whether the auditor charges again.
- Subprocessor and cloud-region additions. New systems in scope may trigger additional fieldwork hours.
- Auto-renewal terms. Platform contracts often renew annually. Set calendar reminders 90 days out.
- Per-seat tooling. MDM, EDR and identity tools can add per-employee charges that scale with hiring.
- Audit-partner network pricing. Platform-bundled auditors may be cheaper, but you have less leverage over timeline.
- Report reissue fees. Ask what it costs to add a bridge letter or reissue a report.
These are negotiation checkpoints drawn from practitioner guidance, not universal contract terms. Your paper may differ.
ROI mathematics
Payback Period (months) = First-Year SOC 2 Cost ÷ (Monthly Enabled Gross Profit)
Enabled Gross Profit = Deals Unlocked × Average ACV × Gross Margin
Illustrative model: a $90,000 program that unlocks three deals at $150,000 ACV and 80% gross margin creates $360,000 of annual gross profit. The program pays back in about three months of that profit stream. Add reduced questionnaire hours as a secondary benefit.
Automation platforms claim savings of 30-50% on total compliance costs through evidence automation (Drata). Treat vendor claims as upper bounds and validate against a pilot.
Year-two economics
Renewal costs drop to $25,000-$75,000 in one published range, and one estimate suggests year-two spend can run 40-60% below year one when automation stays in place (Zip Security). The savings come from eliminated setup work.
5: Regulatory Compliance & Industry Standards
SOC 2 is voluntary. No statute requires it. Contracts, customers and insurers do.
The governing framework
The AICPA SOC 2 resource hub lists the 2017 Trust Services Criteria (with revised points of focus, 2022) and the SOC 2 description criteria. The AICPA also publishes the description criteria used to evaluate your system description.
The criteria align to the COSO framework’s 17 principles, with supplemental criteria covering logical and physical access, system operations, change management and risk mitigation, as summarized on Wikipedia’s SOC overview.
The Common Criteria run from CC1 through CC9:
- CC1: Control environment
- CC2: Communication and information
- CC3: Risk assessment
- CC4: Monitoring activities
- CC5: Control activities
- CC6: Logical and physical access
- CC7: System operations
- CC8: Change management
- CC9: Risk mitigation
Attestation standards
Type II reports are issued under AICPA attestation standards. The AICPA’s illustrative Type 2 report is designed to meet SSAE-21 reporting requirements, as noted in its SOC 2 resource listing.
Mapping to other frameworks
Enterprises rarely stop at one framework. The AICPA publishes crosswalks mapping the Trust Services Criteria to NIST 800-53 and other frameworks on its mappings page. If a buyer requires ISO/IEC 27001 or NIST alignment, ask your platform to reuse evidence across frameworks.
Data governance
Your system description must state which data types you handle, how you retain and dispose of them, and which subservice organizations touch them. Vendor management is a frequent weak point. Keep vendor SOC reports current.
Need ISO 27001 or HITRUST too? Multi-framework programs reuse evidence and cut duplicate audit spend. Get a multi-framework quote
6: Enterprise Frequently Asked Questions (FAQ)
How much does a SOC 2 Type II audit cost in 2026?
The audit fee alone commonly ranges from about $12,000 to $100,000+ depending on scope, observation length and auditor tier. All-in first-year cost, including tooling, readiness, pen testing, remediation and internal labor, typically lands between $30,000 and $150,000 for startups. Big Four engagements for complex scopes can exceed $100,000 for the audit alone.
How long does it take to get a SOC 2 Type II report?
Plan for nine to fifteen months if you start from zero. That estimate combines readiness and remediation, an observation window that most enterprise buyers want at six months or longer, and several weeks of auditor fieldwork and reporting. Completing a Type I first can give sales a bridge document sooner.
Is SOC 2 the same as SOC 2 certification?
No. SOC 2 produces an attestation report from a licensed CPA firm. It is not a certificate like ISO/IEC 27001. Use “SOC 2 Type II report” in contracts and customer communications.
Which Trust Services Criteria do we need?
Security is required in every SOC 2 report. Availability, Processing Integrity, Confidentiality and Privacy are optional and depend on your service commitments and customer contracts. Start with Security unless a signed contract or RFP says otherwise, because each added criterion increases audit scope and cost.
Discover more from The Economy
Subscribe to get the latest posts sent to your email.



A single slip-and-fall lawsuit against an uninsured small business can wipe out years of profit in one settlement — yet a large share of small business owners still operate without even basic general liability coverage, often simply because no one ever explained clearly what’s actually required versus optional.
Business insurance isn’t a single product — it’s a category spanning general liability, workers’ compensation, professional liability, commercial property, and more, each protecting against different risks. Figuring out which coverage your specific business actually needs, and what it should reasonably cost, is one of the most commonly delayed and misunderstood decisions small business owners face.
This guide breaks down the core types of business insurance, current 2026 cost benchmarks, and how to build the right coverage package without overpaying.
How Business Insurance Actually Works: The Core Coverage Types
Most small businesses don’t need every type of commercial insurance — the right combination depends heavily on industry, whether you have employees, and whether you interact with the public or handle client data.
Key takeaway: General liability insurance isn’t legally required in most states, but it’s often necessary to secure a client contract, obtain a business license, or sign a commercial lease — meaning many business owners end up needing it as a practical requirement of doing business, even without a legal mandate.
The Core Business Insurance Types
- General liability insurance — covers third-party bodily injury, property damage, and personal injury claims arising from your business operations.
- Workers’ compensation insurance — required in most states once you hire employees, covering medical costs and lost wages for work-related injuries.
- Professional liability insurance (errors & omissions) — protects service-based businesses against claims of negligence, mistakes, or failure to deliver promised services.
- Commercial property insurance — covers physical business assets (equipment, inventory, the building itself) against fire, theft, and other covered perils.
- Business Owner’s Policy (BOP) — bundles general liability and commercial property coverage into a single, typically discounted policy.
- Cyber liability insurance — increasingly essential for businesses handling customer payment data or sensitive personal information.
Step-by-Step: Building Your Business Insurance Package
- Assess your specific risk profile — client-facing businesses, those with employees, and those handling sensitive data each face different primary risks.
- Determine legal and contractual requirements — workers’ comp is state-mandated once you have employees, and many commercial leases and client contracts require proof of general liability coverage.
- Get quotes for a Business Owner’s Policy first, since bundling liability and property coverage is typically more cost-effective than purchasing separately.
- Add specialized coverage as needed — professional liability for advice-based businesses, cyber liability for data-handling businesses, commercial auto for businesses with vehicles.
- Review coverage limits against your actual risk exposure, not just the cheapest available policy, since underinsurance can be as costly as no insurance in a serious claim.
- Reassess annually as your business grows, since coverage needs — and available discounts — change as revenue, staff count, and operations evolve.
Financial and Strategic Implications: 2026 Business Insurance Cost Benchmarks
Costs vary substantially by industry, business size, and claims history, but understanding typical ranges helps set realistic budget expectations.
| Coverage Type | Typical Monthly Cost (2026) | Notes |
|---|---|---|
| General liability insurance | $40–$100/month for most small businesses | Median new-customer rate around $55/month per Progressive Commercial data |
| Workers’ compensation | $45–$70/month median, varies heavily by industry risk | Office-based businesses pay far less than construction or manual-labor industries |
| Business Owner’s Policy (BOP) | $57–$150/month | Bundled liability + property, typically cheaper than separate policies |
| Professional liability (E&O) | Varies by profession and revenue | Higher for advice-heavy professions (consulting, financial services, healthcare-adjacent) |
Expert insight: Most small businesses pay roughly $500 to $2,000 a year for general liability or a BOP, with total costs climbing meaningfully once workers’ compensation, commercial auto, or professional liability are added — meaning a realistic total insurance budget should account for the full coverage stack your business actually needs, not just a single policy.
Why Cost Varies So Much by Industry
A home-based bookkeeper and a residential construction crew face fundamentally different risk profiles, and insurers price accordingly. A small consulting firm with a clean claims history might pay $750 to $1,200 per year for general liability coverage, while a construction company with similar revenue could pay $3,000 to $5,000 or more for the same coverage type, reflecting the materially higher claims frequency and severity in higher-risk industries.
Bundling and Discount Strategies
Bundling multiple policies with a single insurer commonly produces automatic discounts of 10% to 15%, and choosing a higher deductible — when cash flow allows — can meaningfully lower monthly premiums for businesses confident in their ability to absorb a modest out-of-pocket cost in the event of a claim.
How to Choose the Right Business Insurance
- Start with a Business Owner’s Policy if you qualify — most small businesses without significant specialized risk exposure fit within a standard BOP more cost-effectively than piecing together separate policies.
- Don’t skip workers’ compensation once you hire employees — it’s legally required in nearly every state and the penalties for non-compliance can be severe.
- Get quotes from at least three insurers, since — as with other insurance categories — identical coverage can price very differently between carriers for the same business profile.
- Work with an independent broker for complex risk profiles, since brokers can shop multiple insurers and identify industry-specific coverage gaps a single-carrier quote might miss.
- Review your policy annually as your business changes — added employees, new locations, or expanded services can all create coverage gaps if the policy isn’t updated.
- Don’t assume a personal umbrella policy covers business activity — business risks generally require dedicated commercial coverage, and mixing personal and business insurance can leave real gaps.
Key takeaway: The businesses that get burned by inadequate insurance are rarely the ones that skipped coverage entirely — they’re far more often the ones that bought a policy years ago and never revisited it as the business grew, leaving real gaps between what’s covered and what the business now actually does.
Future Outlook: Business Insurance Trends Through 2027
- “Social inflation” continues to pressure premiums upward. Rising litigation costs and larger jury awards continue to put upward pressure on general liability premiums nationally, a trend insurers refer to as social inflation, meaning even businesses with clean claims histories may see gradual rate increases independent of their own risk profile.
- Cyber liability coverage is shifting from optional to expected. As data breach costs and regulatory penalties continue rising, more commercial leases, client contracts, and vendor agreements are beginning to require proof of cyber liability coverage alongside traditional general liability.
- Digital-first insurers continue to compress quote-to-bind timelines. More small business insurance providers now offer instant online quotes and same-day coverage, reducing a process that historically took days or weeks through a traditional broker.
- State-level regulatory divergence on liability rules continues. States with joint-and-several-liability frameworks and higher litigation rates continue to see meaningfully higher general liability premiums than lower-litigation states, reinforcing the value of location-aware comparison shopping.
Frequently Asked Questions
Is business insurance legally required?
It depends on the type. Workers’ compensation is legally required in nearly every state once you have employees, while general liability insurance is not legally mandated in most states but is frequently required by landlords, lenders, and client contracts.
What’s the difference between general liability and professional liability insurance? General liability covers third-party bodily injury and property damage claims, while professional liability (errors & omissions) covers claims of negligence, mistakes, or failure to deliver services as promised — the coverage most relevant to service and advice-based businesses.
How much does small business insurance typically cost?
Most small businesses pay roughly $500 to $2,000 a year for general liability or a bundled Business Owner’s Policy, with total costs increasing once workers’ compensation, professional liability, or commercial auto coverage is added.
What is a Business Owner’s Policy (BOP)?
It’s a bundled policy combining general liability and commercial property coverage into a single, typically discounted package, well-suited to most small businesses without highly specialized risk exposure.
Do I need cyber liability insurance for a small business?
Increasingly yes, particularly if your business handles customer payment information or sensitive personal data, as data breach costs and related legal exposure have grown substantially in recent years.
Discover more from The Economy
Subscribe to get the latest posts sent to your email.
Tech Companies
Beyond Petrochemicals: How Indonesia’s Chandra Asri is Constructing an Integrated ASEAN Mobility Powerhouse

Indonesia’s largest petrochemical and infrastructure conglomerate, PT Chandra Asri Pacific Tbk, is executing a transformative strategic pivot. Controlled by Indonesian billionaire Prajogo Pangestu’s Barito Pacific Group, the Jakarta-listed giant is aggressively expanding beyond its traditional industrial manufacturing roots to establish a dominant, multi-tiered energy, retail, and mobility platform centered in Singapore.
By connecting upstream refining, retail fuel distribution, and automotive retail across Singapore and Malaysia, Chandra Asri is building a vertically integrated ecosystem designed to hedge against volatile commodity chemical cycles while capturing high-margin growth across Southeast Asia’s changing transportation landscape.
Executive Summary & Strategic Takeaways
- The Mobility Pivot: Through its subsidiary CCHPL Holdings, Chandra Asri signed a conditional agreement to purchase the Singapore and Malaysia automotive operations of Jardine Cycle & Carriage (C&C) for approximately S$265 million (US$207 million).
- The Full-Value Chain Strategy: The C&C acquisition complements two prior megadeals in Singapore: the acquisition of Shell’s Energy and Chemicals Park on Pulau Bukom/Jurong Island via Aster Chemicals (a joint venture with Glencore) and the purchase of ExxonMobil’s network of 60 Esso service stations.
- Accretive Valuation: Financial analysts estimate that the combined mobility and retail assets (Esso + C&C) will generate an additional US$150 million to US$200 million in annual profit, acquired at an attractive multiple of ~4.3x to 8.6x P/E.
- Macro Hedge: The move insulates Chandra Asri from regional petrochemical margin compression driven by global overcapacity, creating predictable, cash-flow-generative consumer touchpoints.
The Macro Logic: Moving Downstream Amid Petrochemical Headwinds
The Asian petrochemical sector has faced margin pressure in recent years due to expanding regional refining capacity and shifting global demand dynamics. For commodity producers relying strictly on olefins and polyolefins, earnings volatility remains a central challenge.
Chandra Asri’s strategy addresses this risk by transforming from a regional industrial supplier into a consumer-facing energy and mobility platform.
┌────────────────────────────────────────────────────────────────────────┐
│                        THE INTEGRATED VALUE CHAIN                      │
├──────────────────────────┬──────────────────────────┬──────────────────┤
│    UPSTREAM REFINING     │     RETAIL ENERGY        │ CONSUMER MOBILITY│
│ (Bukom & Jurong Island)  │   (60 Esso Stations)     │ (Cycle & Carriage)│
├──────────────────────────┼──────────────────────────┼──────────────────┤
│ • 237k bpd Crude Refinery│ • Retail Fuel Sales      │ • 13+ Auto Brands│
│ • 1.1M MT/yr Cracker     │ • EV Fast-Charging Hubs  │ • EV Bus Dist.   │
│ • Downstream Monomers    │ • Convenience Retail     │ • Leasing & Fleet│
└──────────────────────────┴──────────────────────────┴──────────────────┘
By owning each link in this chain, Chandra Asri achieves three core strategic objectives:
- Guaranteed Downstream Offtake: Upstream refinery products from Pulau Bukom can be directly processed, distributed, and commercialized through controlled retail fuel networks and fleet platforms.
- EV & Energy Transition Readiness: Acquiring C&C provides immediate exposure to electric vehicle (EV) distribution (such as commercial EV bus maker Zhongtong), while the Esso network offers prime real estate for rapid deployment of EV charging infrastructure across Singapore.
- Cross-Selling & Data Synergies: Capturing consumer touchpoints across fuel retail, vehicle sales, commercial fleet leasing, and after-sales service unlocks long-term customer lifetime value.
The Tripartite M&A Playbook: Building the Platform
Chandra Asri’s expansion in Singapore relies on three complementary acquisitions structured over the last two years:
| Strategic Pillar | Target Asset / Deal | Strategic & Operational Significance | Source & Financing Details |
| 1. Upstream Refining & Chemicals | Shell Energy & Chemicals Park (SECP) (Pulau Bukom & Jurong Island) | Adds 237,000 bpd crude refining capacity and a 1.1 million metric ton annual capacity ethylene cracker via Aster Chemicals & Energy (JV with Glencore). | Barito Pacific Official Corporate Announcement |
| 2. Retail Energy & Distribution | ExxonMobil Esso Network (~60 Service Stations in Singapore) | Converts wholesale fuel refining into direct retail cash flow. Serves as physical hubs for future electrification and retail services. | Backed by $750M Private Credit Package from KKR |
| 3. Automotive & Mobility Platform | Cycle & Carriage (C&C) (Singapore & Malaysia Operations) | Captures ~12% of Singapore’s passenger car market across 13+ brands (including Mercedes-Benz, Kia, Mitsubishi) plus after-sales and leasing. | Agreement with Jardine C&C |
Financial Analysis: Valuation, Capital Structure & Profit Earnings
Despite a challenging cyclical environment that saw Chandra Asri’s H1 net profit contract due to high base-year accounting gains from prior acquisitions, the company’s financial foundation remains solid, supported by US$3.9 billion in total liquidity and over US$1 billion committed to strategic investments.
Deal Metrics & Accretion
Market analysts from Stockbit highlight that the acquisition of C&C represents an exceptionally cost-effective entry into steady consumer cash flows:
- Implied Valuation Multiples: At a purchase price of US$207 million against C&C’s 2025 net profit contribution of US$48 million, the implied transaction multiple sits at roughly 4.3x Price-to-Earnings (P/E). Even under conservative 2026 annualized estimates (~US$24 million profit), the multiple stays under 8.6x P/E.
- Earning Injections: The combined retail fuel (Esso) and automotive dealership (C&C) platforms are projected to contribute an immediate US$150 million to US$200 million in recurring annual net profit.
- Sovereign & Private Debt Backing: Institutional confidence is reflected in Chandra Asri’s ability to secure bespoke private credit financing, including a US$750 million facility arranged by KKR, alongside co-investments and credit lines from institutions like the Indonesia Investment Authority (INA) and Allianz Global Investors.
The Regional Trend: Indonesian Conglomerates Going Global
Chandra Asri’s expansion into Singapore is part of a broader shift among top-tier Indonesian industrial groups seeking regional scale and diversification.
Driven by maturing domestic balance sheets and the need to internationalize capital, groups like Bumi Resources (expanding into Australian copper/gold) and Djarum Group (acquiring North American paper assets via Singapore investment vehicles) are deploying capital internationally.
Singapore serves as the central springboard for this ambition. By establishing core assets within Singapore’s global financial, shipping, and energy architecture, Indonesian leaders like Chandra Asri gain:
- Direct access to international debt and equity capital markets.
- Reduced cost of capital through global credit syndicates.
- Operational headquarters to manage cross-border ASEAN energy flows between Indonesia, Singapore, Malaysia, and beyond.
Conclusion & Future Outlook
Chandra Asri’s transition from a domestic Indonesian petrochemical producer to a regional ASEAN mobility and energy leader represents a textbook case of strategic corporate evolution. By combining world-class refining assets on Pulau Bukom, 60 strategic Esso fuel stations, and the commercial auto distribution networks of Cycle & Carriage, Chandra Asri has built a resilient platform capable of riding out commodity downturns while capitalizing on Southeast Asia’s transition toward clean mobility.
Discover more from The Economy
Subscribe to get the latest posts sent to your email.
Who is the Federal Reserve chair in 2026? Kevin Warsh was confirmed as the 17th chair of the Federal Reserve in a narrow 54-45 Senate vote on May 13, 2026 — the most divisive confirmation in the Fed’s history — with his term officially beginning when Jerome Powell’s term expired two days later, according to J.P. Morgan Wealth Management’s analysis. Warsh, who at 35 had been the youngest person ever appointed to the Fed’s Board of Governors back in 2006, returned to the central bank after years in the private sector, including a stint as a partner at Duquesne Family Office.
His confirmation followed months of tension between President Trump and outgoing Chair Powell over the pace of rate cuts, and markets immediately began parsing Warsh’s public statements for clues about where he would steer policy.
What Warsh Actually Believes About Inflation
Featured Snippet Target: Fed Chair Kevin Warsh has signaled tighter inflation discipline through a “trimmed averages” approach to measuring price changes — removing the most extreme price movements from the inflation basket before calculating overall trends — while also arguing in a pre-confirmation Wall Street Journal op-ed that artificial intelligence could act as a significant disinflationary force on the broader economy.
That combination puzzled Fed-watchers who expected Warsh, nominated by a president who had repeatedly pushed for lower rates, to simply deliver the dovish policy Trump wanted. Instead, according to analysis from The Motley Fool, Warsh has been notably tight-lipped in his first months, by design — he has stated he wants the Fed to take more of a “back seat” in market communication, believing markets function more efficiently digesting economic data directly rather than reacting to Fed guidance.
The First Meeting: A Hawkish Surprise
Warsh’s debut as chair came at the June 16-17, 2026 FOMC meeting, and it delivered a genuine surprise to markets pricing in continued easing. The Fed held its federal funds rate steady at 3.50%-3.75% for a third consecutive meeting, but new quarterly projections showed nine Fed officials now anticipating a rate hike by the end of 2026 — a sharp reversal from the cutting cycle markets had expected — with the median forecast raised to 3.6% by year-end, according to reporting from The Daily Record. The updated policy statement also removed all forward guidance language about future rate moves, adopting a shortened format reminiscent of the Alan Greenspan era — an early, tangible sign of Warsh’s stated preference for a more narrowly focused, less communicative central bank.
That hawkish pivot came against a genuinely difficult inflation backdrop. Inflation had been running stubbornly above the Fed’s 2% target even before Warsh’s arrival, and the eruption of the Iran conflict in late February 2026 pushed oil prices sharply higher, adding a fresh layer of cost-push inflation pressure just as the new chair was settling in.
Why the FOMC Itself Is Divided
Warsh inherited a genuinely split committee. The 19-member FOMC had signaled openness to a prolonged pause after delivering three rate cuts in the prior fall, with many policymakers believing those cuts had sufficiently addressed slowing job growth, according to analysis from ChannelChek. April 2026’s meeting — held before Warsh’s confirmation — brought the most policy disagreement among committee members in decades, reflecting a genuine intellectual split between officials worried about persistent inflation and those worried about a weakening, “low-hire, low-fire” job market.
Convincing that divided committee to resume cutting rates, rather than hike as the June projections suggested, will likely be one of Warsh’s most consequential early challenges — particularly if inflation data continues running hot on the back of elevated energy costs.
The Bigger Structural Agenda
Beyond the immediate rate debate, Warsh has signaled an intent to reshape how the Fed operates more broadly. He has stated a goal of shrinking the central bank’s balance sheet and strengthening coordination between the Fed, the Treasury, and the White House on economic policy, according to reporting on his confirmation. That coordination goal is itself a departure from the traditional emphasis on Fed independence from fiscal policymakers — a shift some economists have flagged as worth watching closely, given how central bank independence has historically been treated as a bulwark against politically-driven inflation.
The Market Reaction
Markets initially reacted to Warsh’s nomination with genuine uncertainty rather than a clear directional bet. Following his January 2026 nomination, Fed funds futures were pricing a 65.3% probability of at least one rate cut by June — up from 61.8% the prior day — with markets pricing in a total of 52 basis points of cuts for all of 2026 at that point, according to fixed-income commentary from Asset Allocation & Management Company. That dovish pricing has since been substantially unwound by the actual June hawkish pivot — a reminder that a new Fed chair’s confirmed policy stance, once articulated in an actual meeting, matters far more to markets than pre-confirmation speculation about political allegiance.
The Bottom Line
Kevin Warsh’s first months as Fed chair have defied the simple “Trump appointee cuts rates” narrative that dominated coverage of his nomination. Instead, he has delivered a genuinely hawkish debut meeting, adopted a more hands-off communication style, and articulated an inflation-measurement philosophy that gives him intellectual cover to hold rates higher for longer if energy-driven inflation persists. Whether that stance holds through the rest of 2026 will depend heavily on how the Iran conflict’s economic fallout evolves and whether the divided FOMC can coalesce around a consistent direction.
Next step: Track the Fed’s quarterly Summary of Economic Projections alongside actual CPI and PCE inflation prints — the gap between the two, more than any single Warsh public statement, is the clearest signal of whether the Fed’s late-2026 rate path tilts toward the hike some officials now anticipate or back toward the cuts markets originally expected.
Discover more from The Economy
Subscribe to get the latest posts sent to your email.

SpaceX Starship Achieves First Full Orbit on Historic 10-Hour Test Flight 14

Google’s $15B Finland AI Investment: Data Centers, Nuclear Power & Jobs

Fast Invoice Factoring: Rates, APR Math & Contract Traps

SOC 2 Type II Guide: Cost, Timeline & Compliance Companies

Hong Kong Wages Surge 3.4% in June: Sector Data & Analysis

Silver Price Today: Why the Xi-Trump AI Standoff Is Fueling a Safe-Haven Rally

Citibank & Dólar Estadounidense: Forex Playbook After the Xi-Trump Truce

How the Trump-Xi White House Summit Is Reshaping Mortgage Rates Today for Real Estate Investors

Indonesia Navigates Mega-Project Risks as China and Russia Eye the 2,772km Trans-Kalimantan Railway

Trump-Xi 2026 Summit Takeaways: The Trade Truce, Taiwan, and the AI Divide

Solar Panel Installation Cost in 2026: Why the Math Changed Overnight

Business Insurance: What Coverage You Actually Need and What It Costs in 2026

Auto Insurance Quotes: How to Get the Lowest Rate Without Losing Coverage

Huntington Online Banking: Full Features, Fees, and How It Compares in 2026

Top 30 Stocks for Investment in PSX for Massive ROI in 2026

SpaceX Starship Flight 14: First Orbital Attempt & Starlink V3 Launch Explained

Oil Prices Break $100 in 2026: Middle East Conflict & Energy Markets

BRICS+ Cross-Border Payments 2026: Interoperability Explained

Fidelity Investments Review 2026: SPAXX Yields & Zero-Fee Funds

Tween Back-to-School Trends 2026: What’s Driving the $85B Season

10-Year Treasury Yield Hits 4.80%: What It Means for Rates & Portfolios

Shein Clothes Quality & Safety in 2026: What Lab Tests Show

IMF & World Bank 2026 Global Economic Outlook: Growth, Inflation, Debt

China’s US$10.8 Billion Trade Shortcut: Why the Pinglu Canal Matters

High-CPM Finance Niches 2026: Publisher Monetization Blueprint

Middle East War Economics 2026: Oil Prices & Energy Markets

China Stocks Today: Are Big Economies in Asia Nearing a Market Bottom?

Social Security Trust Fund 2032: OASI Depletion Timeline Explained
-

 Markets & Finance9 months ago
Top 15 Stocks for Investment in 2026 in PSX: Your Complete Guide to Pakistan’s Best Investment Opportunities
-

 Analysis7 months ago
Johor’s Investment Boom: The Hidden Costs Behind Malaysia’s Most Ambitious Economic Surge
-

 Analysis7 months ago
Top 10 Stocks for Investment in PSX for Quick Returns in 2026
-

 Banks8 months ago
Best Investments in Pakistan 2026: Top 10 Low-Price Shares and Long-Term Picks for the PSX
-

 Analysis8 months ago
Brazil’s Rare Earth Race: US, EU, and China Compete for Critical Minerals as Tensions Rise
-

 Investment9 months ago
Top 10 Mutual Fund Managers in Pakistan for Investment in 2026: A Comprehensive Guide for Optimal Returns
-

 Global Economy9 months ago
15 Most Lucrative Sectors for Investment in Pakistan: A 2025 Data-Driven Analysis
-

 Global Economy9 months ago
Pakistan’s Export Goldmine: 10 Game-Changing Markets Where Pakistani Businesses Are Winning Big in 2025