
Inflation
Hong Kong Wages Surge 3.4% in June: Sector Data & Analysis

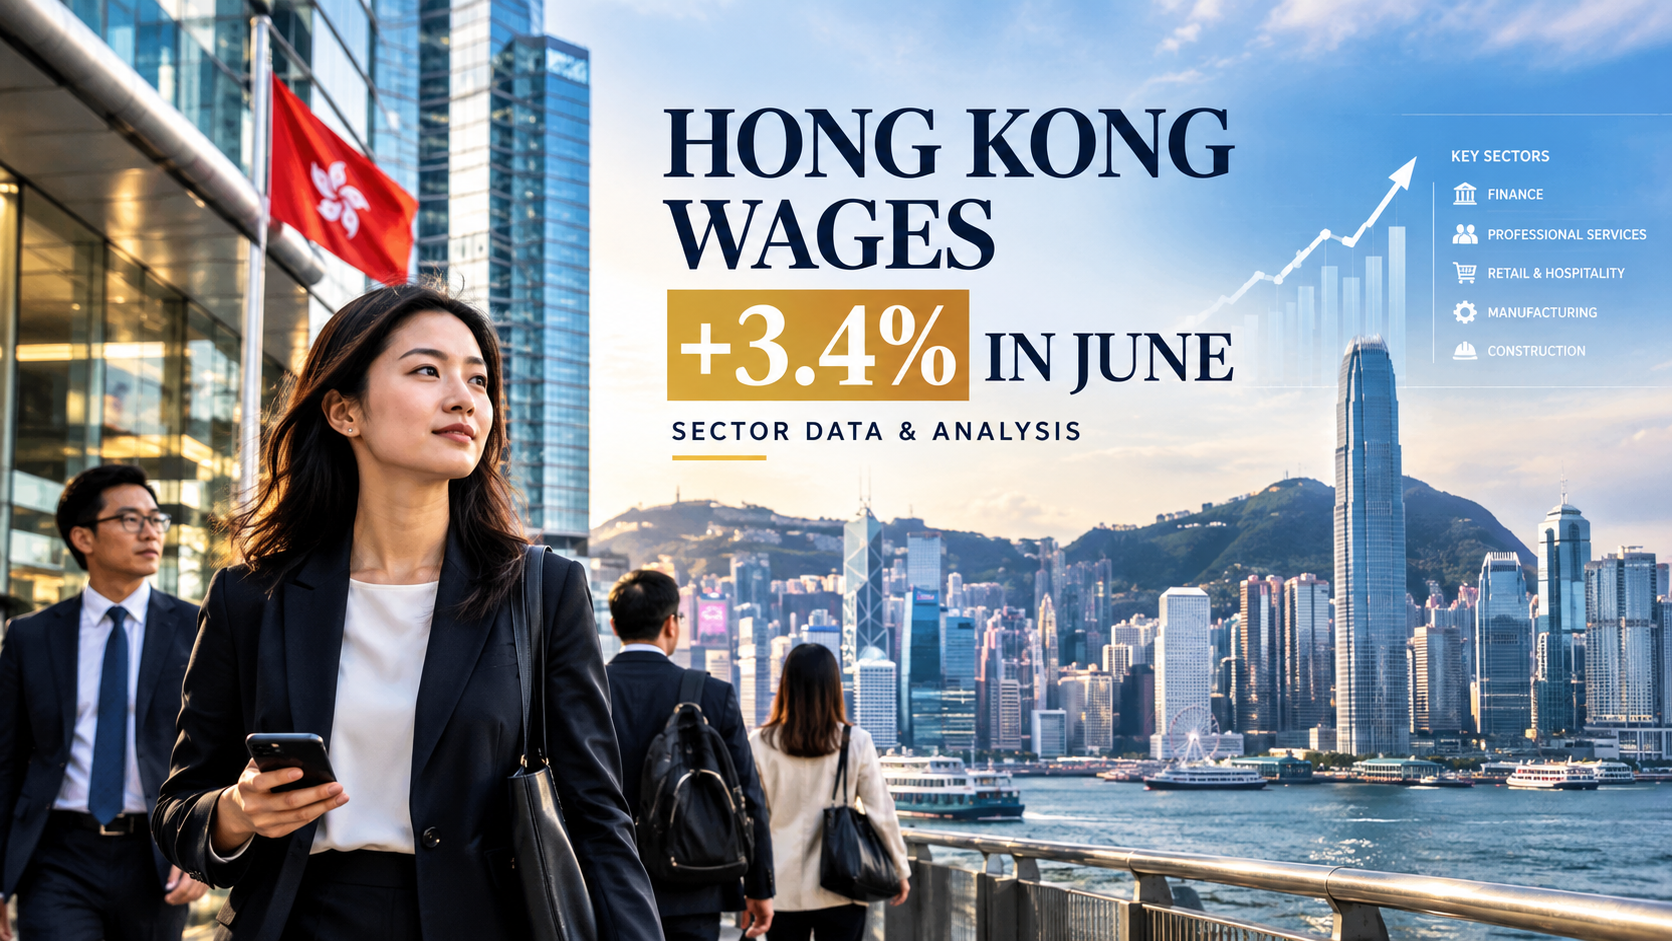
Hong Kong’s average wage rates recorded a 3.4% year-on-year increase in nominal terms, reflecting an enduring tight labor market across key commercial sectors. Data released by the Census and Statistics Department of Hong Kong demonstrates that after accounting for consumer price inflation, wages grew 1.8% in real terms, signaling genuine gains in employee purchasing power across the SAR economy.
The continuous upward movement in wage indices underscores a structural deficit in middle- to upper-tier manpower, further intensified by local economic restructuring and talent retention initiatives.
Key Wage Statistics at a Glance
| Economic Sector | Nominal Wage Growth (YoY) | Real Wage Growth (YoY) | Primary Industry Drivers |
| Financial & Insurance | +4.2% | +2.6% | Wealth management expansion, AI integration, regulatory compliance |
| Professional & Business Services | +3.8% | +2.2% | Legal tech, ESG reporting demand, corporate advisory |
| Transportation & Logistics | +3.5% | +1.9% | Aviation recovery, regional supply chain recalibration |
| Personal Services & Healthcare | +3.2% | +1.6% | Aging demographic demand, private healthcare expansion |
| Retail, Accommodation & Food | +2.6% | +1.0% | Local consumption adjustment, cross-border retail shifts |
Sectorial Performance: Finance and Professional Services Lead the Rally
Growth was not uniformly distributed across the economy. High-value knowledge sectors outstripped consumer-facing operational industries:
1. Financial Services & Wealth Management
The financial sector posted the strongest performance, backed by a rebound in wealth management inflows from mainland China and increased hiring within asset management and private banking. According to policy tracking by the Hong Kong Monetary Authority, institutional demand for risk management and compliance talent boosted salary floors across Tier-1 institutions.
2. Professional, Technical, and Digital Services
Consultancies, legal practices, and tech infrastructure providers recorded robust wage gains. The push toward digital transformation and mandatory sustainability reporting across listed companies created a competitive bidding environment for specialized professionals.
3. Retail, Food Services, and Consumer Travel
While hospitality and food services posted positive nominal gains, their real wage growth lagged behind the citywide average. Retail operators continue to adjust business models in response to altered consumer behavior, including weekend outbound travel by Hong Kong residents to neighboring Guangdong cities.
Real Wages vs. Inflation: Deconstructing Household Purchasing Power
While headline nominal growth stood at 3.4%, the net gain for households relies on the trajectory of the Composite Consumer Price Index (Composite CPI). Official figures from the Hong Kong Government Information Centre indicate underlying consumer inflation remained moderate at approximately 1.6% over the corresponding period.
Nominal Wage Growth (3.4%) − Inflation (1.6%) = Real Wage Growth (1.8%)
This positive differential confirms that worker compensation effectively outpaced baseline living cost increases, supporting private consumption capacity despite broader capital market volatility and elevated interest rates.
Strategic Drivers: Talent Schemes and Structural Shortages
Two major structural forces continue to dictate Hong Kong’s wage dynamic:
- Labor Supply Deficits: Demographic shifts and earlier labor force exits created persistent vacancies across both professional ranks and frontline operational roles.
- Impact of Top Talent Programs: Measures designed to import skilled workforce—such as the Top Talent Pass Scheme—are gradually replenishing senior ranks. However, as noted in economic reviews by the International Monetary Fund, the intake has primarily stabilized mid-to-senior levels while entry-to-mid operational tiers continue to face acute labor tightness, forcing employers to raise entry-level base compensation.
Macro Economic Outlook: What to Expect in Upcoming Quarters
The Hong Kong SAR Government expects further moderate wage increases through the second half of the year. Key factors influencing the trajectory include:
- Monetary Policy Easing: Global interest rate cuts are anticipated to reduce borrowing costs for small and medium-sized enterprises (SMEs), freeing up capital for workforce expansion and salary revisions.
- Cross-Border Integration: Enhanced economic alignment within the Greater Bay Area (GBA) will continue to reshape retail and service-sector wage dynamics, prompting local businesses to optimize efficiency through technology adoption.
- Corporate Cost Management: While talent retention remains a top priority, corporate profit margins are under scrutiny, leading many firms to pivot toward variable performance bonuses rather than permanent base-salary shifts.
Discover more from The Economy
Subscribe to get the latest posts sent to your email.



Inflation stopped being a 2022 story and became a 2026 one again, and most portfolios were not rebuilt for it.
US consumer prices rose 0.4% in August and 3.4% over twelve months, with core inflation at 2.4%. Headline inflation peaked near 4.2% in May before easing.
The uncomfortable part is why it eased — and why it may not keep easing.
Key Takeaways
- Where inflation stands: US CPI at 3.4% annually, core at 2.4%, both above the Fed’s 2% target.
- Energy is the swing factor. Energy prices are up roughly 16.3% over the year.
- The driver is geopolitical, not monetary. Energy prices remain elevated due to the ongoing Middle East conflict.
- Central banks turned hawkish again. J.P. Morgan notes rhetoric has hardened, especially in emerging markets.
- Most “inflation hedges” are not. Only a handful of assets have historically tracked unexpected inflation.
What the Current Inflation Actually Is
Understanding the composition matters more than the headline, because different inflation requires different hedges.
| Component | August 2026 Move | Annual |
|---|---|---|
| Headline CPI | +0.4% | +3.4% |
| Core CPI | +0.3% | +2.4% |
| Energy | +2.1% | ~+16.3% |
| Shelter | +0.3% | Persistent |
| Food | +0.1% | Moderate |
The gap between 3.4% headline and 2.4% core is the entire story. Roughly a full percentage point of US inflation is energy, and energy is a function of the Strait of Hormuz rather than of monetary policy.
The July data showed the mechanism clearly. Energy prices fell 1.5% for the month following a 5.7% decrease in June, yet still showed an annual increase of 14.7% after sharp earlier gains including a 10.9% surge in March just after the attacks against Iran began.
Then August reversed it: gasoline rose sharply and headline inflation picked up again.
This is supply-shock inflation, not demand inflation. That distinction determines which hedges work.
Why This Inflation Is Hard for Central Banks
Interest rates are a demand tool. They do not produce oil.
J.P. Morgan Global Research began the year forecasting that global inflation would remain stable through 2026, but the energy price spike and strong global growth momentum are now stoking inflation and paving the way for monetary tightening. Central bank rhetoric has become more hawkish, particularly in emerging markets, with the ECB and Bank of Japan expected to raise rates.
That is the inversion investors must internalise: for the first time since 2022, the plausible next move in several major economies is up, not down.
EY’s assessment flags the persistence risk directly: geopolitical tensions and energy market volatility could generate renewed price pressures, while lingering tariff pass-through and strong investment tied to the AI buildout continue to support inflation in selected goods and technology-related categories.
Note the AI point. Information technology commodities rose 1.4% month-on-month in July, led by a 3.5% increase in computer prices. The AI buildout is itself inflationary in hardware categories.
What Actually Hedges Inflation
Most assets marketed as inflation hedges protect against expected inflation, which is already in the price. What you need protection against is unexpected inflation.
Tier 1: Direct Hedges
Inflation-linked bonds (TIPS and equivalents). Principal adjusts with CPI. This is the only asset explicitly contracted to track inflation. The trade-off is real yield risk: if real rates rise, TIPS still lose value.
Commodities and energy exposure. When inflation is energy, energy assets are a direct hedge rather than a correlated one. This is the cleanest match to the current shock. The cost is extreme volatility and negative roll yield in contango markets.
Short-duration bonds and cash. Not glamorous, but reinvesting at rising rates beats holding long-duration paper through a tightening cycle.
Tier 2: Partial Hedges
Equities with pricing power. Companies that can raise prices faster than costs preserve real earnings. Sectors with genuine pricing power — energy, some industrials, branded consumer staples, infrastructure — behave differently from the index.
Real assets. Infrastructure, timber, farmland and property with short lease terms reprice with inflation. Property with long fixed leases does not.
Floating-rate credit. Coupons reset upward. Credit risk rises in the same environment, so this is a partial hedge at best.
Tier 3: Unreliable Hedges
Gold. Works in currency debasement and crisis episodes. Its correlation with CPI is weak and inconsistent.
Bitcoin. Marketed as an inflation hedge; has behaved as a high-beta risk asset, falling roughly 50% from its October 2025 peak during a period of rising inflation.
Long-duration growth equities. Actively harmed by the rate response to inflation.
| Asset | Hedges Expected Inflation | Hedges Unexpected Inflation | Main Risk |
|---|---|---|---|
| TIPS | Yes | Yes | Real rate moves |
| Energy/commodities | Partly | Yes | Volatility, roll cost |
| Short-duration bonds | Yes | Partly | Reinvestment timing |
| Pricing-power equities | Yes | Partly | Margin compression |
| Short-lease real assets | Yes | Partly | Illiquidity |
| Gold | Inconsistent | Inconsistent | No contractual link |
| Long-duration bonds | No | No | Duration loss |
A Practical Rebuild
You do not need to restructure a portfolio around a 3.4% CPI print. You need to remove the positions that break in it.
- Audit your duration. The single biggest inflation vulnerability in most portfolios is long-dated fixed income. Check weighted average duration before anything else.
- Check your real return, not your nominal return. A 4% nominal gain against 3.4% inflation is a 0.6% real gain.
- Add explicit, not implicit, protection. A small TIPS allocation does what a “diversified” equity sleeve only claims to do.
- Hold energy exposure if your inflation is energy-driven. Match the hedge to the shock.
- Keep equity exposure. Over long horizons, equities have outpaced inflation more reliably than any alternative. Do not solve a two-year problem with a twenty-year mistake.
- Review internationally. Inflation is not uniform. Emerging market central banks have turned notably more hawkish than developed peers.
The Purchasing Power Reality
The uncomfortable macro backdrop: real economic conditions are cooling alongside inflation, with wage growth lagging price growth, meaning workers’ purchasing power is flat to negative.
For investors, that has a second-order effect. Consumer-facing businesses without pricing power face volume compression at exactly the moment their input costs rise. Sector selection matters more in this environment than it does in a normal one.
What This Means for the Global Market in 2027
Base effects will do the heavy lifting. By year-end, the base effect from the April–May 2026 peaks rolls out of the twelve-month calculation. If monthly readings stay low, the year-over-year rate could drop to 2.5–3.0% by December — a milestone likely to trigger rate-cut guidance.
That improvement is mechanical, not structural. A falling headline rate driven by base effects does not mean the underlying energy vulnerability is resolved.
Watch core, not headline. If core CPI drifts toward 2% the Fed has cover. If it stalls or reverses, it signals underlying pressure that policy must address regardless of oil.
The September CPI release on 14 October is the pivot point. Another 3%-plus gasoline gain suggests supply tightness; a 1–2% reversal marks August as an anomaly.
Emerging market importers face the worst of it. Countries importing energy without AI-export revenues absorb the shock with no offset — a dynamic both the IMF and World Bank have flagged as the defining 2026–27 divergence.
Frequently Asked Questions
What is the current US inflation rate?
US CPI rose 3.4% over the twelve months to August 2026, with core inflation at 2.4%. Headline inflation peaked near 4.2% in May before easing.
What is the best hedge against inflation?
Inflation-linked bonds such as TIPS offer the only direct contractual link to CPI. For energy-driven inflation specifically, commodity and energy equity exposure has been the closest match.
Is gold a good inflation hedge?
Gold’s correlation with CPI is weak and inconsistent. It has performed better as a currency-debasement and crisis hedge than as a pure inflation hedge.
Will inflation fall in 2027?
Base effects from the 2026 peaks should mechanically lower the annual rate toward 2.5–3.0% by December 2026. Whether it stays there depends on energy prices and core inflation persistence.
Discover more from The Economy
Subscribe to get the latest posts sent to your email.
Key Takeaways
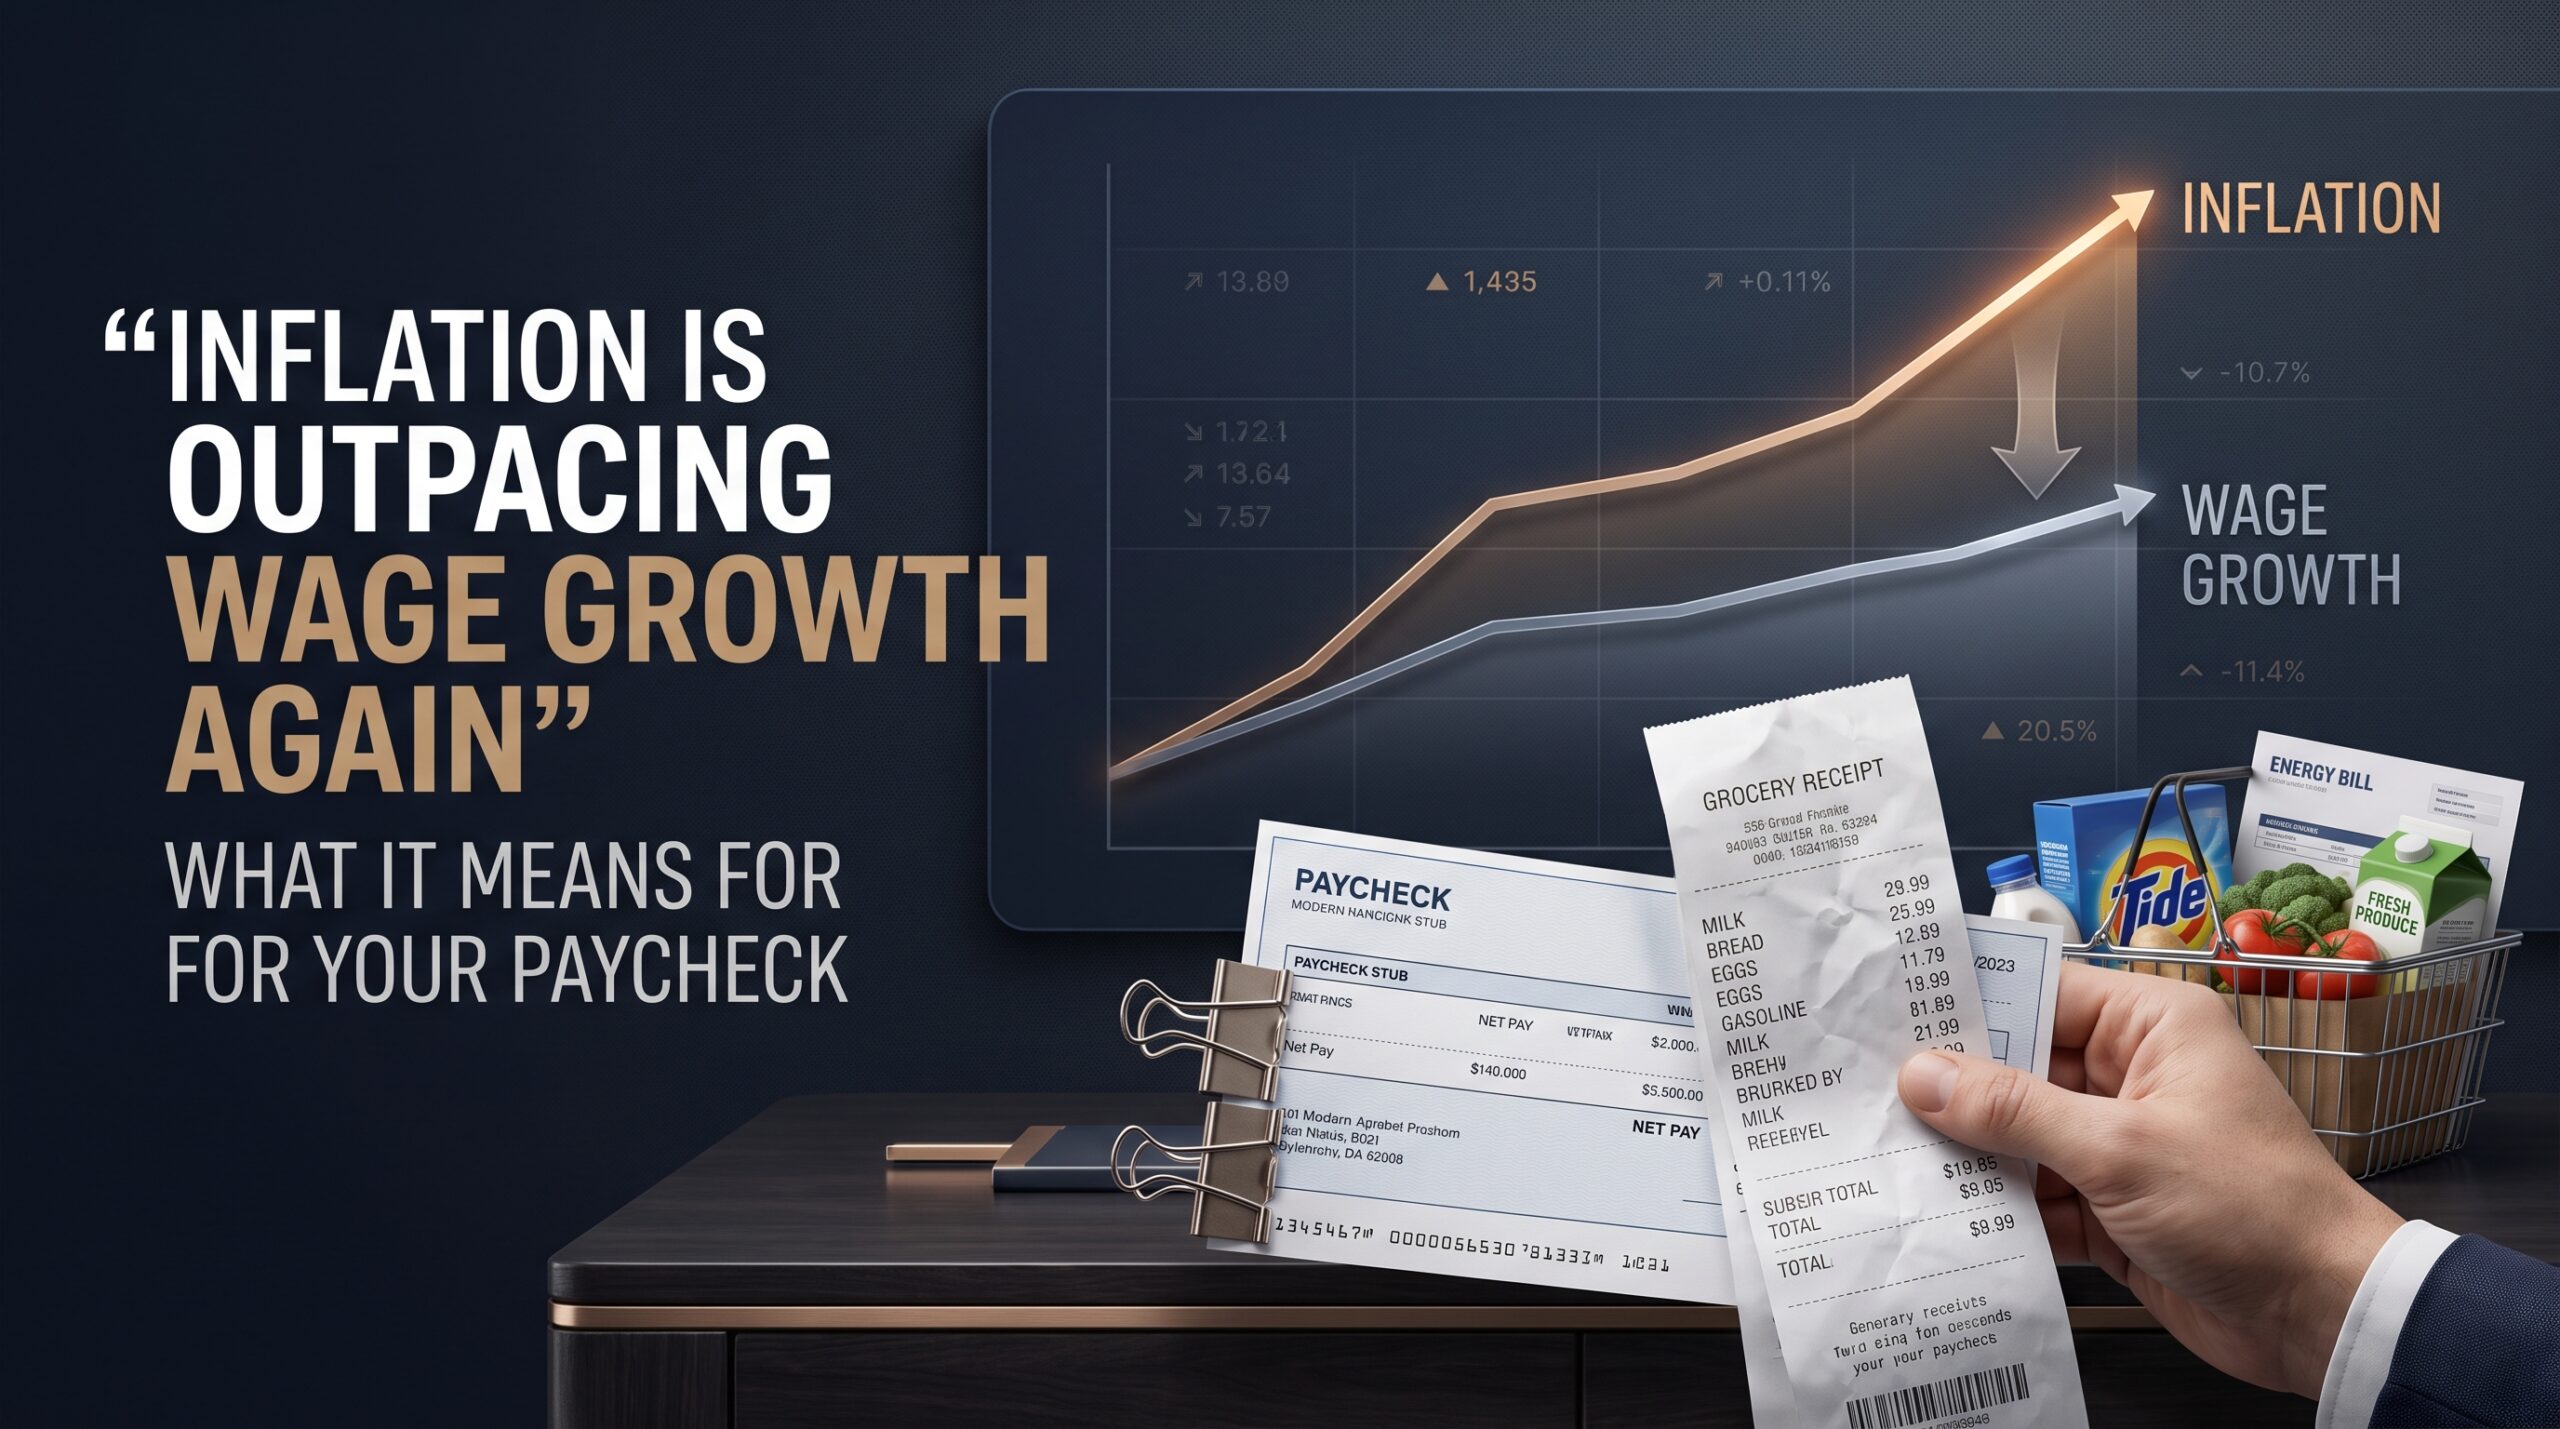
- US consumer prices rose 3.4% year-over-year in August 2026, while wages grew just 3.1% over the same period — meaning inflation is once again outrunning pay for the typical worker, according to CNBC’s analysis of the latest data.
- August marked the second consecutive month headline CPI held at 3.4%, with monthly CPI rising 0.4% — the largest monthly increase in three months — driven heavily by a 3.9% jump in gasoline prices.
- Core CPI (excluding food and energy) actually slowed to 2.4% year-over-year, the lowest reading since March 2021, suggesting the inflation squeeze is concentrated in energy costs tied to the Middle East conflict rather than broad-based price pressure.
- By one measure, nominal wages have grown 3.5% while the CPI-W (the index specifically tracking wage earners and clerical workers) rose 3.5%, showing the inflation-wage gap varies meaningfully depending on which wage and price measures are compared.
- Wage growth has moderated significantly from the roughly 4.0% annual pace recorded in October 2025, even as inflation has held roughly steady — a combination that’s gradually eroding real purchasing power for many American households.
For American workers, the math has flipped again: after a stretch where wage growth outpaced inflation, prices are now rising faster than paychecks, squeezing household budgets even as headline inflation appears, on the surface, relatively contained. Here’s what’s actually happening beneath the numbers, and why the picture is more nuanced than a single “inflation vs. wages” headline suggests.
The Headline Numbers
According to the latest Bureau of Labor Statistics data, US consumer prices rose 3.4% over the 12 months ending in August 2026 — unchanged from July’s reading and in line with economist forecasts. Average hourly wage growth, meanwhile, came in at 3.1% over the same period using the Bureau’s Consumer Employment Statistics survey measure, creating a gap that means, on average, workers’ pay is not keeping pace with the cost of living.
On a monthly basis, CPI rose 0.4% in August — the largest single-month increase in three months — with gasoline prices jumping 3.9% and accounting for more than a third of that monthly increase on their own. Fuel oil prices rose an even steeper 52% year-over-year, up sharply from 39.1% the previous month, underscoring how heavily energy costs are driving the current inflation reading.
The More Encouraging Signal Hiding in the Data
Despite the headline gap between wages and prices, the underlying inflation picture shows meaningful improvement in one key respect: core CPI, which strips out volatile food and energy prices, slowed to 2.4% year-over-year — its lowest reading since March 2021. This matters because it suggests the current inflation pressure is concentrated specifically in energy markets — driven by the ongoing US-Iran conflict’s impact on oil prices — rather than reflecting broad-based price increases across the economy. Shelter inflation also eased, dropping to 3% from 3.2% the prior month, and food inflation slowed to 2.7% from 3%.
This distinction matters for how the Federal Reserve is likely to interpret the data: a narrow, energy-driven inflation spike is a fundamentally different policy problem than broad-based inflation across housing, services, and discretionary goods, even though both show up in the same headline CPI figure that dominates news coverage.
Why the Wage-Inflation Gap Isn’t Uniform Across Measures
It’s worth noting that different wage and inflation measures tell somewhat different stories, which is part of why “inflation is outpacing wages” headlines can coexist with more mixed underlying data. One analysis using nominal average weekly wage data found wages grew 3.5% against 3.4% inflation — a slight positive gap rather than a negative one. Separately, the CPI-W index, which specifically tracks urban wage earners and clerical workers rather than the broader CPI-U measure, rose 3.5% — slightly above the headline 3.4% figure, suggesting the gap narrows or even reverses depending on which wage-earning population and which specific wage metric is used for comparison.
What’s consistent across virtually all measures, however, is the trend: wage growth has moderated substantially from the roughly 4.0% annual pace recorded as recently as October 2025, even as headline inflation has held relatively steady around 3.4%. That moderation in wage growth — even without inflation accelerating further — is itself squeezing real purchasing power growth toward flat or slightly negative territory for many workers.
Historical Context: How This Compares
For perspective, the current 0.3-percentage-point gap between CPI (3.4%) and wage growth (3.1%) is far milder than prior painful stretches. In June 2022, at the height of the post-pandemic inflation surge, nominal wages grew 4.8% while inflation hit 9.1% — a 4.3-percentage-point gap that represented one of the steepest erosions of real purchasing power in decades. The current squeeze, while real, is considerably more modest by comparison.
Wage and Inflation Snapshot: August 2026
| Metric | Year-over-Year | Notes |
|---|---|---|
| Headline CPI (CPI-U) | 3.4% | Unchanged from July |
| Core CPI (ex-food/energy) | 2.4% | Lowest since March 2021 |
| CPI-W (wage earners index) | 3.5% | Slightly above headline CPI |
| Nominal wage growth (avg. weekly) | 3.1%–3.5% | Varies by measure |
| Gasoline prices | +27.4% | Major driver of monthly CPI increase |
| Wage growth trend | Moderating | Down from ~4.0% pace in Oct 2025 |
Why This Matters: A Mixed Picture for the Fed and Households
For the Federal Reserve, this data presents what one analysis characterized as a genuinely mixed signal: underlying inflation trends (core CPI, three-month momentum) are cooling in a way that looks favorable, even as the year-over-year headline number stays elevated due to energy-driven base effects and geopolitical volatility that monetary policy has little power to address directly. For households, the practical reality is more straightforward and less encouraging: even with core inflation improving, the combination of moderating wage growth and elevated — if not accelerating — headline prices means real purchasing power gains have stalled for many workers, with the squeeze felt most acutely at the gas pump and in energy-adjacent costs rather than across the broader consumer basket.
Frequently Asked Questions
Is inflation currently outpacing wage growth in the US?
By the headline measures — 3.4% CPI versus 3.1% average hourly wage growth — yes, inflation is outpacing wages as of August 2026. However, some alternative wage measures show a smaller gap or even a slight wage advantage, depending on which specific metrics are compared.
What’s driving inflation higher in 2026?
Energy costs are the primary driver — gasoline prices rose 27.4% year-over-year and fuel oil 52% — tied to the ongoing US-Iran conflict’s impact on oil markets. Core inflation excluding food and energy has actually slowed to its lowest level since March 2021.
How does the current wage-inflation gap compare to 2022?
It’s far milder. In June 2022, the gap between wage growth (4.8%) and inflation (9.1%) reached 4.3 percentage points, compared to roughly 0.3 percentage points currently — meaning today’s squeeze on real wages is real but considerably less severe than the post-pandemic inflation surge.
Discover more from The Economy
Subscribe to get the latest posts sent to your email.
Understanding the Cost of Living, Price Hikes, and Macroeconomic Stability
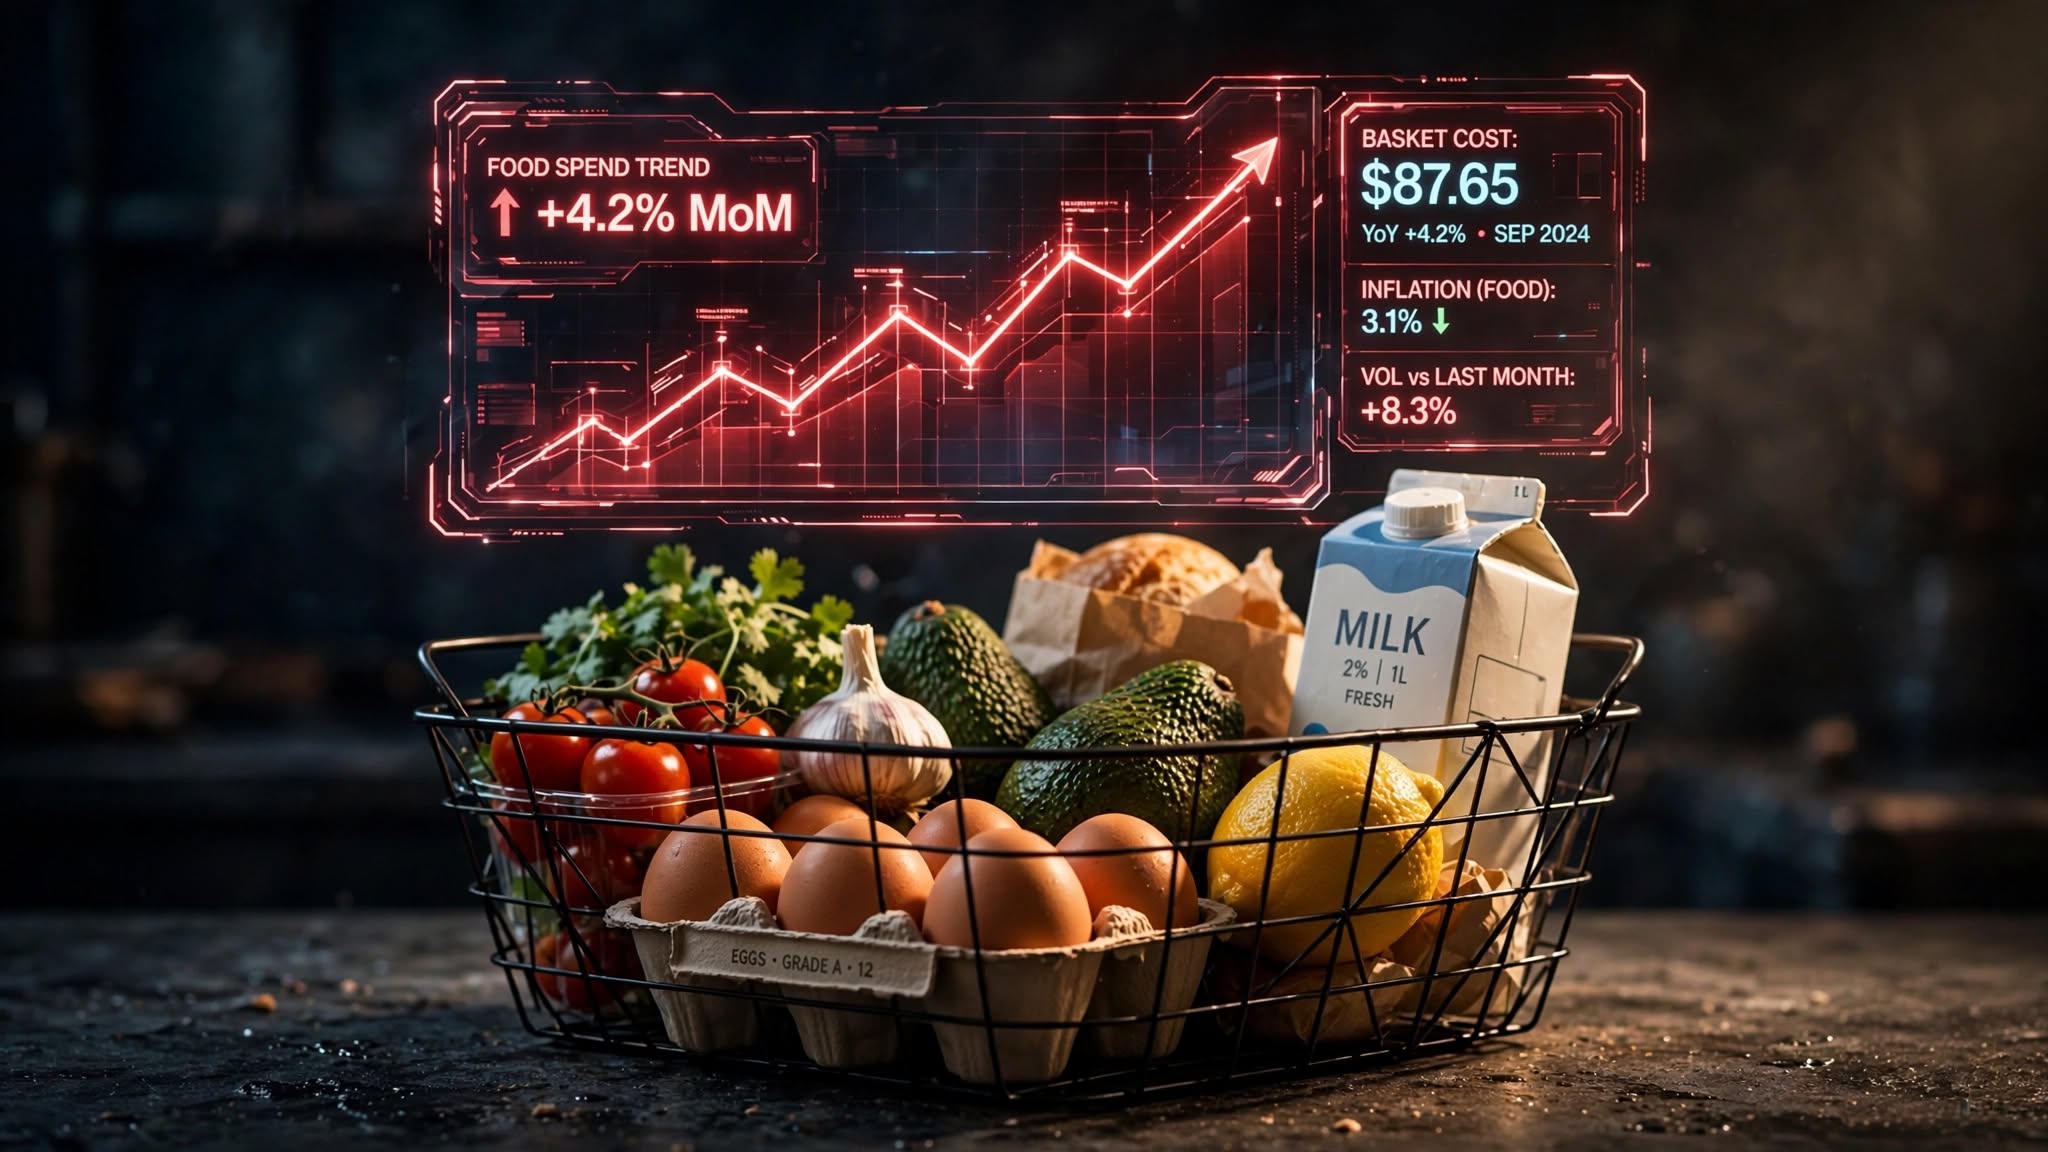
Inflation is the rate at which the general level of prices for goods and services rises in an economy, subsequently eroding the purchasing power of a currency. When inflation goes up, every single unit of currency buys a smaller percentage of a good or service. This means that if inflation is running at 10% annually, a basket of groceries that costs Rs. 1,000 today will cost Rs. 1,100 a year from now.
For readers of Thefinance.pk and Economy.com.pk, understanding inflation is foundational because it affects everything from daily household grocery budgets to high-level corporate investment strategies. It is not inherently a negative phenomenon; central banks generally target a low, predictable inflation rate (often around 2% in developed economies) to encourage consumption and investment over hoarding cash. However, hyperinflation or volatile inflation can cripple economic growth.
The Three Main Causes of Inflation
Economists generally divide the causes of inflation into three primary categories:
- Demand-Pull Inflation: This occurs when the overall demand for goods and services in an economy outpaces the economy’s ability to produce them. In simple terms, it is “too much money chasing too few goods.” This often happens during periods of rapid economic growth or when a government injects large amounts of stimulus money into the economy.
- Cost-Push Inflation: This type of inflation is driven by an increase in the cost of production. When raw materials (like crude oil or agricultural commodities) become more expensive, or when wages rise significantly, manufacturers pass these increased costs onto the consumer in the form of higher retail prices. A global oil shock is a classic trigger for cost-push inflation.
- Built-In Inflation: Also known as wage-price inflation, this is a psychological and adaptive phenomenon. When workers expect prices to continue rising, they demand higher wages to maintain their standard of living. Employers grant these wage increases but raise the prices of their goods and services to maintain profit margins, creating a continuous loop.
Measuring Inflation: The Consumer Price Index (CPI)
While inflation is the overarching concept, the Consumer Price Index (CPI) is the specific statistical metric used to measure it. The CPI tracks the average change over time in the prices paid by urban and rural consumers for a predefined “basket” of goods and services.
This basket is meticulously designed to reflect the daily spending habits of an average household. It includes various categories heavily weighted by their importance:
- Food and Non-Alcoholic Beverages: Often the largest weight in developing economies.
- Housing, Water, Electricity, and Gas: Utility costs and rent.
- Transport: Fuel prices and public transit costs.
- Health and Education: Medical care, tuition fees, and books.
- Apparel: Clothing and footwear.
How is CPI Calculated?
Statistical bureaus calculate CPI by collecting price data for the items in the basket from retail outlets across the country on a weekly or monthly basis. They establish a “base year” to serve as a benchmark (given an index value of 100).
If the base year is 2016 (Index = 100), and the current index value is 150, it means that the general price level of the basket has increased by 50% since 2016. The percentage change in the CPI from one month to the next, or one year to the next, represents the inflation rate.
CPI in the Context of Pakistan’s Economy
In Pakistan, the Pakistan Bureau of Statistics (PBS) is responsible for compiling and releasing CPI data every month. For platforms like economist.media, the monthly CPI reading is a critical data point.
Because a massive portion of the average Pakistani household income is spent on food and energy, the PBS assigns a very high weighting to these categories. Consequently, when global oil prices spike or agricultural yields drop (due to floods or droughts), Pakistan’s CPI surges aggressively. This imported inflation forces the State Bank of Pakistan (SBP) to tighten monetary policy, usually by raising interest rates to suppress demand and stabilize the Rupee.
The Hidden Tax on Savings
One of the most profound impacts of inflation is its effect on savings. Inflation is often referred to as a “hidden tax.” If you keep your money in a traditional savings account yielding 5% annually, but the CPI inflation rate is 10%, your real rate of return is negative 5%. Your money is mathematically growing, but its actual buying power in the real world is shrinking. This dynamic pushes investors toward assets that traditionally outpace inflation, such as real estate, equities, or gold.
Key Takeaways:
- Inflation represents the loss of purchasing power over time.
- The CPI measures this change using a weighted basket of everyday goods and services.
- Central banks combat high inflation by raising interest rates, which cools down consumer spending and corporate borrowing.
- High food and energy weights make developing economies particularly susceptible to global commodity price shocks.
Authoritative Sources & Further Reading:
- World Bank: Inflation Overview and Global Data
- International Monetary Fund (IMF): Inflation and the Cost of Living
Discover more from The Economy
Subscribe to get the latest posts sent to your email.

Google’s $15B Finland AI Investment: Data Centers, Nuclear Power & Jobs

Fast Invoice Factoring: Rates, APR Math & Contract Traps

SOC 2 Type II Guide: Cost, Timeline & Compliance Companies

Hong Kong Wages Surge 3.4% in June: Sector Data & Analysis

Silver Price Today: Why the Xi-Trump AI Standoff Is Fueling a Safe-Haven Rally

Citibank & Dólar Estadounidense: Forex Playbook After the Xi-Trump Truce

How the Trump-Xi White House Summit Is Reshaping Mortgage Rates Today for Real Estate Investors

Indonesia Navigates Mega-Project Risks as China and Russia Eye the 2,772km Trans-Kalimantan Railway

Trump-Xi 2026 Summit Takeaways: The Trade Truce, Taiwan, and the AI Divide

Solar Panel Installation Cost in 2026: Why the Math Changed Overnight

Business Insurance: What Coverage You Actually Need and What It Costs in 2026

Auto Insurance Quotes: How to Get the Lowest Rate Without Losing Coverage

Huntington Online Banking: Full Features, Fees, and How It Compares in 2026

Apply for a Bank Account Online: What You Need and How Long It Actually Takes

Top 30 Stocks for Investment in PSX for Massive ROI in 2026

SpaceX Starship Flight 14: First Orbital Attempt & Starlink V3 Launch Explained

Oil Prices Break $100 in 2026: Middle East Conflict & Energy Markets

BRICS+ Cross-Border Payments 2026: Interoperability Explained

Fidelity Investments Review 2026: SPAXX Yields & Zero-Fee Funds

Tween Back-to-School Trends 2026: What’s Driving the $85B Season

10-Year Treasury Yield Hits 4.80%: What It Means for Rates & Portfolios

Shein Clothes Quality & Safety in 2026: What Lab Tests Show

IMF & World Bank 2026 Global Economic Outlook: Growth, Inflation, Debt

China’s US$10.8 Billion Trade Shortcut: Why the Pinglu Canal Matters

High-CPM Finance Niches 2026: Publisher Monetization Blueprint

Middle East War Economics 2026: Oil Prices & Energy Markets

China Stocks Today: Are Big Economies in Asia Nearing a Market Bottom?

Social Security Trust Fund 2032: OASI Depletion Timeline Explained
-

 Markets & Finance9 months ago
Top 15 Stocks for Investment in 2026 in PSX: Your Complete Guide to Pakistan’s Best Investment Opportunities
-

 Analysis7 months ago
Johor’s Investment Boom: The Hidden Costs Behind Malaysia’s Most Ambitious Economic Surge
-

 Analysis7 months ago
Top 10 Stocks for Investment in PSX for Quick Returns in 2026
-

 Banks8 months ago
Best Investments in Pakistan 2026: Top 10 Low-Price Shares and Long-Term Picks for the PSX
-

 Analysis8 months ago
Brazil’s Rare Earth Race: US, EU, and China Compete for Critical Minerals as Tensions Rise
-

 Investment9 months ago
Top 10 Mutual Fund Managers in Pakistan for Investment in 2026: A Comprehensive Guide for Optimal Returns
-

 Global Economy9 months ago
15 Most Lucrative Sectors for Investment in Pakistan: A 2025 Data-Driven Analysis
-

 Global Economy9 months ago
Pakistan’s Export Goldmine: 10 Game-Changing Markets Where Pakistani Businesses Are Winning Big in 2025