
Human Resourcs
Jeff Bezos Three-Day Workweek View: What He Really Said

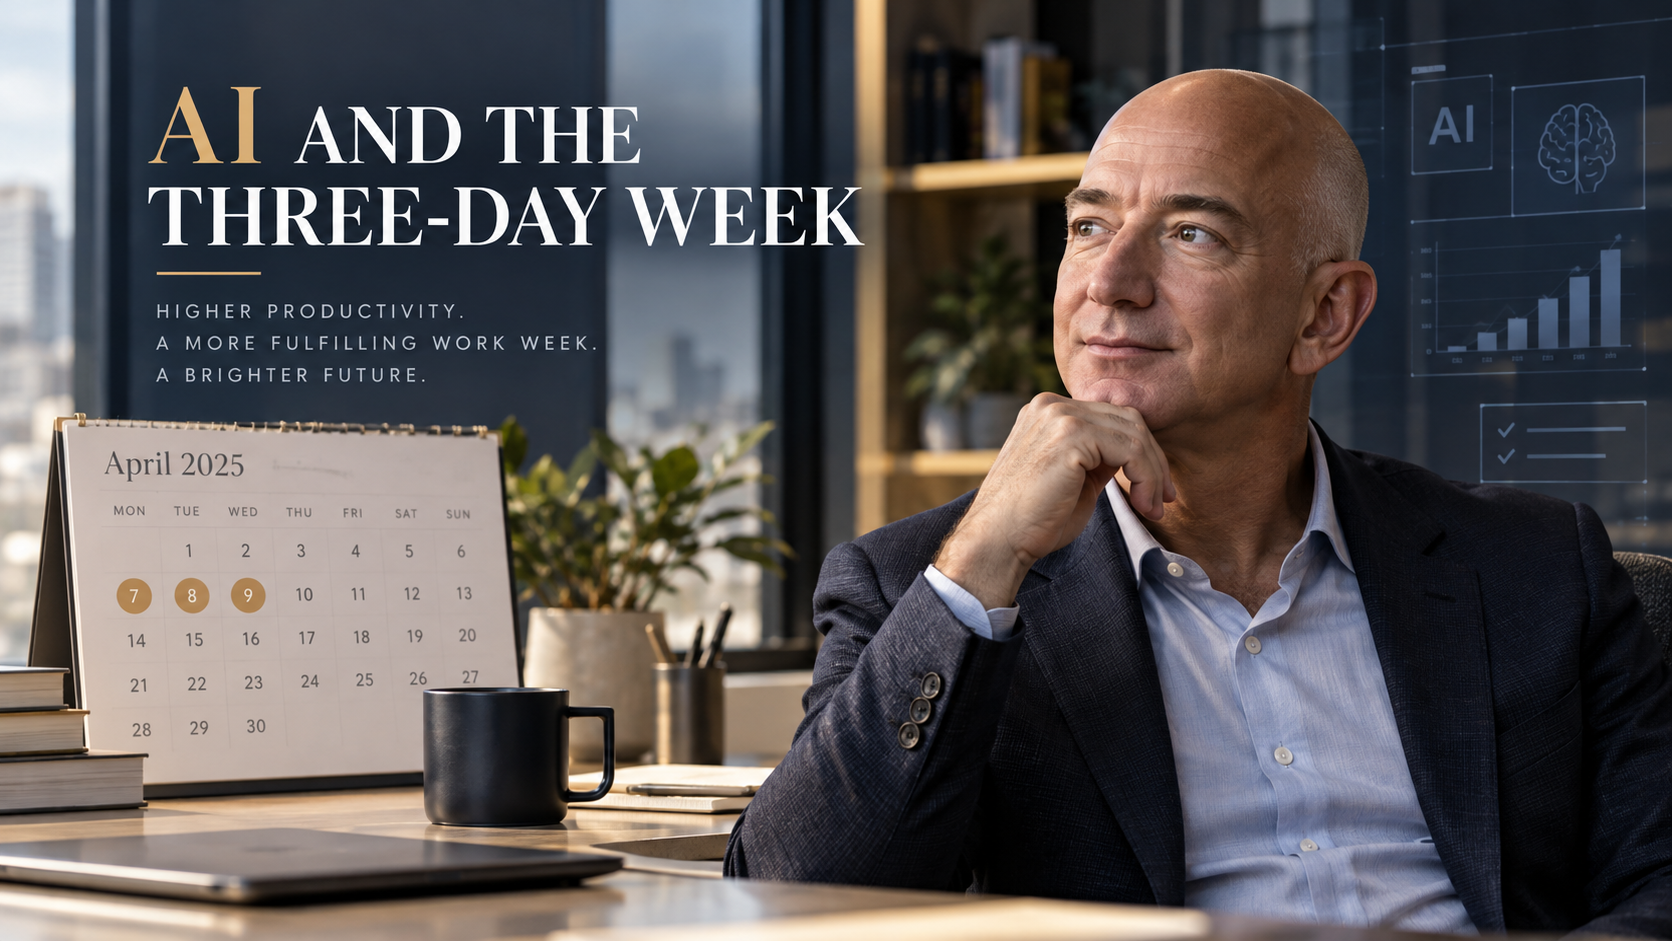
Jeff Bezos has floated a future in which artificial intelligence makes workers productive enough that some people might choose a three-day workweek while still supporting their families. The Amazon founder made the point during an October 7, 2026 interview with Fox News. He did not announce that Amazon is adopting a three-day schedule or that AI guarantees shorter hours for everyone. The underlying distinction is crucial: Bezos was describing a possible long-term economic outcome, not a new employment policy. Fox News’s account of the interview and Fast Company’s focused coverage make that clear.
Key takeaways:
- Bezos linked the possibility of fewer working days to future gains in AI-driven productivity.
- He suggested greater output could make single-income households or shorter working schedules financially feasible for some families.
- There is no evidence in the cited interview of a universal three-day-workweek plan at Amazon.
- Research shows AI can save time on some tasks, but broad effects on compensation and employment remain unsettled.
What did Jeff Bezos say?
In the Fox interview, Bezos discussed an optimistic vision of technological progress. His argument was that powerful AI tools could raise economic output enough to expand people’s choices. If a person can generate greater value in less time—and share financially in that improvement—working fewer days could become an option rather than a forced reduction in income.
That scenario is different from predicting every office will close on Thursdays and Fridays. It is also different from a government-mandated reduction in work hours. Fast Company reported Bezos’s additional concern that firms might face labor shortages if people respond to higher productivity by choosing more leisure time.
The prediction has attracted attention because it reverses the most alarming version of the AI-and-jobs debate. Instead of imagining machines replacing so many workers that employment vanishes, Bezos emphasized the possibility of prosperity, shorter hours and tighter labor supply.
Why the productivity argument matters
Labor productivity is commonly measured as output per hour worked. That is the U.S. Bureau of Labor Statistics’ definition. A software developer completing work that used to require ten hours in six may produce more per hour. A customer-service team handling routine requests faster may serve more customers without increasing headcount at the same rate.
But greater task efficiency does not automatically mean that an employee receives proportionally higher wages or fewer shifts. Businesses choose how to allocate productivity gains among pricing, investment, expansion, profits, compensation and staffing. Workers’ bargaining power, competition, management priorities and public policy can all shape the outcome.
A simple illustration—not a forecast
Imagine an employee currently produces 40 units of useful output during a 40-hour week. Productivity is one unit per hour. If technology raises the rate to 1.67 units an hour, a 24-hour week could, arithmetically, produce approximately 40 units.
That calculation only shows a technical possibility. It assumes the tasks can be reorganized, demand stays sufficiently steady, management accepts the schedule, and pay arrangements remain favorable. Healthcare, aviation, emergency services, logistics and many other occupations require coverage across specific hours; AI cannot simply eliminate the need for people to be present.
The important question is not whether an AI tool sometimes saves time. It is whether the gain is widespread, reliable and shared in a way that makes shorter schedules financially sustainable.
What does current research show about AI and jobs?
The evidence is more restrained than the boldest predictions. A June 2026 International Labour Organization review found evidence of real but uneven productivity gains. It also concluded that large-scale job displacement had remained limited in the material reviewed, while warning about inequality, weakened entry-level pathways and shifting job quality.
Separately, Yale’s Budget Lab tracker, updated September 15, 2026, reported no clear economy-wide labor-market disruption attributable to AI in the indicators it examined. Its researchers cautioned that the findings could change as technology adoption and data evolve.
These results do not prove Bezos wrong. They show that the conditions for a large-scale three-day week have not yet been demonstrated by broad labor data. Firms are experimenting with AI, but productivity effects differ among tasks, occupations and organizations.
Task savings are not the same as job transformation
An AI assistant might draft a first version of a memo quickly, but a professional still needs to check accuracy, speak with clients, make decisions and accept responsibility. A factory might improve planning efficiency while remaining constrained by physical machinery. A hospital might automate paperwork yet still need the same number of nurses for bedside care.
This distinction between automating tasks and replacing whole jobs is essential. Headlines suggesting a direct line from better chatbots to a nationwide three-day week skip multiple economic steps.
Could workers keep the same pay while working less?
They could in some workplaces, but that would require an employer decision, collective agreement, regulatory change or a labor-market environment supportive of higher effective hourly compensation. An employee moving from five eight-hour days to three eight-hour days would cut weekly hours from 40 to 24—a 40% reduction in hours. Keeping weekly pay unchanged would require compensation per hour to increase by about 67%, before considering other changes in productivity or operating costs.
That is a much larger adjustment than ordinary schedule flexibility. The arithmetic does not make it impossible; it makes the necessary improvement explicit. By contrast, a four-day, 32-hour schedule requires a 20% reduction in hours, a different benchmark entirely.
Any employer trial must ask whether output, service quality, employee retention and customer coverage are maintained. Studies of particular programs may be promising, but results do not transfer uniformly to every industry.
What about Amazon employees?
There is no verified connection between Bezos’s prediction and an official companywide Amazon three-day-workweek policy. Bezos is Amazon’s founder and executive chair, but his personal economic forecast should not be presented as a company announcement.
Amazon operates a mixture of offices, warehouses, cloud-computing facilities, transportation networks and other businesses. Working-hour patterns depend on the role and contract. A broad change in hours would require formal employee communications and operational planning, not merely comments in a television interview.
Readers searching “Is Amazon switching to three days?” should therefore receive an unambiguous answer: not on the basis of this interview.
Could AI create a labor shortage instead of mass unemployment?
Bezos’s labor-shortage concern is plausible as a scenario, but it is not an established forecast. If incomes rose while more workers elected to reduce hours, businesses might face greater competition for labor. Yet other forces could push the opposite way: some jobs could be automated, employers could reduce hiring, or new industries might absorb displaced workers.
The net result will depend on adoption speed, which tasks AI performs reliably, the cost of computing and energy, economic growth and how governments and companies manage the transition. Reuters’ October 2026 discussion of AI at work also emphasized that AI is changing tasks within jobs, with younger and experienced workers potentially affected differently.
Frequently asked questions
Did Jeff Bezos predict a three-day workweek?
Yes. He discussed it as a possible consequence of greater AI productivity during an October 7, 2026 Fox News interview. It was not a commitment to a timetable.
Is Amazon moving to a three-day workweek?
No companywide shift was announced in the interview. Any claimed policy should be verified against Amazon’s official employment communications.
Would a three-day workweek mean three eight-hour days?
Not necessarily. A three-day schedule could mean 24 hours, longer shifts or another arrangement. Bezos did not establish a universal definition or wage agreement.
Will AI eliminate the need to work?
There is no evidence supporting that as an inevitable outcome. The ILO’s 2026 review describes heterogeneous gains and risks rather than the disappearance of work.
Could AI make one-income households more common?
It could in theory if household purchasing power rises materially, but wages, housing costs, childcare, benefits and employment security also matter. The claim remains a scenario, not a confirmed demographic trend.
When could three-day workweeks become common?
No defensible national timetable can be inferred from the cited interview. Some employers may experiment sooner than others.
The bigger economic question
The provocative part of Bezos’s vision is not whether software can perform individual tasks faster. It is whether future productivity gains become broadly shared prosperity. If workers capture enough benefit, shorter schedules may become more feasible. If gains are concentrated in profits or paired with job insecurity, fewer working hours could instead mean lower household income. Those are fundamentally different futures, and the evidence today does not settle which will dominate.
Discover more from The Economy
Subscribe to get the latest posts sent to your email.


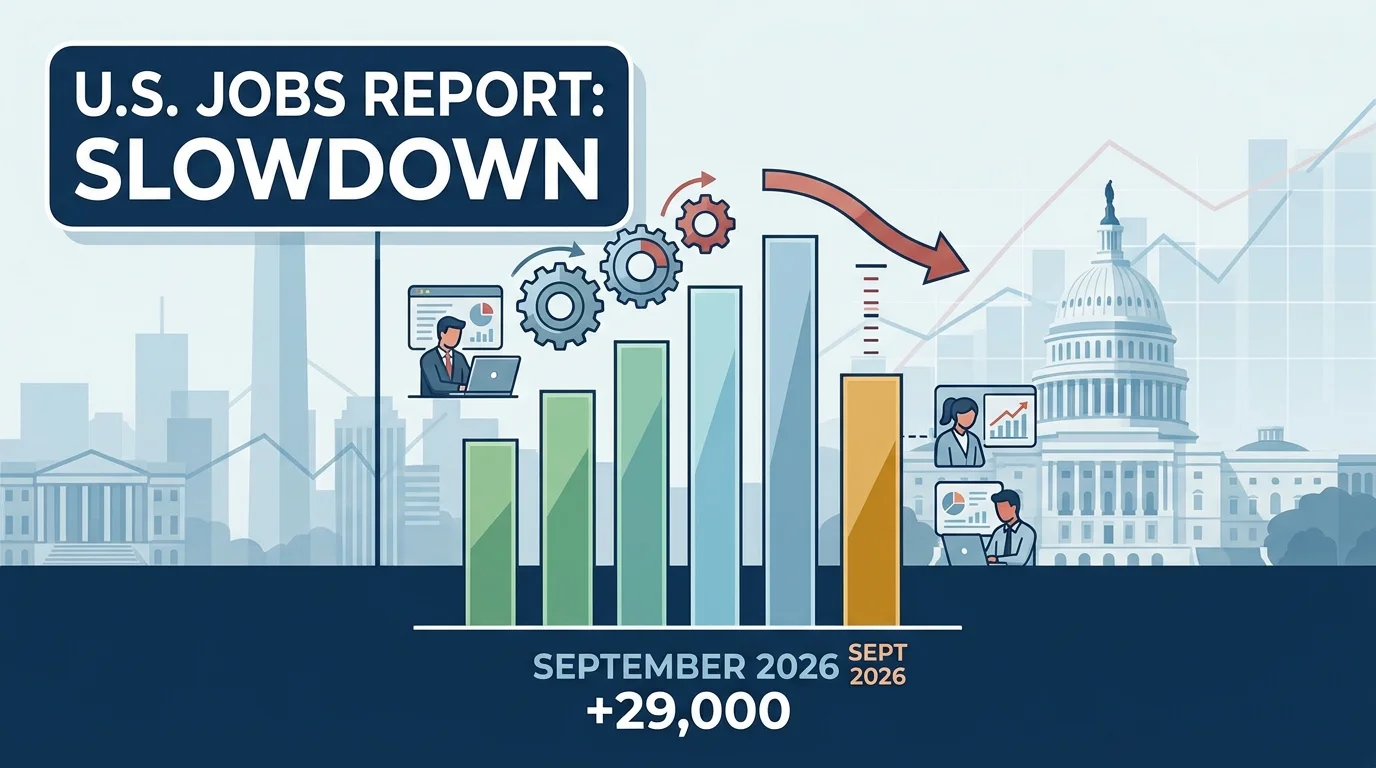
The U.S. labor market registered a sharp slowdown in September 2026, creating just 29,000 nonfarm payroll jobs—far below consensus forecasts of 84,000 to 95,000—while the national unemployment rate ticked upward to 4.2%. Data released by the U.S. Bureau of Labor Statistics highlights a broadening cooling trend across the private sector, accompanied by downward revisions to prior months and slowing wage expansion.
Executive Summary & Core Economic Indicators
The September numbers represent the weakest monthly payroll addition in over two years, signaling that prolonged high borrowing costs and corporate cost discipline are increasingly dampening hiring activity.
| Economic Metric | September 2026 Actual | Wall Street Consensus | Prior Month (August 2026) |
| Nonfarm Payroll Gains | +29,000 | +84,000 | +133,000 (Revised down from +162,000) |
| Unemployment Rate | 4.2% | 4.1% | 4.1% |
| Average Hourly Earnings (MoM) | +$0.05 (+0.1%) | +0.2% | +0.3% |
| Average Hourly Earnings (YoY) | +3.0% | +3.2% | +3.3% |
| Labor Force Participation Rate | 61.8% | 62.0% | 61.9% |
| Long-Term Unemployed Share | 27.1% | — | 26.8% |
Comprehensive Sectoral Breakdown
While job growth remained positive overall, expanding sectors failed to offset contractive pressures in service industries and negative net revisions from prior periods.
Sector Winners and Losers
- Health Care & Social Assistance (+17,000): Healthcare continued its trajectory as the primary engine of job creation, though gains decelerated significantly compared to its 12-month average monthly increase of 42,000.
- Construction (+11,000): Non-residential infrastructure and specialized trade contractors added modest headcounts, supported by ongoing federal energy and infrastructure outlays monitored by the U.S. Department of Labor.
- Manufacturing (+9,000): Factory employment posted light gains after several quarters of stagnation, primarily within durable goods manufacturing.
- Financial Activities (-7,000): Financial services experienced net losses, driven largely by layoffs in insurance carriers and mortgage origination units as elevated real estate yields curbed lending demand.
According to market sentiment tracking by Morningstar Market Research and economic feeds on Bloomberg News, the narrowing of job gains to fewer than three reliable sectors points to reduced labor demand across the wider service economy.
Negative Revisions & Wage Inflation Trends
A crucial element of the September report is the continuing pattern of downward revisions to past payroll data:
- July 2026 Revisions: Nonfarm payrolls were revised down by 31,000, shifting July’s net change into contraction territory at -10,000 jobs.
- August 2026 Revisions: August payroll additions were scaled down by 29,000, from an initial reading of 162,000 to 133,000 jobs.
- Combined Two-Month Drag: Revisions stripped 60,000 positions from previously reported figures, underscoring that momentum was weaker throughout Q3 than initially estimated.
Wage Growth and Inflation
Average hourly earnings for private nonfarm employees rose by 5 cents to $37.81, reflecting a year-over-year increase of 3.0%. This moderation in wage expansion aligns with the targeted disinflation trajectory monitored by the Federal Reserve System, reducing fears of a wage-price spiral while simultaneously limiting discretionary consumer spending growth.
Monetary Policy Implications for the Federal Reserve
The combination of slowing nonfarm payroll growth, a 4.2% jobless rate, and moderating wage pressures reshapes expectations for monetary policy.
Key macro takeaways for financial markets and monetary policy include:
- Pivot Toward Maximum Employment: Analysts at Reuters Economics and market analysts on Investing.com note that the Federal Open Market Committee (FOMC) must balance its inflation objective against rising risks to its full-employment mandate.
- Increased Probability of Rate Easing: Yields on short-term U.S. Treasury debt declined following the release, with interest rate futures pricing in a higher likelihood of consecutive 25-basis-point interest rate cuts at upcoming Federal Reserve policy meetings.
- Global Economic Fallout: International financial institutions, including the International Monetary Fund, track U.S. labor market developments closely, as softer domestic consumer demand in the United States directly influences global trade volumes and emerging market capital flows.
Discover more from The Economy
Subscribe to get the latest posts sent to your email.
Human Resourcs
Beyond the Four-Year Degree: The $100K+ Trade Careers Young Americans Are Overlooking

America is facing a structural shift in its labor force. While tens of thousands of recent college graduates enter an uncertain job market burdened by historic student loan debt and white-collar hiring freezes, a parallel crisis is unfolding in the physical economy: a historic deficit of skilled trade professionals.
According to data compiled by the U.S. Chamber of Commerce Workforce Index, the shortage of trade workers has left hundreds of thousands of critical positions vacant across residential construction, commercial infrastructure, and industrial manufacturing.
Yet, as industry executives note, these very roles represent some of the highest-paying, most secure career paths available to young workers—frequently yielding six-figure incomes without requiring a four-year college degree.
The Perfect Storm: Retirement Tsunami Meets the AI Data Center Boom
The skilled trade crisis is driven by two converging economic forces: demographic decline and an unprecedented surge in tech infrastructure construction.
DEMOGRAPHIC DEFICIT IN THE SKILLED TRADES
----------------------------------------------------------------------
Retiring Tradespeople : █ █ █ █ █  (5 Workers Leaving)
New Entrants          : █ █        (2 Workers Entering)
----------------------------------------------------------------------
Net Result            : Structural shortage of 300,000+ open positions
1. The 5-to-2 Demographic Ratio
For every five skilled tradespeople retiring from the workforce, only two new workers enter the pipeline. Industry research published by Bring Back The Trades estimates that this deficit risks removing $326 billion in potential GDP growth if unaddressed over the next decade.
2. The AI Infrastructure Competition
The rapid rise of generative AI and cloud computing has triggered a massive capital deployment into hyper-scale data centers. Electricians, HVAC specialists, pipefitters, and structural technicians who traditionally built single-family homes are being pulled into high-margin commercial tech infrastructure. This dynamic directly squeezes residential housing supply, pushing home prices higher and lengthening construction timelines.
Head-to-Head ROI: 4-Year College Degree vs. Skilled Trade Apprenticeship
For decades, high school guidance counselors and parents operated under the assumption that a four-year bachelor’s degree was the sole guaranteed path to financial stability. Modern labor data tells a vastly different story.
According to tracking by the National Student Clearinghouse Research Center, enrollment in vocational and trade-focused programs has surged over 16%, driven by Gen Z’s skepticism toward college debt and rising concern over white-collar AI automation.
| Financial & Career Metric | Standard 4-Year University Path | Union Trade Apprenticeship Path |
| Average Upfront Cost / Debt | $120,000–$200,000 (Tuition & Living) | $0 (Paid earn-while-you-learn training) |
| Entry Wages (Year 1) | $45,000 – $60,000 (Varies by major) | $48,000 – $65,000 ($22–$32/hr starting) |
| Mid-Career Earning Potential | $75,000 – $115,000 | $85,000 – $140,000+ (With OT/Master status) |
| Time to Positive Net Worth | 7 to 12 Years post-graduation | 1 to 3 Years |
| Disruption Risk from AI | High (Cognitive & administrative tasks) | Extremely Low (Physical dexterity & site adaptation) |
| Entrepreneurship Potential | Moderate (Requires corporate capital) | Very High (Low capital barrier to launch contracting firm) |
Top 6 High-Paying Trade Careers Crossing the $100K Threshold
Data from the official U.S. Bureau of Labor Statistics Occupational Outlook reveals that technical expertise and specialized licenses carry a premium in today’s labor market. Below are the top trade paths where experienced technicians routinely clear six figures:
1. Elevator & Escalator Installers & Repairers
- Mean Annual Wage (BLS): $109,820
- Top 10% Earning Potential: $140,000+
- Educational Requirement: High school diploma + 4-Year Apprenticeship
- Why it Pays: High technical complexity, rigorous safety protocols, and strong union backing (IUEC).
2. Electrical Power-Line Installers & Repairers
- Mean Annual Wage (BLS): $91,970
- Top 10% Earning Potential: $125,000+
- Educational Requirement: Long-term on-the-job training / Apprenticeship
- Why it Pays: Essential utility work involving high-voltage lines, emergency storm response, and extensive overtime opportunities.
3. Master Electrician & Industrial Automation Technicians
- Mean Annual Wage (BLS): $71,490 (Journeyman average; Master status clears $110,000+)
- Top 10% Earning Potential: $115,000–$150,000+
- Educational Requirement: 4 to 5-Year Apprenticeship + State Licensing
- Why it Pays: High demand across smart buildings, solar grid integration, EV infrastructure, and AI data centers.
4. Master Plumber & Commercial Pipefitter
- Mean Annual Wage (BLS): $72,170 (Base average)
- Top 10% Earning Potential: $120,000+ (Independent business owners reach $200,000+)
- Educational Requirement: Vocational training + 4-Year Apprenticeship
- Why it Pays: Emergency service premiums, complex commercial systems, and severe regional labor deficits.
5. Industrial Millwrights & Mechanics
- Mean Annual Wage (BLS): $69,780
- Top 10% Earning Potential: $105,000+
- Educational Requirement: Apprenticeship or Associate Degree
- Why it Pays: Critical maintenance of heavy industrial machinery, assembly lines, and power generation plants.
6. Commercial HVAC & Refrigeration Technicians
- Mean Annual Wage (BLS): $64,780 (Master/Commercial specialists average $95,000+)
- Top 10% Earning Potential: $108,000+
- Educational Requirement: Postsecondary certificate + EPA certification
- Why it Pays: Precision climate control required for pharmaceuticals, cold-chain logistics, and server farms.
Corporate Investments and Public Sector Response
Major corporations and philanthropies are stepping in to scale training infrastructure:
- Google.org & Home Builders Institute (HBI): Philanthropic funding is enabling the expansion of trade education for military veterans transitioning to civilian life. According to HBI, its military program achieved an 87% career placement rate for transitioning service members last year.
- General Motors: Announced a $200 million investment into workforce development and technical training partnerships to build the technician pipeline required for advanced automotive and manufacturing systems.
- State Level Legislation: Multiple U.S. states have expanded dual-enrollment programs allowing high school students to complete trade apprenticeship hours before graduation, effectively graduating debt-free directly into $30/hour positions.
Actionable Guide: How Young Americans Can Enter the Trades
- Explore Registered Apprenticeship Programs (RAPs): Visit Apprenticeship.gov to find employer-sponsored, paid training opportunities near you.
- Connect with Local Trade Unions: Contact local chapters of the IBEW (Electrical), UA (Plumbers & Pipefitters), or UBC (Carpenters) to learn about entrance exams and application cycles.
- Earn Specialized Industry Certifications: Early certifications in OSHA 30, EPA 608 (for HVAC), or preliminary NCCER credentials significantly boost hiring priority and starting pay.
- Leverage Veteran Pathways: Transitioning service members can utilize GI Bill benefits while enrolled in approved union apprenticeships to earn additional tax-free housing allowances (BAH) alongside standard apprentice wages.
Discover more from The Economy
Subscribe to get the latest posts sent to your email.

As rapid demographic aging, falling birth rates, and rising national debt pressures converge, governments worldwide face an unprecedented retirement security crisis. According to comprehensive benchmark research from the Mercer CFA Institute Global Pension Index, national pension architectures vary dramatically in their capacity to deliver adequate retirement income, long-term financial viability, and institutional trust.
While top-performing European and Asian nations have built resilient, multi-pillar retirement models, several major economies lag significantly behind, leaving millions of future retirees exposed to poverty and financial volatility.
The Global Evaluation Framework: How Pensions Are Measured
Comparative pension research published by the Monash University Centre for Financial Studies evaluates national retirement frameworks using 50+ individual indicators divided into three sub-indices:
- Adequacy (40% Weighting): Assesses base benefit levels, net pension replacement rates, tax incentives, homeownership rates, and personal savings structures.
- Sustainability (35% Weighting): Evaluates demographic dependency ratios, mandatory retirement ages, state debt levels, labor force participation among older workers, and economic growth potential.
- Integrity (25% Weighting): Examines regulatory oversight, governance standards, plan communication, operational transparency, and systemic trust.
Systems earning an A-Grade (Score > 80) feature first-class, robust retirement frameworks that deliver comprehensive benefits with strong future viability. Conversely, systems receiving a D-Grade (Score 35–50) exhibit structural vulnerabilities that threaten future retiree welfare without urgent reform.
Global Pension Systems Index Comparison
| Country | Overall Grade | Index Score | Adequacy Score | Sustainability Score | Integrity Score | Primary Architecture Type |
| Netherlands | A | 85.4 | 85.6 | 82.4 | 89.1 | Quasi-Mandatory Occupational / Public State |
| Iceland | A | 83.5 | 82.7 | 84.6 | 86.0 | Universal Mandatory Occupational & State |
| Denmark | A | 81.6 | 81.1 | 82.5 | 81.4 | Fully Funded Mandatory Occupational (ATP) |
| Singapore | A | 80.5 | 79.8 | 74.0 | 88.5 | Central Provident Fund (CPF) Mandatory Savings |
| Israel | A | 80.2 | 73.6 | 76.1 | 83.9 | Mandatory Pension Law & State Safety Net |
| United Kingdom | B | 72.2 | 68.5 | 65.2 | 87.1 | Auto-Enrolment Workplace & State Pension |
| United States | C+ | 61.1 | 63.9 | 60.1 | 59.5 | Social Security + Voluntary 401(k)/IRA |
| Japan | C | 56.3 | 60.2 | 46.5 | 68.1 | Two-Tier Public System & Corporate Plans |
| Argentina | D | 45.5 | 50.7 | 40.0 | 50.0 | Pay-As-You-Go Public Pension |
| Philippines | D | 42.7 | 38.9 | 52.5 | 35.0 | Social Security System (SSS) & Private Plans |
| India | D | 43.8 | 33.5 | 41.8 | 61.0 | National Pension System (NPS) & Provident Fund |
The World’s Top 5 Pension Frameworks (Grade A)
[Level 1: Universal Basic State Safety Net]
                 ↓
[Level 2: Mandatory Occupational / Workplace Pensions]
                 ↓
[Level 3: Voluntary Private Supplemental Savings]
1. Netherlands (Overall Score: 85.4)
The Dutch retirement system consistently sets the benchmark for global excellence. Combining a collective basic state pension (AOW) with quasi-mandatory, industry-wide occupational plans, the Netherlands yields net income replacement rates exceeding 80% for long-term workers. Extensive collective risk-sharing and stringent regulation by the Central Bank ensure high solvency and trust.
2. Iceland (Overall Score: 83.5)
Iceland’s system excels in long-term financial viability and labor participation. It relies on a multi-tiered framework comprising a basic state pension alongside mandatory occupational pension funds where both employers (minimum 11.5%) and employees (4%) contribute. Iceland maintains high labor force participation among workers aged 55 to 74, reinforcing systemic sustainability.
3. Denmark (Overall Score: 81.6)
Denmark relies on a basic public pension supplemented by fully funded occupational schemes (ATP) negotiated through collective labor agreements. High national savings rates, income redistribution for lower-wage earners, and transparent governance yield high marks across all three sub-indices.
4. Singapore (Overall Score: 80.5)
Reaching A-grade status for the first time in recent index evaluations, Singapore’s model centers around the state-administered Central Provident Fund (CPF). Mandatory contribution rates—up to 37% of wages split between employer and employee—are channeled into dedicated accounts for retirement, housing, and healthcare, delivering a high integrity rating.
5. Israel (Overall Score: 80.2)
Israel’s pension infrastructure combines a universal state old-age allowance with mandatory contributions to pension funds, provident funds, or insurance policies established under its Mandatory Pension Law. Strong capital accumulation and clear participant reporting underpin its top-tier status.
The World’s Struggling Pension Frameworks (Grade D)
India (Overall Score: 43.8)
India’s low score stems primarily from limited coverage within its large informal labor force. While the formal sector is served by the Employees’ Provident Fund Organisation (EPFO) and the National Pension System (NPS), the vast majority of workers lack access to formal retirement savings. According to World Bank Pension Data, expanding social pension safety nets for unorganized workers remains an urgent policy challenge.
The Philippines (Overall Score: 42.7)
The Philippine system, governed by the Social Security System (SSS) for private-sector workers and the Government Service Insurance System (GSIS) for public employees, faces challenges regarding benefit adequacy and regulatory integration. Low voluntary savings rates and limited coverage among self-employed individuals constrain its performance.
Argentina (Overall Score: 45.5)
Argentina’s pay-as-you-go (PAYGO) public pension structure has been heavily affected by high inflation, currency devaluation, and fiscal instability. Macroeconomic headwinds periodically erode the real purchasing power of monthly payouts, impacting its overall sustainability score.
Macro Trends Reshaping Retirement Security
   Demographic Aging           DB-to-DC Shift          Economic Volatility
(Higher Dependency Ratio)   (Risk Moves to Worker)    (Inflation & Debt)
           │                         │                         │
           └─────────────────────────┼─────────────────────────┘
                                     ▼
                     [Heightened Longevity & Savings Risk]
Data from the OECD Pensions at a Glance Report highlights three overarching structural pressures impacting pension systems worldwide:
- Shift from Defined Benefit (DB) to Defined Contribution (DC): Governments and employers continue transitioning away from guaranteed DB pensions toward DC plans (like 401(k)s and superannuation). While this reduces liabilities for employers, it transfers market investment, inflation, and longevity risks directly to individual retirees.
- Demographic Aging & Population Inversion: Extended life expectancies paired with declining fertility rates are compressing old-age dependency ratios. In many developed nations, the ratio of active workers supporting each retiree is projected to drop from 3.5:1 down to nearly 1.5:1 over the coming decades.
- The Gender Pension Gap: Policy analysis by the World Economic Forum reveals that women face retirement benefit gaps of 20% to 35% compared to men globally. Career breaks for caregiving, lower lifetime earnings, and part-time employment patterns contribute to lower accumulated retirement balances.
Strategic Blueprint: Policy Recommendations for Reform
To enhance long-term retirement security, policy experts recommend five key structural interventions:
- Implement Auto-Enrolment: Introduce mandatory or auto-enrolment workplace pension schemes to broaden coverage among private and gig-economy workers.
- Increase Retirement Ages: Align statutory retirement ages with life expectancy projections to support system sustainability.
- Protect Minimum Benefits: Establish non-contributory basic pensions to protect low-income and informal workers from poverty in old age.
- Promote Financial Literacy: Provide accessible financial advice and clear, mandatory benefit statements to empower employees in managing Defined Contribution accounts.
- Phase Out Early Withdrawal Provisions: Restrict access to retirement funds prior to official retirement age to prevent capital depletion.
Discover more from The Economy
Subscribe to get the latest posts sent to your email.

Anthropic Bans Sustained Abuse of Claude AI Under New Usage Policy Effective November 12, 2026

Jeff Bezos Three-Day Workweek View: What He Really Said

Celeste Frozen Pizza Discontinued: What Conagra Confirmed

US–China Critical Minerals Competition: Why a Trade Deal Cannot Fix Every Supply Risk

Oil Price Outlook 2026: How Supply Risks Reach Fuel Bills, Inflation and Business Costs

AI in Business 2026: Why Faster Employees Do Not Automatically Mean Higher Profits

Mortgage Rates in 2026: Why They Remain High and How to Compare the True Cost

Gold Price Outlook 2026: The Forces Behind the Forecasts—and What Could Reverse Them

Global Economic Outlook 2026: Growth, Inflation and Risks

Trump–Putin Diesel Deal: Why Zelensky Is Angry and What It Means for Fuel Prices

Anthropic Draws the Line: Why Claude’s New Usage Policy Explicitly Bans ‘Cruel Behavior’ Toward AI

Ynon Kreiz & Mattel’s Digital Transformation: Franchise Strategy and Financial Growth

Crude Oil & Petroleum Market Analysis: OPEC+ Decisions and Price Forecasts

Top US Convenience Store Chains: Store Counts, EV Charging, and Sales Trends

Oil Prices Break $100 in 2026: Middle East Conflict & Energy Markets

China Stocks Today: Are Big Economies in Asia Nearing a Market Bottom?

Middle East War Economics 2026: Oil Prices & Energy Markets

PSX Forecast 2026: KSE-100, IMF Reviews & Geopolitics

Crypto Daily Outlook: Bitcoin, Altcoins, and the Future of Decentralized Finance

Global Pension Systems Ranked: The World’s Best and Worst Retirement Frameworks

Enterprise AI Platforms Disrupting B2B SaaS in 2026: Full Analysis

World’s Largest Economies: Ranking the Top Global Powers

Elon Musk’s Next Moves: Disrupting the 2026 Global Economy

Pakistan Economy 2026: Inside the SBP’s Balancing Act

GasBuddy Market Insights: How Crude Price Shifts Impact Local Fuel Cost Averages

World Bank & IMF Reports 2026: Why the “3% Growth” Consensus Is Actually a Debate

Global Equity Market Divergence: US Tech vs. European Dividend Stocks vs. Asian Growth

Stock Market Today: Dow Climbs 500 Points as Markets Shake Off Inflation Jitters
-

 Markets & Finance9 months ago
Top 15 Stocks for Investment in 2026 in PSX: Your Complete Guide to Pakistan’s Best Investment Opportunities
-

 Analysis8 months ago
Johor’s Investment Boom: The Hidden Costs Behind Malaysia’s Most Ambitious Economic Surge
-

 Analysis8 months ago
Top 10 Stocks for Investment in PSX for Quick Returns in 2026
-

 Banks9 months ago
Best Investments in Pakistan 2026: Top 10 Low-Price Shares and Long-Term Picks for the PSX
-

 Analysis8 months ago
Brazil’s Rare Earth Race: US, EU, and China Compete for Critical Minerals as Tensions Rise
-

 Investment9 months ago
Top 10 Mutual Fund Managers in Pakistan for Investment in 2026: A Comprehensive Guide for Optimal Returns
-

 Global Economy10 months ago
15 Most Lucrative Sectors for Investment in Pakistan: A 2025 Data-Driven Analysis
-

 Global Economy10 months ago
Pakistan’s Export Goldmine: 10 Game-Changing Markets Where Pakistani Businesses Are Winning Big in 2025