
Asia
Global Equity Market Divergence: US Tech vs. European Dividend Stocks vs. Asian Growth


S&P 500 at 7,620, FTSE at 10,698, Nikkei at 64,136. Compare US tech, European dividends and Asian growth as three central banks split on rates.
Executive Summary / Key Takeaways
- The three major regions are now priced off three different monetary regimes: the Fed hiking into strength, the ECB hiking into weakness, and the Bank of Japan normalising from near zero.
- On the day of the Fed’s hike, the Dow fell more than 600 points while the Nasdaq finished close to flat — a clean demonstration that “US equities” is no longer a single exposure.
- European indices held up: the FTSE 100 sat at 10,697.57 (+0.44%) while the DAX at 25,440.81 and Euro Stoxx 50 at 6,260.38 slipped.
- Japan outperformed on currency mechanics, with the Nikkei at 64,136 and the Topix at 4,094.
- Yardeni Research cut its year-end S&P 500 target to 7,900 from 8,400, citing yield pressure from rising energy prices.
Regional equity allocation has spent a decade being a low-conviction decision. Global indices moved together, US technology led, and everything else was a funding source. September 2026 broke that pattern within a single trading week.
The trigger was monetary divergence. The Federal Reserve raised rates to 3.75%–4.00% on 16 September. The ECB had already lifted its deposit rate to 2.5% on 10 September. The Bank of England held at 3.75% on a 6-3 split on 17 September, and the Bank of Japan is expected to hike on 18 September.
Four decisions, four different directions of travel, four different equity responses. That is the environment retail investors and portfolio managers now have to allocate into.
2. Core Market Analysis
2.1 The comparison matrix
| Region / Index | Level | Move | Monetary regime | Primary source |
|---|---|---|---|---|
| S&P 500 (US) | 7,619.98 | -0.48% | Fed tightening; ≥1 more hike signalled | Yahoo Finance |
| Nasdaq Composite (US) | 26,186.41 | -0.56% | Duration-sensitive; held up on Fed day | Yahoo Finance |
| Dow Jones (US) | 52,421.20 | -0.29% | Fell 600+ pts on the hike itself | Yahoo Finance |
| FTSE 100 (UK) | 10,697.57 | +0.44% | BoE on hold at 3.75% | Yahoo Finance |
| DAX (Germany) | 25,440.81 | -0.50% | ECB at 2.5% deposit rate | Yahoo Finance |
| CAC 40 (France) | 8,117.78 | -0.76% | ECB at 2.5% deposit rate | Yahoo Finance |
| Euro Stoxx 50 | 6,260.38 | -1.02% | Weakest major European print | Yahoo Finance |
| Nikkei 225 (Japan) | 64,136 | +0.33% | BoJ normalising; weak yen tailwind | Trading Economics |
| Hang Seng (HK) | 24,713 | +0.2% | Pegged; HKMA hiked to 4.25% | Trading Economics |
| VIX | 17.10 | +7.95% | Volatility bid but not stressed | Yahoo Finance |
2.2 US: the index is not the market
The single most revealing datapoint of the week was the internal dispersion on Fed day. Stocks turned lower during Warsh’s press conference as markets read his remarks as hawkish, with the Dow leading losses down more than 700 points at one stage — over 1.6% — while the S&P 500 declined 0.4% and the Nasdaq slid just below flat, Yahoo Finance reported.
Conventional rate logic says long-duration growth should suffer most when yields rise. It did not. The cyclical, energy-exposed and rate-sensitive parts of the market took the damage instead: J.B. Hunt Transport fell 12.64% after warning on earnings and rising operating costs, Diamondback Energy dropped 8% amid concerns over inflation, rising Treasury yields and crude-market geopolitical risk, and APA Corp fell 5.2%, according to TheStreet’s market coverage. Optical and photonics names rebounded, with Coherent and Lumentum each up around 6%.
The forward view has been trimmed. Yardeni Research cut its year-end S&P 500 target to 7,900 from 8,400 — implying 4.1% upside from Tuesday’s close of 7,585.73 rather than the 11% its previous estimate implied — citing higher Treasury yields due to rising energy prices and increased downturn risk over the next three to six months, CNBC reported.
2.3 Europe: the dividend case
European equities are not outperforming on growth. Euro-area output is projected around 1.3% for 2026 by the IMF, with the region benefiting less than others from the technology-driven investment boost and lingering energy-price effects still dragging on manufacturing.
They are outperforming, where they are, on payout and valuation. With the ECB deposit rate at 2.5% — the loosest of the major blocs — the yield competition from cash and short-dated bonds is materially weaker in Europe than in the US, where the funds rate is now 3.75%–4.00% and the 10-year has topped 5%. That relative-yield arithmetic is the structural argument for European income equity in this cycle, and it holds regardless of European growth being mediocre.
The UK sits awkwardly between the two. The FTSE’s commodity and energy weighting makes it a partial beneficiary of the same oil shock hurting importers elsewhere, which explains its positive print against a broadly weaker European tape.
2.4 Asia: growth with a currency asterisk
Japan’s advance came from yen weakness after the Fed decision, which improved the earnings outlook for export-focused industries, Trading Economics noted. Hong Kong’s caution came from the HKMA following the Fed with a hike to 4.25%, pressuring property.
The regional growth case is real — East Asia and Pacific is projected at 4.2% for 2026 and South Asia at 6.3% by the World Bank — but a meaningful share of recent Japanese equity return has been a currency effect that BoJ normalisation will erode.
3. Structural Drivers and Competitor Gaps
The gap in most comparative coverage is treating this as a regional rotation call. It is better understood as three separate factor exposures that happen to have geographic labels:
- US large-cap technology is a duration and AI-capex exposure. It held up on Fed day because the AI investment cycle is currently a stronger driver than the discount rate. Both the IMF and World Bank cite broader AI adoption as the principal upside risk to global growth. If that capex cycle cools, the rate sensitivity reasserts itself immediately.
- European income equity is a relative-yield exposure. Its attractiveness is a function of the ECB-Fed policy gap, not of European fundamentals. Narrow the gap and the case weakens.
- Asian growth equity is partly a currency exposure. Particularly in Japan, where the return decomposition between earnings and FX is doing more work than most allocators acknowledge.
Correctly labelled, these are not substitutes for one another. The diversification benefit of holding all three is higher in 2026 than at any point in the past decade — which is the practical conclusion most aggregator coverage fails to reach.
4. Key Implications for Stakeholders
Retail investors. A global index fund currently buys you a heavy weighting to a single factor: US technology and its AI capital-expenditure cycle. If that is the intended exposure, fine. If not, deliberate regional allocation is required to get it.
Portfolio managers. Volatility is bid but not stressed, with the VIX at 17.10 — an unusually calm reading given four central bank decisions in eight days and crude above $100. That combination favours adding hedges while they remain inexpensive rather than after a repricing.
Income investors. The yield hurdle is regional now. In the US, equity income competes against a 10-year above 5%. In the euro area, it competes against a 2.5% deposit rate. The same dividend yield is a materially better proposition in one market than the other.
Risk teams. Cross-regional correlation assumptions built on the 2015–2021 regime are stale. Three distinct monetary cycles produce genuinely differentiated drawdown paths.
5. Frequently Asked Questions
Q1: Why did the Nasdaq hold up while the Dow fell after the Fed hike?
The damage concentrated in cyclical, transport and energy-exposed names rather than long-duration technology. Investors are currently treating the AI capital-expenditure cycle as a stronger earnings driver than the discount rate is a valuation headwind.
Q2: Are European dividend stocks more attractive than US equities now?
On relative yield, arguably. The ECB deposit rate is 2.5% against a US funds rate of 3.75%–4.00% and a 10-year Treasury above 5%, so European equity income faces far weaker competition from cash and bonds. European growth, however, remains around 1.3%.
Q3: What is the current S&P 500 level and forecast?
The S&P 500 was at 7,619.98. Yardeni Research cut its year-end target to 7,900 from 8,400, implying roughly 4% upside, citing higher Treasury yields driven by rising energy prices.
Q4: Which region offers the best equity growth in 2026?
Asia on headline growth — East Asia and Pacific at 4.2% and South Asia at 6.3% per World Bank forecasts. But a meaningful share of recent Japanese equity returns reflects yen weakness rather than earnings, and Bank of Japan normalisation erodes that tailwind.
Discover more from The Economy
Subscribe to get the latest posts sent to your email.



Asian equity markets have delivered a reminder that the AI investment boom is not simply an American technology story. South Korean memory producers, Taiwanese chip manufacturers, Japanese equipment suppliers and regional exporters are connected to global capital spending on computing. That creates an opportunity when orders surge and a vulnerability when assumptions change.
A Reuters market report on October 13 described a sharp risk-off episode in technology-linked Asian shares. Subsequent Wall Street Journal coverage described a partial rebound. Those moves are best understood as a test of expectations, not as proof that regional growth has reversed.
The first link: US AI spending and Asian earnings
The global chip supply chain has multiple layers. Advanced logic semiconductors, high-bandwidth memory, equipment, materials and packaging each respond differently to investment cycles. An AI server ordered in the United States can create revenue for numerous Asian firms, while supplier earnings remain vulnerable to delays or changes in product mix.
This concentration means broad stock indices may react strongly to a relatively narrow group of companies. The movement of an index is not necessarily a reliable representation of household consumption or the local services economy. Readers should check the contribution of leading constituents before interpreting a headline percentage drop.
Korea, Taiwan and Japan have different exposures
Korea’s market has significant memory-chip exposure. Taiwan has a major role in contract semiconductor manufacturing and its suppliers. Japan combines technology-related manufacturers with banks, exporters and domestic sectors. Exchange rates can amplify or offset changes in export competitiveness and returns for foreign investors.
Currency matters especially when an investor buys shares denominated in won, Taiwan dollars or yen. Even if a local index is unchanged, the return measured in dollars can change because of foreign-exchange movements. A regional market roundup should therefore include both equity and currency context.
Interest rates and oil can overwhelm the chip narrative
The AI industry competes for capital with governments, housing and ordinary businesses. When bond yields climb, distant profits are discounted more heavily; heavily indebted firms face rising refinancing expenses. Meanwhile high energy prices can pressure importers and manufacturers even when some technology exporters remain strong.
The IMF’s October outlook highlights both AI-related opportunities and inflation, conflict and fiscal vulnerabilities. That mixed picture argues against a single “Asia is booming” or “Asia is crashing” explanation.
The danger of extrapolating one trading session
A large daily decline can reflect positioning, forced selling or an abrupt change in sentiment. A rebound can reflect bargain hunting or short covering without resolving the original valuation issue. Neither movement establishes a sustainable trend. Investors should connect price action to revisions in earnings guidance, orders and financing conditions.
Useful evidence includes export orders, manufacturing surveys, semiconductor inventories, central-bank signals and capital flows. Compare the same measures over several months and distinguish expectations from realized data.
How to follow Asian markets responsibly
Build a dashboard with major indices, local-currency performance, exchange rates, benchmark bond yields and relevant oil prices. Record dates and market closing times; an Asian close may precede major US news that influences futures later. Avoid combining prices from different sessions as though they represent the same moment.
For a long-term investor, diversification across sectors and countries matters more than guessing the next technology stock to rebound. For a news reader, the essential question is whether a market move reflects an earnings change, financing risk or only a revision to how much investors are willing to pay.
Market structure can magnify headline moves
Market-capitalization-weighted benchmarks allocate more influence to companies with high market value. As chip and platform businesses grow, their success can make an index more concentrated. During a drawdown, selling pressure in those same names may dominate the index even if the median constituent is relatively stable. Equal-weighted sector comparisons and the share of stocks advancing can help distinguish broad weakness from concentration effects. Investors should also review whether an exchange was closed for a holiday and whether a quoted movement refers to a futures contract or the cash session. Time alignment is essential when comparing Asian and US markets.
Frequently asked questions
Why do Asian markets fall when US AI stocks sell off?
Regional firms supply chips, memory and equipment to the same global investment cycle, and investors frequently adjust exposure across markets at once.
Is a rebound proof the AI bubble is over?
No. Price recoveries do not necessarily resolve doubts about future returns and financing.
Which numbers are worth monitoring?
Earnings expectations, memory prices, exports, bond yields, currencies and oil prices give a more balanced picture than an index close alone.
Discover more from The Economy
Subscribe to get the latest posts sent to your email.
Markets & Finance
Beyond Singapore’s Borders: How Squeezed SMEs Can Unlock High-Yield Growth Across ASEAN

Faced with escalating domestic overhead, acute labor bottlenecks, and an ultra-saturated local market, Singapore’s small and medium-sized enterprises (SMEs) are approaching an operational inflection point. While the city-state remains an unrivaled global financial hub, domestic cost structures are increasingly compressing profit margins for mid-market businesses. Expanding across Southeast Asia is no longer merely a growth option—it has become a necessity for enterprise resilience and long-term value creation.
The Singapore Pressure Cooker: Why Domestic Growth Has Hit a Ceiling
Singapore SMEs contend with a uniquely challenging operating environment. According to economic assessments from the Monetary Authority of Singapore, structural cost pressures—spanning commercial real estate rents, utility hikes, and rising labor expenses—continue to outpace revenue growth across several non-oil domestic sectors.
Key factors squeezing Singapore SMEs include:
- Manpower Bottlenecks: Tightening foreign worker quotas and elevated salary thresholds under the Strategic Skills Framework have made local talent recruitment highly competitive and expensive.
- Property and Rental Overhead: Commercial and industrial space costs in prime logistics and office hubs remain among the highest in Asia, squeezing operational margins for retail, manufacturing, and services alike.
- Market Saturation: With a population of roughly 6 million, the domestic addressable market limits scale, making revenue compounding difficult without international customer acquisition.
To achieve sustainable multi-year growth, forward-looking business leaders are restructuring their footprint—using Singapore as an intellectual property (IP), treasury, and management headquarters while scaling operations into neighbor economies.
The ASEAN Dividend: Demographics, Digitalization, and Supply Chain Realignment
Southeast Asia represents a vibrant economic bloc of over 680 million consumers, characterized by rapid urbanization, an expanding middle class, and high mobile technology penetration. Research published by the Asian Development Bank highlights that regional GDP growth across ASEAN continues to outpace global averages, fueled by strong domestic demand and cross-border trade integration.
                  +-------------------------------------------------------+
                  |            Singapore Corporate Head Office            |
                  |     (IP, Treasury, Governance, R&D, Tech Core)        |
                  +-------------------------------------------------------+
                                              |
      +-----------------------+---------------+---------------+-----------------------+
      |                       |                               |                       |
      v                       v                               v                       v
+-----------+           +-----------+                   +-----------+           +-----------+
|  Vietnam  |           | Indonesia |                   | Malaysia  |           | Thailand  |
| (Mfg/Tech)|           | (Consumer)|                   | (Logistics|           | (Industrial|
|           |           |           |                   | & Services|           | & Auto Ops|
+-----------+           +-----------+                   +-----------+           +-----------+
Three macro drivers make ASEAN the primary expansion target for Singaporean firms:
- Supply Chain Diversification (“China+1”): Global multinationals and regional enterprises are diversifying manufacturing hubs toward Southeast Asia to enhance supply chain resilience, boosting local business ecosystems.
- Accelerated Digital Transformation: Digital economy report insights from McKinsey & Company reveal that regional cross-border e-commerce, fintech adoption, and digital services are projected to triple in market value by 2030.
- Regional Trade Integration: Agreements such as the Regional Comprehensive Economic Partnership (RCEP) and ASEAN Free Trade Area (AFTA) reduce trade barriers, lower tariffs, and simplify cross-border logistics.
Comparative Expansion Matrix for Target ASEAN Markets
Selecting the right expansion destination depends on sector alignment, talent requirements, and cost structures. The following framework maps core opportunities for Singapore SMEs across major ASEAN growth markets:
| Expansion Market | Primary Growth Drivers | Strategic Cost Advantage | High-Potential Sectors | Market Entry Complexity |
| Vietnam | Rapid industrialization, tech talent pool, strong export orientation | Low manufacturing and engineering labor costs | Precision engineering, electronics, software development | Moderate (Requires navigating local regulatory channels) |
| Indonesia | Massive domestic market (275M+ population), rising consumer class | High consumer volume potential, lower operational costs | B2C e-commerce, consumer tech, logistics, agritech | Moderate to High (Complex licensing & local partner rules) |
| Malaysia | Proximity to Singapore, shared talent language, integrated supply chains | Lower land and talent costs with minimal cultural friction | Cross-border logistics, professional services, food manufacturing | Low (High synergy with SG business models) |
| Thailand | Strong industrial base, advanced infrastructure, EV ecosystem | Cost-effective industrial facilities and skilled labor | Advanced manufacturing, automotive supply, healthcare, tourism tech | Moderate (Language barriers require local executive talent) |
A 4-Step Actionable Roadmap for Overseas Regionalization
Expanding across borders requires structured execution to avoid capital misallocation. Enterprise leaders can adopt this four-phase framework to mitigate market entry risks:
- Leverage Institutional Support and Co-FundingBefore committing capital, utilize government-backed regionalization initiatives. Programs administered by Enterprise Singapore—such as the Market Readiness Assistance (MRA) grant and the Enterprise Development Grant (EDG)—provide co-funding for market studies, legal set-up, and overseas business matching.
- Adopt a “Hub-and-Spoke” Operational ModelMaintain high-value activities (financing, IP management, advanced R&D, regional leadership) in Singapore to preserve institutional trust and regulatory clarity. Establish operational “spokes” in target ASEAN countries to handle high-volume manufacturing, customer support, and local marketing.
- Form Local Joint Ventures and Strategic AlliancesDirect market entry can carry regulatory hurdles and cultural blind spots. Partnering with established in-market distributors or joint-venture partners accelerates distribution access and ensures regulatory compliance.
- Capitalize on Cross-Border Digital InteroperabilityWith initiatives backed by the ASEAN Secretariat to build unified cross-border payment rails (such as real-time QR payment linkages between Singapore, Malaysia, Thailand, and Indonesia), businesses can handle cross-border payments with reduced friction and lower FX transaction costs.
Mitigating Risk: Structural Protocols for Cross-Border Success
While the growth prospects are significant, cross-border expansion presents operational challenges. SME leadership must address key risk categories:
- Regulatory and Foreign Ownership Restrictions: Certain jurisdictions enforce foreign ownership caps in specific sectors. Engaging qualified legal counsel early ensures proper corporate structuring and compliance with local equity mandates.
- Foreign Exchange Exposure: Currency volatility across emerging ASEAN markets can erode operating profits. Implementing formal hedging policies through treasury banking partners mitigates FX exposure.
- Taxation Structuring: Companies must optimize transfer pricing and leverage bilateral Avoidance of Double Taxation Agreements (DTAs) signed between Singapore and ASEAN member states to avoid overlapping tax obligations.
SMEs that treat regional expansion as a strategic imperative rather than a reactive survival tactic can leverage Singapore’s regional anchor status to capture long-term market share across Southeast Asia.
Discover more from The Economy
Subscribe to get the latest posts sent to your email.
Are Asian stock markets rising in 2026?
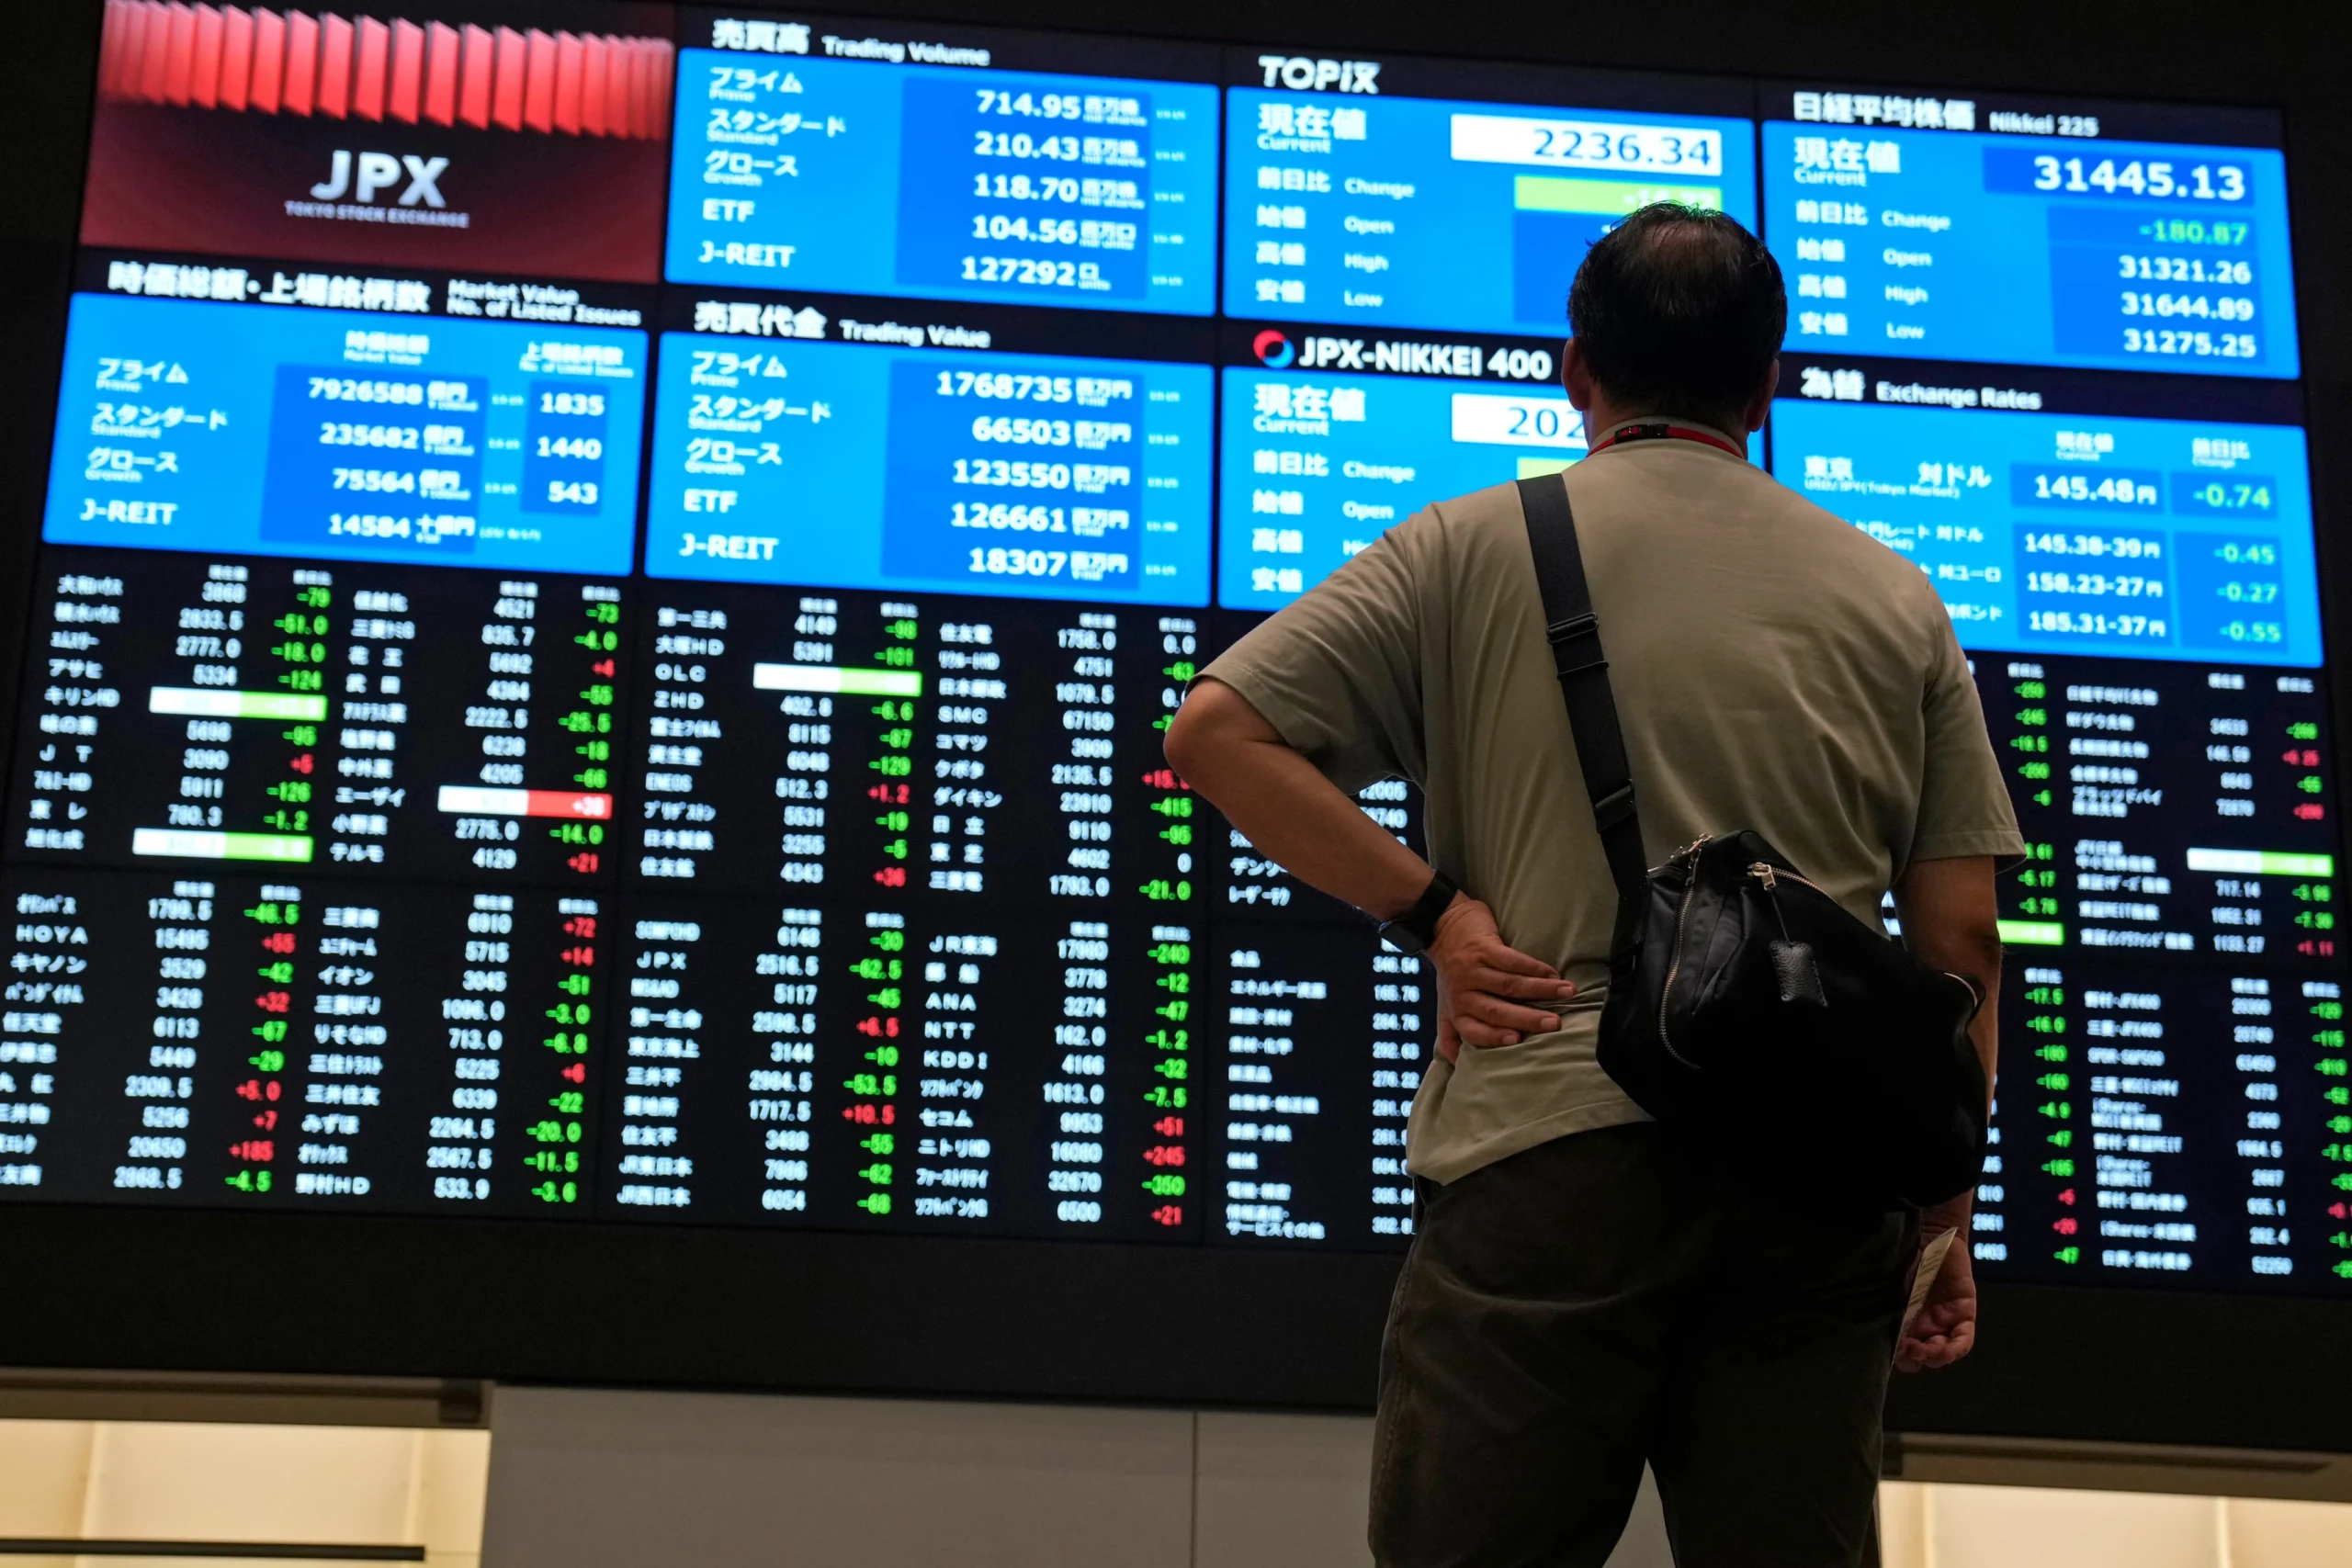
Most of them are, but for very different reasons. Japan’s Nikkei 225 is trading at levels roughly 44% higher than a year ago on continued AI-linked technology strength; China’s benchmark indices climbed to multi-year highs at the start of the year on AI optimism and signs of economic recovery; and Pakistan’s KSE-100 has been one of the most volatile large gainers globally, crossing record highs early in the year before enduring sharp single-session pullbacks in September. Understanding each market separately matters more than treating “Asia” as one trade.
Japan: A 15-Year-Plus Bull Run Meets a Hawkish Central Bank
The Nikkei 225 closed at 65,018.95 on September 18, 2026, gaining 1.38% on the session and sitting 44.34% above where it stood a year earlier, according to data compiled by Trading Economics. That move came even as the Bank of Japan raised its policy rate by 25 basis points to 1.25% — a widely expected but still consequential tightening step, as policymakers balance elevated inflation and wage growth against pressure from U.S. Treasury Secretary Scott Bessent for currency and trade cooperation. Japan’s annual inflation rate held at 1.9% in August, with core inflation at 1.7% — below the Bank of Japan’s 2% target for a seventh straight month, suggesting the central bank still has room to normalize policy gradually rather than aggressively.
Technology and AI-related names have led Japan’s rally, with chip-equipment and materials names such as Advantest and Lasertec posting some of the sharpest single-day gains, echoing similar advances on Wall Street. That correlation is a theme across the region: Asian equity performance in 2026 has tracked the U.S. AI-capex story almost as closely as it has tracked domestic fundamentals.
China: AI Optimism Meets an Overheating Warning
China’s equity markets opened 2026 on a tear. The benchmark CSI 300 Index advanced 1.6% to close at its highest level in four years on January 6, while the Shanghai Composite rose 1.5% to its strongest level since July 2015, fueled by sustained optimism over the country’s AI advances and early signs of broader economic recovery, according to Bloomberg. Materials and technology shares led the advance, and the rally coincided with a robust pipeline of onshore AI-related IPOs.
That said, the rally showed early signs of overheating even in January: the 14-day relative strength index on the Shanghai Composite climbed above 75 — firmly into technical overbought territory — a level it had not touched since the previous September. Momentum has been uneven since; by late July, the Shanghai Composite had pulled back to a 16-week low on the CSI 300 gauge even as the broader index posted modest daily gains, reflecting a market still working through the tension between AI-driven optimism and valuation discipline. On the macro side, the IMF’s own China growth revisions this year have tracked a similar push-pull, with earlier 2025 forecasts putting Chinese growth near 4.8% before moderating toward roughly 4.2% as trade and property-sector headwinds persist.
Malaysia and Singapore: Steady Gains, Regional Correlation
Malaysia’s FTSE Bursa Malaysia KLCI has spent much of 2026 grinding toward multi-year highs rather than posting dramatic single-day swings. The index touched a more-than-six-year high near 1,686 points in early January, according to New Straits Times, and by early September had climbed further to around 1,714–1,715 points, per Bursa Malaysia futures data reported by Bernama, Malaysia’s state news agency. Analysts at Rakuten Trade have described the index as being in a healthy uptrend across both short- and long-term timeframes, with pullbacks read as consolidation rather than a change in trend.
Singapore’s Straits Times Index has moved in tandem with regional sentiment through the year, trading in the high-3,900-point range during mid-2026 sessions alongside comparable moves in Hong Kong’s Hang Seng and South Korea’s Kospi — a reminder that Southeast Asian and Northeast Asian benchmarks remain tightly correlated on any given trading day, even when their underlying economic drivers differ.
Pakistan: The Region’s Most Volatile Outperformer
Featured Snippet Target: Pakistan’s KSE-100 Index began 2026 at a record high above 176,000 points, climbed further past 186,000 and 188,000 in the following days on institutional buying and expectations of a policy rate cut, but has since seen sharp single-session pullbacks — including a 3,078-point, 1.79% drop on September 10 — underscoring how the world’s best-performing frontier market in early 2026 has also been among its most volatile.
The Pakistan Stock Exchange’s rally traces back to a shift in domestic asset allocation: brokerage house Topline Securities described the move from fixed-income instruments into equities — driven by falling returns on traditional savings vehicles — as the primary fuel behind sustained liquidity and elevated valuations, according to coverage from Aaj News. Banking names including United Bank Limited, Habib Bank, and MCB, alongside energy majors like Oil and Gas Development Company, have repeatedly featured among the index’s top contributors on both up and down days.
By early September, the picture had turned choppier. The KSE-100 gained 399 points on September 4 to close at 175,328, per ARY News, before dropping over 3,000 points just days later on September 10 — a reminder that Pakistan’s rally, while historic in percentage terms, remains far more sensitive to single-session sentiment shifts than its larger regional peers.
The Cross-Market Pattern
Three threads tie these otherwise disconnected markets together in 2026. First, AI-linked capital spending is now a genuine cross-border driver — Japanese and Chinese tech names have both rallied on echoes of the same U.S. hyperscaler capex story. Second, central bank policy divergence is widening: Japan is tightening from historically ultra-loose settings, while Pakistan has been cutting rates to support a still-fragile broader economy. Third, frontier and emerging markets — Pakistan chief among them — are delivering far larger percentage swings, in both directions, than developed Asian benchmarks, rewarding investors who can tolerate volatility but punishing those who chase momentum without hedging for pullbacks.
The Bottom Line
Asia’s 2026 story is not one market but five distinct ones moving on different clocks — Japan’s AI-and-rate-hike rally, China’s optimism-versus-overheating tension, Malaysia and Singapore’s steadier regional drift, and Pakistan’s high-beta swings around a genuine structural re-rating. Anyone allocating across the region needs a market-by-market view rather than a single “Asia” thesis.
Next step: Track Bank of Japan policy meetings, China’s Politburo economic guidance sessions, and Pakistan’s State Bank Monetary Policy Committee decisions together — the three events, spaced through the remainder of 2026, are the clearest near-term catalysts for each market’s next move.
Discover more from The Economy
Subscribe to get the latest posts sent to your email.

China’s 175 Trillion AI Tokens Reveal a Bigger Shift: The AI Boom

The Philippines’ Stagflation Trap: Higher Interest Rates

Alphabet’s $500 Billion Reckoning: Wall Street Is Losing Patience With the AI Boom

4 Reasons Why China’s Trade Concessions to Europe Will Not Solve the Crisis

The AI Revolution Needs Atomic Power. Southeast Asia Is Ready to Build It.

Zhuhai Airshow 2026: How China’s Stealth Jets, Drones and Missiles Are Redrawing Global Air Power

The $8 Billion Runway: China’s Strategic Bet on Guangzhou and the Future of Aviation

The Sandbox Imperium: Why Beijing’s Digital Yuan Needs Hong Kong

Gold at the $4,000 Line: Possible December Fed Hike

Oil at $100+: Hormuz, a Qatari Peace Draft and the Iran Deadline

The Fed’s 10-2 Hold: Why Two Dissenters Wanted a Rate Hike

SBP Raises Policy Rate to 12%: What It Means for Your Loans, Savings and Business

IMF’s $1.2bn Staff-Level Deal: What Pakistan Promised on Surplus

Decoding the DBS–BCA Merger Rumour: Market Volatility, Strategic Realities

Crude Oil & Petroleum Market Analysis: OPEC+ Decisions and Price Forecasts

Top US Convenience Store Chains: Store Counts, EV Charging, and Sales Trends

Social Security Extra $90 Deposit: Who Qualifies for the October 2026 Medicare Rebate?

Who Is Shivon Zilis? The Neuralink Executive at the Center of the Musk–OpenAI Trial

Gold Price Outlook 2026: The Forces Behind the Forecasts—and What Could Reverse Them

Algorithmic Dogfights: Why the U.S. and China Must Establish Rules of Engagement for Autonomous Air Power

Corporate America Faces a New Debt Test as US Borrowing Costs Surge

Global Economic Outlook 2026: 7 Forces Reshaping Markets, Trade and Business

Stock Market Crash in 2026? Warning Signs, Scenarios and a Calm Investor Checklist

Stock Market Today: Dow, S&P 500, and Nasdaq Retreat as Treasury Yields

US–Iran Conflict in October 2026: Hormuz, Oil Prices and Diplomacy

Anthropic Bans Sustained Abuse of Claude AI Under New Usage Policy Effective November 12, 2026

Geopolitics and Your Portfolio: How International Affairs Move Global Markets

Why Did I Get $90 From Social Security? 8 Reasons Behind an Unexpected SSA Payment
-

 Markets & Finance10 months ago
Top 15 Stocks for Investment in 2026 in PSX: Your Complete Guide to Pakistan’s Best Investment Opportunities
-

 Analysis8 months ago
Johor’s Investment Boom: The Hidden Costs Behind Malaysia’s Most Ambitious Economic Surge
-

 Analysis9 months ago
Top 10 Stocks for Investment in PSX for Quick Returns in 2026
-

 Banks10 months ago
Best Investments in Pakistan 2026: Top 10 Low-Price Shares and Long-Term Picks for the PSX
-

 Analysis9 months ago
Brazil’s Rare Earth Race: US, EU, and China Compete for Critical Minerals as Tensions Rise
-

 Investment10 months ago
Top 10 Mutual Fund Managers in Pakistan for Investment in 2026: A Comprehensive Guide for Optimal Returns
-

 Global Economy10 months ago
15 Most Lucrative Sectors for Investment in Pakistan: A 2025 Data-Driven Analysis
-

 Global Economy10 months ago
Pakistan’s Export Goldmine: 10 Game-Changing Markets Where Pakistani Businesses Are Winning Big in 2025