
Fintech & Global Finance
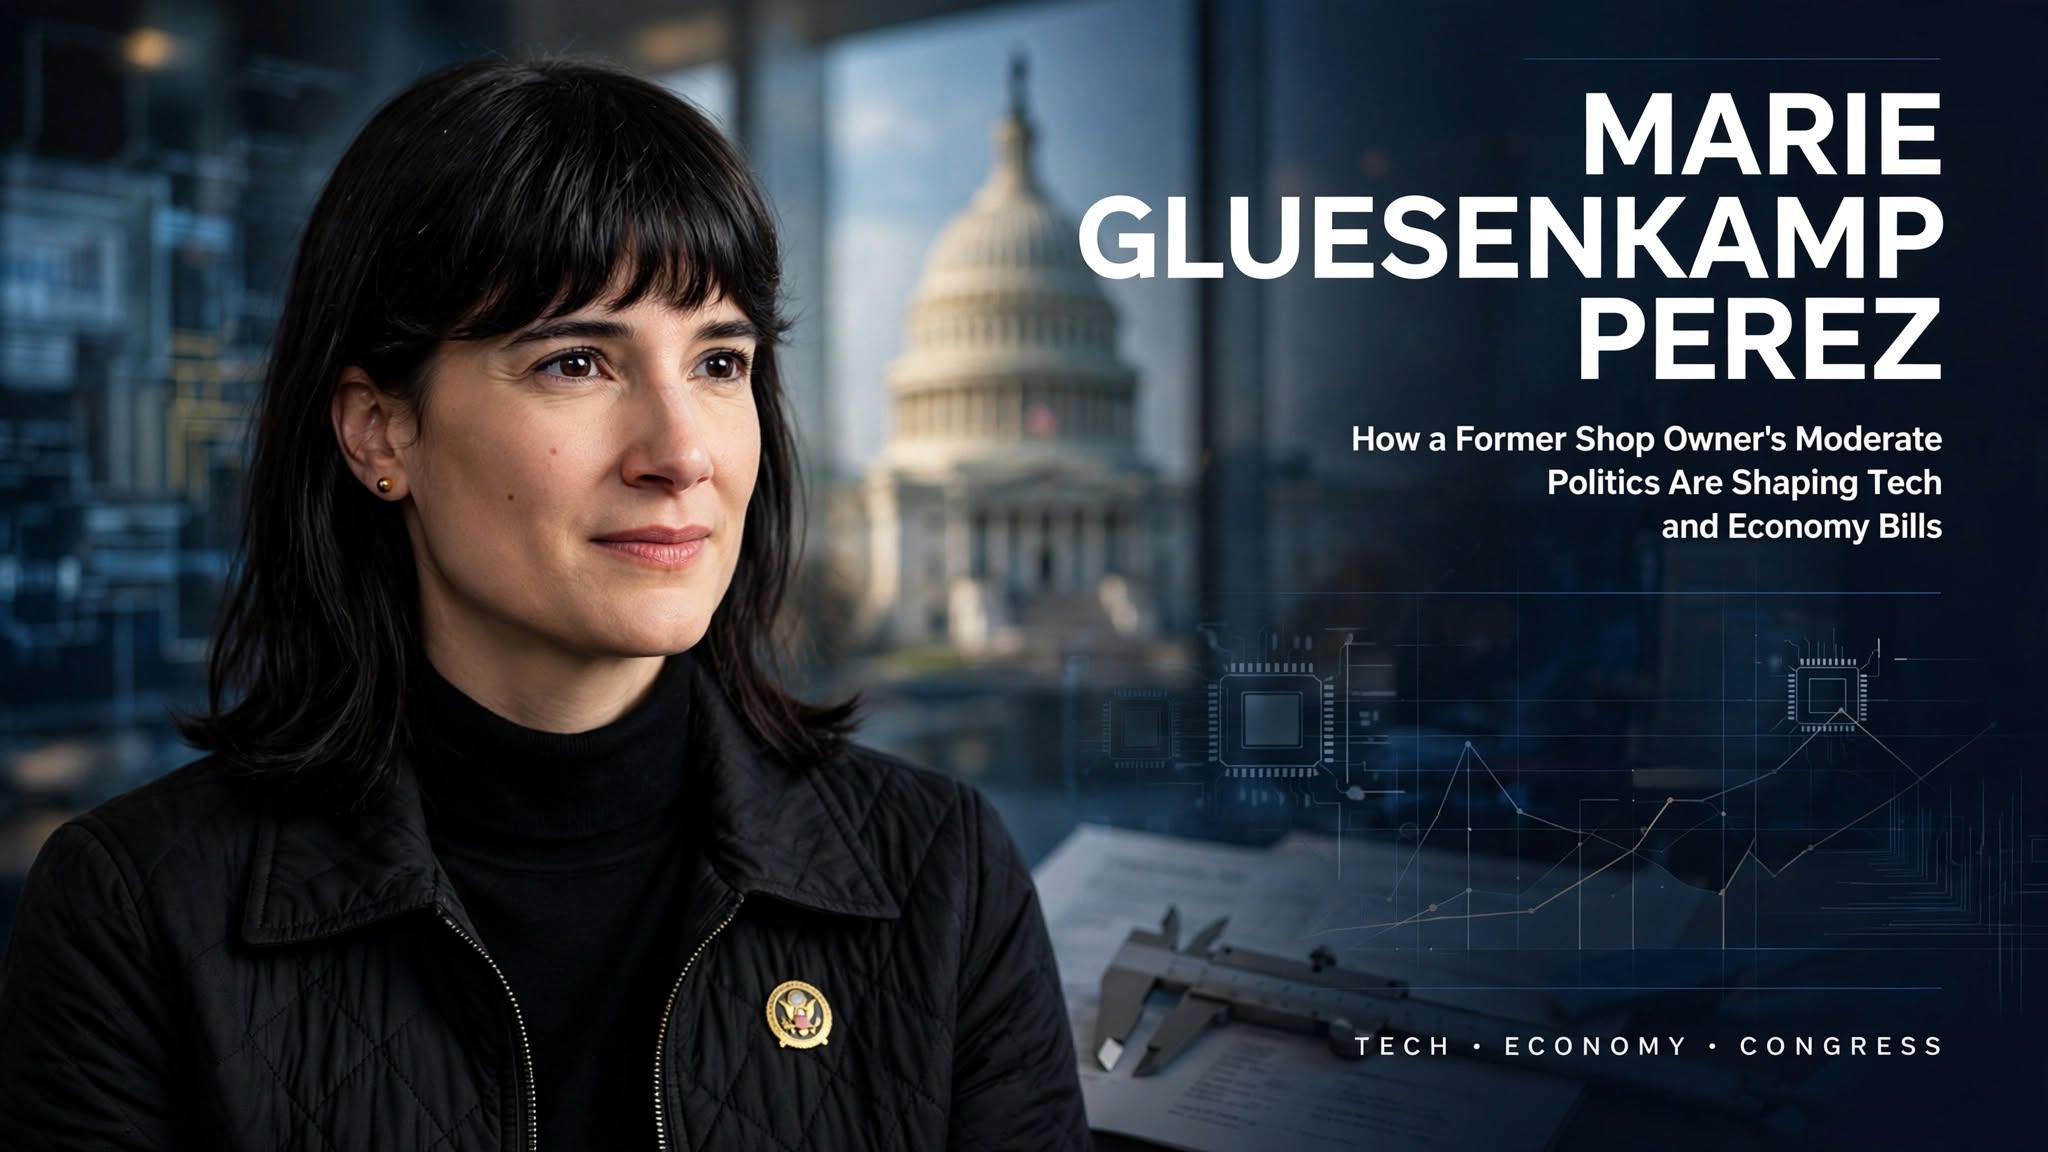
Marie Gluesenkamp Perez: How a Former Shop Owner’s Moderate Politics Are Shaping Tech and Economy Bills

Key Takeaways
- Rep. Marie Gluesenkamp Perez (D-WA-3), a former auto repair shop co-owner, has built a legislative record centered on right-to-repair, trades workforce development, and semiconductor manufacturing funding.
- She helped secure a $105 million federal investment for Analog Devices, including $80 million for Pacific Northwest projects, to modernize domestic semiconductor fabrication — reinforcing Washington’s “Silicon Forest” manufacturing base.
- Described as one of the House’s most centrist Democrats, she sits in the Problem Solvers Caucus, the Blue Dog Coalition, and the Congressional Hispanic Caucus, and serves on the House Appropriations Committee.
- She is seeking a third term in the 2026 midterms against Republican John Braun, the Washington State Senate minority leader.
- Her legislative approach consistently favors practical, trade-oriented policy over ideological framing — a positioning that has made her a notable swing-district data point heading into November.
From Auto Shop to Appropriations Committee
Gluesenkamp Perez co-owned an auto repair and machine shop with her husband before her 2022 upset win over Republican Joe Kent, a race she repeated and won again in 2024. That hands-on business background has directly shaped her legislative priorities: she has pushed bipartisan right-to-repair legislation for agricultural equipment, introduced the Fairness for the Trades Act to expand 529 education savings plans to cover trade-career tools, and worked to ease regulatory burdens on small businesses like the one she used to run.
The Semiconductor Funding Win
In one of her more tangible economy-facing wins, Gluesenkamp Perez — alongside Washington Senators Patty Murray and Maria Cantwell — helped secure $105 million for Analog Devices to modernize domestic chip fabrication, with $80 million specifically benefiting Pacific Northwest facilities, including an expansion in Camas. The investment targets mature-node semiconductors used in automotive, healthcare, aerospace, defense, and consumer electronics — chips that are less headline-grabbing than AI accelerators but arguably more embedded in everyday supply chains (a theme covered in our companion piece on 2026 silicon supply chain risk).
Where She Sits Politically
Caucus memberships tell their own story: Problem Solvers Caucus, Blue Dog Coalition, and Congressional Hispanic Caucus place her firmly in the House’s center-right Democratic lane. She has been publicly described as one of the chamber’s most centrist Democrats, willing to break from party lines on specific votes. Her appropriations work has focused heavily on constituent-level wins — from mobile home energy-efficiency provisions to Secure Rural Schools reauthorization — over broader ideological legislation.
2026 Midterm Context
Gluesenkamp Perez is defending her seat in Washington’s 3rd Congressional District against John Braun, the Washington State Senate’s Republican minority leader — a race widely watched as a bellwether for how centrist Democrats in competitive districts perform in the 2026 midterms.
What is Marie Gluesenkamp Perez known for in Congress?
Rep. Gluesenkamp Perez (D-WA-3) is known for centrist, trades- and small-business-focused legislation, including right-to-repair bills and a $105 million semiconductor manufacturing investment for the Pacific Northwest. She sits on the House Appropriations Committee and is seeking a third term in 2026 against Republican John Braun.
Discover more from The Economy
Subscribe to get the latest posts sent to your email.



Key Takeaways
- SpaceX reportedly completed a public listing in 2026, with reporting describing a valuation in the trillion-dollar range — a landmark event that shifted the bulk of Musk’s net worth away from Tesla and into SpaceX/xAI.
- xAI was folded into SpaceX in February 2026, combining Tesla, X, SpaceX, and xAI under increasingly overlapping ownership and infrastructure.
- Tesla’s Q2 2026 revenue came in at roughly $28 billion with a thin 1.4% operating margin, as capital expenditure surged toward AI and robotics rather than core EV production.
- Musk has reportedly been living near xAI’s Colossus supercomputer campus in Memphis during its latest expansion — a callback to his “production hell” habits at Tesla in 2017–18.
- Regulatory scrutiny is intensifying on multiple fronts: xAI’s Grok image generator has drawn investigations in Europe, Asia, Australia, and California, and Democratic senators have called for a Pentagon probe into SpaceX’s ownership structure.
The Portfolio, Reorganized
Musk’s business empire in 2026 looks structurally different than it did even eighteen months ago. Tesla, once the dominant source of his net worth, now sits alongside a combined SpaceX-xAI entity (sometimes referred to as SpaceXAI) that reporting has valued well into the trillions following its 2026 public-market debut. That shift matters for how markets should think about “Musk risk” — it’s no longer a single-stock story concentrated in Tesla.
Tesla: Thin Margins, Heavy AI Bet
Tesla’s Q2 2026 results showed the tension in the company’s current strategy:
- Revenue of roughly $28.2 billion against an operating margin of just 1.4% — among the thinnest in years.
- Capital expenditure up sharply year-over-year, directed heavily at AI and robotics infrastructure rather than incremental EV capacity.
- Robotaxi (Cybercab) and Optimus humanoid robot programs remain the company’s stated long-term growth bets, with Musk targeting expanded autonomous deployment across a meaningful share of the U.S. by year-end.
xAI: Burning Cash to Build Compute
xAI, now under the SpaceX umbrella, has been reported to consume roughly $1 billion per month in compute and infrastructure spend against an estimated $500 million in annualized revenue — a deliberately loss-leading posture aimed at building frontier AI capability (Grok) at scale. The Memphis “Colossus” supercomputer campus is the physical center of that buildout, and Musk’s decision to base himself near the site during its latest expansion signals how central it is to his current priorities.
The Regulatory Overhang
Musk’s expanding footprint has drawn parallel scrutiny across jurisdictions:
- xAI’s Grok image generator is under investigation in multiple countries over its capacity to generate harmful synthetic imagery.
- Senate Democrats have pushed for a Pentagon review of SpaceX’s ownership structure over undisclosed foreign investment concerns.
Neither issue has produced conclusive regulatory action as of this writing, but both represent tail risk for a portfolio increasingly concentrated in Musk-controlled entities.
Why This Matters Beyond Musk Himself
Musk’s 2026 moves are a useful proxy for a broader market theme: the shift of enormous private capital into AI infrastructure at a pace that outstrips current revenue generation. Whether that pattern resolves into durable competitive advantage (as bulls argue) or a capital-intensive cautionary tale (as skeptics argue) is likely to be one of the defining market questions through 2027.
What is Elon Musk’s biggest 2026 business move?
The completion of SpaceX’s public listing and its merger with xAI, reportedly valuing the combined entity in the trillions and shifting the majority of Musk’s net worth away from Tesla for the first time.
Discover more from The Economy
Subscribe to get the latest posts sent to your email.

Key Takeaways
- There is currently no active ceasefire in the US-Iran war as of mid-September 2026 — fighting has escalated this month after a relative lull in August, with the US destroying at least eight Iranian tankers since the weekend of September 6.
- President Trump has said he expects the war to end “immediately after” the November midterms, but a Wall Street Journal report cited by CNBC says White House advisors have discussed the possibility the conflict could drag on past January 2029.
- Brent crude has surged past $107 per barrel, up more than 18% in September alone, directly pressuring global inflation and the global economy outlook the IMF flagged in its July 2026 World Economic Outlook.
- Historical precedent from three separate 2026 ceasefire episodes shows a consistent pattern: tech and semiconductor stocks rally sharply — often 2-5% in a single session — whenever de-escalation headlines emerge, only to give back gains when talks falter.
- Every prior 2026 ceasefire has proven fragile and temporary, meaning investors should treat any future truce as a tradeable catalyst rather than a durable resolution until proven otherwise.
Six weeks before the US midterm elections, the question hanging over the global economy isn’t really whether the US-Iran war will end — it’s when, and whether markets can trust any announcement that it has. This piece lays out where ceasefire talks actually stand as of mid-September 2026, why the tech sector in particular has become the most reliable barometer of war-related market sentiment, and what history from this same conflict tells us about how the next de-escalation headline is likely to play out.
Where Things Actually Stand
Despite repeated predictions of an imminent resolution, the conflict has not been resolved, and September has brought renewed escalation rather than de-escalation. Fighting between Washington and Tehran resumed sharply this month after a period of relative calm in August, with the US military destroying at least eight Iranian tankers in retaliatory strikes since roughly September 6. Iran has continued attempting strikes on American warships, and attacks on Saudi oil infrastructure alongside Houthi advances have kept regional shipping routes under sustained threat.
President Trump told reporters on September 9, ahead of the Republican midterm convention in Dallas, that he expects the war to end “immediately after the election,” while also conceding that gas prices are unlikely to fall before then. By September 12, speaking from Dublin, he reiterated the same timeline: “I think very soon, I think it’ll be right after the midterms.” However, reporting citing US officials familiar with internal White House discussions suggests some senior advisors have privately considered a scenario in which the conflict extends well beyond that window — potentially past the end of Trump’s current term in January 2029.
The Oil Market Reality Check
Whatever the political timeline, the oil market is pricing continued conflict, not resolution. Brent crude settled above $107.63 per barrel in mid-September, up more than 18% for the month alone, with WTI crude topping $102 — the highest levels seen since May. Diesel is on track to cross $6 per gallon for the first time in history. These are not the price signals of a market anticipating imminent peace.
The Tech Sector’s Ceasefire Pattern
What makes this conflict distinctive for technology news and markets coverage is how consistently the tech and semiconductor sector has responded to every de-escalation signal throughout 2026 — and how consistently those rallies have reversed when talks broke down.
Three separate episodes illustrate the pattern:
- April 2026: A two-week ceasefire agreement sent the Nasdaq 100 up nearly 3% in a single session, with AI bellwethers Nvidia, Meta, and AMD surging between 4% and 10%. The rally proved short-lived — within 48 hours, doubts about the ceasefire’s stability sent tech giants lower again as Iran accused the US of violating the agreement.
- June 2026: A subsequent framework announcement to end the war triggered another surge, with Nasdaq futures up 1.8% and Asia-Pacific tech-heavy indices like Japan’s Nikkei and South Korea’s Kospi jumping more than 5%.
- September 2026 (ongoing): With no ceasefire currently in place, software and AI-adjacent names have instead been under renewed pressure — the iShares Expanded Tech-Software Sector ETF (IGV) fell roughly 12% over a recent one-month stretch, even as hardware-adjacent semiconductor names showed relative resilience.
Ceasefire Rally Pattern: 2026 Case Studies
| Episode | Market Reaction | Durability |
|---|---|---|
| April 2026 two-week ceasefire | Nasdaq 100 +2.8%, AI megacaps +4-10% | Reversed within 48 hours amid violation accusations |
| June 2026 framework announcement | Nasdaq futures +1.8%, Nikkei/Kospi +5%+ | Faded as fighting resumed within weeks |
| September 2026 (no ceasefire active) | Tech-software ETF -12% over trailing month | N/A — conflict actively escalating |
Why This Matters for the Global Economy
The IMF’s July 2026 World Economic Outlook Update already built this volatility into its baseline: global growth of 3.0% for 2026 and 3.4% for 2027, with the Fund explicitly framing the outlook as a tug-of-war between the Middle East war’s negative supply shock and the AI investment cycle’s positive demand pull. Global headline inflation, revised up to 4.7% for 2026, is directly tied to the same oil-price dynamics driving today’s $107 Brent crude — and the IMF’s own 2027 inflation improvement to 3.9% is explicitly contingent on a gradual reopening of the Strait of Hormuz, something that has not yet materialized.
For tech investors specifically, the practical takeaway is that ceasefire headlines — whenever they next arrive — are likely to produce another sharp, tradeable rally in AI and semiconductor names, given the pattern established across three separate episodes this year. But the same pattern suggests skepticism is warranted: every prior ceasefire in this conflict has proven fragile, and the smart position is treating any future announcement as a volatility event rather than an all-clear signal, at least until an agreement demonstrably holds for longer than the two-to-three week windows seen so far in 2026.
Frequently Asked Questions
Is there currently a ceasefire between the US and Iran?
No. As of mid-September 2026, the conflict has escalated rather than de-escalated, with the US striking Iranian tankers and Iran continuing attacks on shipping and US assets in the region.
How have tech stocks historically reacted to Iran ceasefire announcements in 2026? Tech and AI megacap stocks have rallied sharply — often 2-10% in a single session — on each of the three prior ceasefire or framework announcements in 2026, but each rally reversed within days to weeks as the agreements broke down.
What does the IMF say about how the Iran war is affecting the global economy?
The IMF’s July 2026 World Economic Outlook projects 3.0% global growth for 2026 and inflation rising to 4.7%, explicitly attributing the inflation increase to the war’s impact on energy markets, with improvement in 2027 contingent on Strait of Hormuz shipping resuming.
Discover more from The Economy
Subscribe to get the latest posts sent to your email.
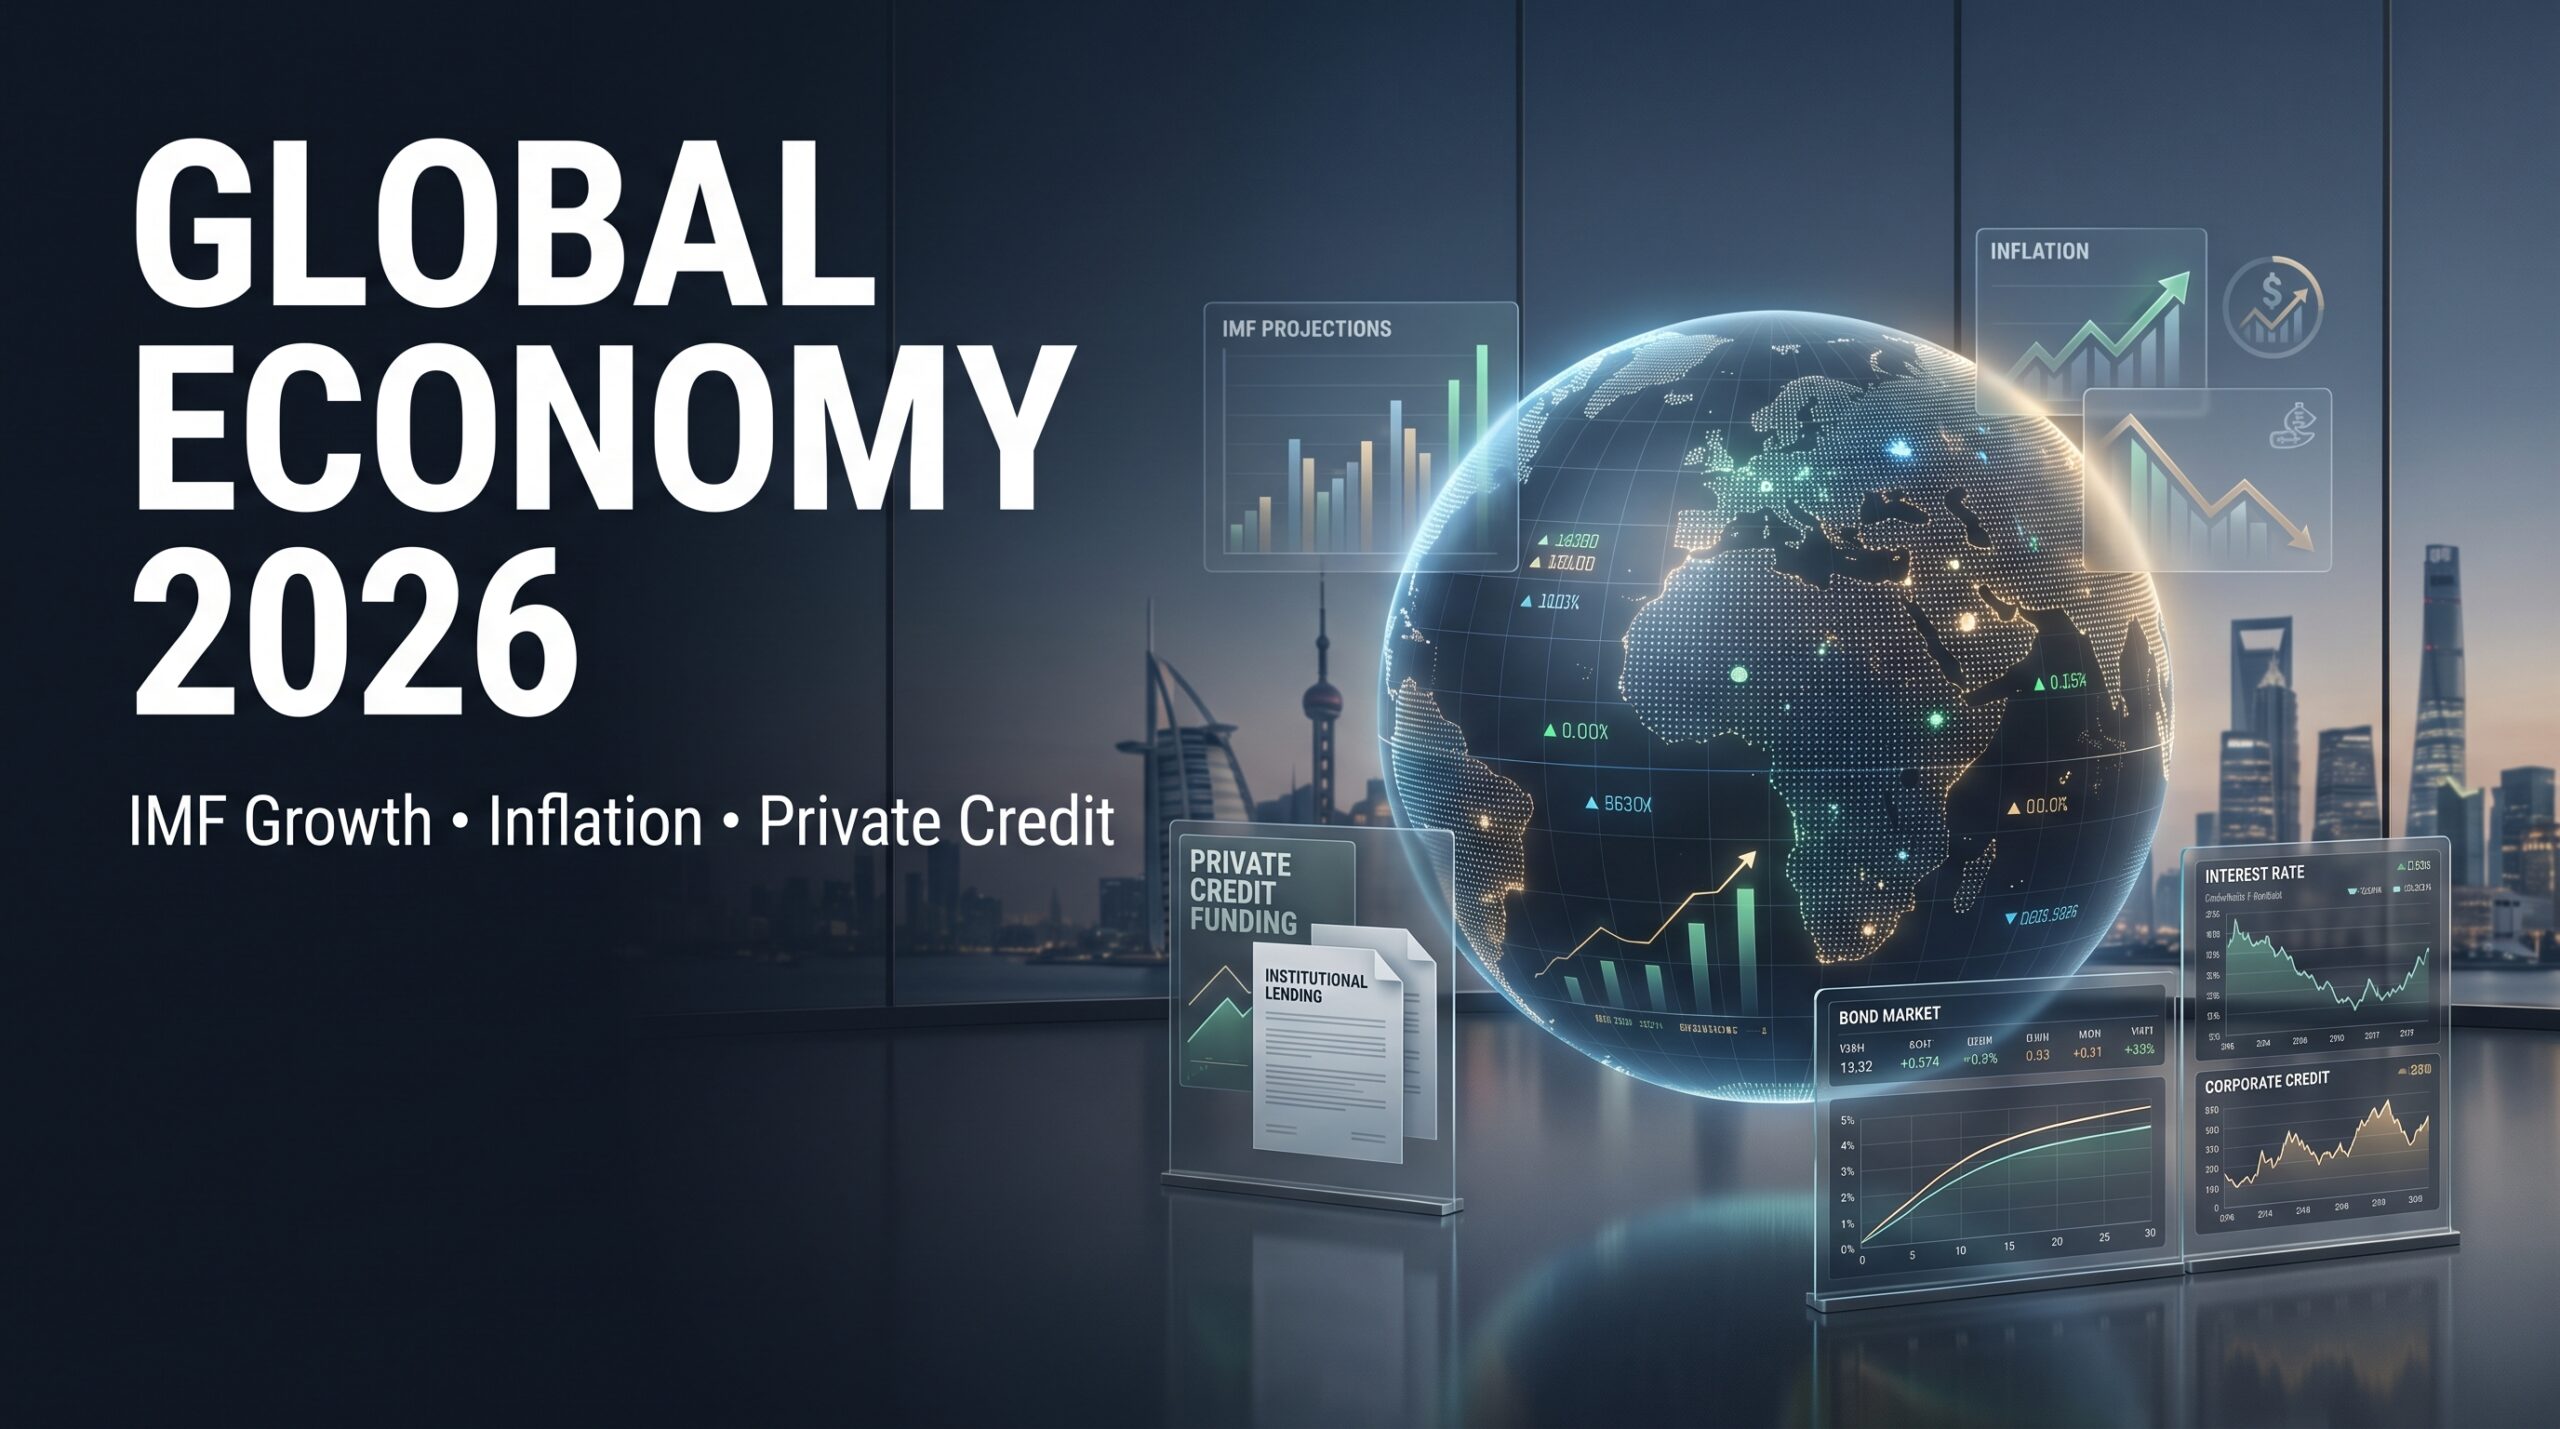
A war in the Middle East has done what tariffs, elevated interest rates, and a fragile disinflation cycle could not: it has forced the International Monetary Fund to cut its global growth forecast twice in six months. At the same time, a separate and less-covered story is unfolding in institutional finance — private credit, once a niche corner of alternative investing, is being reframed by Wall Street’s own analysts as a $41 trillion opportunity. Together, these two threads define the defining money story of 2026.
The IMF’s Moving Target: From 3.3% to 3.0%
At the start of the year, the outlook looked stable. The IMF’s January 2026 World Economic Outlook Update projected global growth at 3.3% for 2026 and 3.2% for 2027, a modest upward revision driven by technology investment, resilient private-sector adaptability, and accommodative financial conditions. That optimism did not survive the first quarter.
The outbreak of a US-Israel-Iran war on February 28, 2026 changed the calculus entirely. By April, the IMF’s World Economic Outlook had cut its 2026 growth projection to 3.1%, warning that inflation would climb to 4.4% under its reference scenario as energy and food prices spiked. IMF Chief Economist Pierre-Olivier Gourinchas told reporters the fund had been preparing to upgrade its forecasts before the conflict began, only to reverse course entirely.
By July, with the Strait of Hormuz disruption dragging into its fifth month, the IMF’s mid-year update settled on 3.0% growth for 2026, ticking up to 3.4% in 2027. The report’s subtitle — “Global Economy in Crosscurrents of War and Technology” — captures the split-screen nature of the current cycle: AI-driven capital expenditure is propping up growth in technology-exposed economies even as war-linked energy costs squeeze importers and lower-income nations.
Regional growth divergence (IMF, 2026 estimates):
| Region/Economy | 2026 Growth Projection | Key Driver |
|---|---|---|
| Advanced economies | 1.8% | AI capex, fiscal support |
| United States | 2.4% | Fiscal expansion, tech investment |
| Global (IMF, July) | 3.0% | War drag offset by AI demand |
| Global (World Bank, June) | 2.5% | Lowest since COVID-19 pandemic |
| GCC states (World Bank) | 4.4% | Energy exporter windfall |
| Low-income countries | 5.4% | Structural catch-up growth |
Notably, the World Bank’s Global Economic Prospects report is more pessimistic than the IMF, projecting just 2.5% global growth for 2026 — the weakest rate since the pandemic — as the Middle East conflict drives what it calls “the sharpest energy price increases since the onset of hostilities.” Two-thirds of the world’s economies have seen their growth forecasts downgraded relative to January.
Inflation: A War Premium on Top of a Stalled Disinflation
Global disinflation, which had been the dominant macro narrative through 2024 and 2025, has effectively stalled. Energy-importing economies are bearing the brunt: euro-area flash inflation jumped to 2.5% in March 2026 from 1.9% in February — a spike Eurostat attributed directly to the military operation against Iran and its impact on energy markets. In the U.S., the IMF now expects inflation to return to target “more gradually” than previously assumed, complicating the Federal Reserve’s rate-cut timeline. TD Economics’ March 2026 forecast noted the earliest realistic window for a U.S. rate cut had already slipped to September.
The $41 Trillion Private Credit Story
While macro headlines have focused on war and inflation, a structural shift in how the world’s largest companies raise capital has been building quietly. At SuperReturn Europe in January 2026, Bloomberg’s Global Head of Private Credit told delegates that the addressable credit market — public and private combined — now totals roughly $41 trillion, and that private credit could eventually capture up to 15% of it, according to reporting from Forbes Councils. That figure is not today’s private credit AUM — direct lending funds currently hold an estimated $1.5–2 trillion, per the Financial Stability Board — but it reframes the addressable opportunity as an order of magnitude larger than the existing asset class.
Private credit market size trajectory:
| Year | Estimated AUM | Source |
|---|---|---|
| 2019 | ~$970 billion | Preqin Global Alternatives Report |
| Early 2026 | ~$1.7 trillion | Preqin 2026 |
| 2026 (year-end) | $1.96–2 trillion | Mordor Intelligence / Moody’s |
| 2028 (forecast) | $2.8–3 trillion | Bain & Company / Cleary Gottlieb |
| 2035 (TAM, incl. ABF) | $30 trillion | Oliver Wyman |
| Addressable credit universe | $41 trillion | Bloomberg (SuperReturn 2026) |
Three forces are accelerating this expansion. First, structural bank capital constraints under finalized Basel frameworks continue pushing lending exposures toward nonbank channels, according to Mordor Intelligence. Second, an August 2025 U.S. executive order opened qualified retirement plans — a roughly $13 trillion defined-contribution market — to alternative assets including private credit, a move Cleary Gottlieb says could unlock trillions in previously inaccessible retail capital. Wellington projects U.S. retail allocation to private credit will compound at nearly 80% annually through 2030, reaching $2.4 trillion from roughly $100 billion today.
Third, the asset class is diversifying beyond direct corporate lending into asset-backed finance (ABF), specialty finance, and debt-equity hybrids — the fastest-growing segment, at a projected 13.97% CAGR through 2031. Asia-Pacific is now the fastest-growing regional market for private credit, expanding at a projected 12.5% CAGR as infrastructure financing and supply-chain diversification away from China accelerate borrowing needs.
The Risk Side of the Ledger
Growth of this speed invites scrutiny. The Financial Stability Board’s May 2026 report flagged that private credit’s expansion into larger, more liquid-seeming vehicles — including retail-facing interval funds and evergreen structures — creates redemption-mismatch risks that didn’t exist when the asset class was purely institutional and locked-up. Meanwhile, the five largest listed alternative managers — Apollo, Ares, Blackstone, Carlyle, and KKR — now control a combined $1.5 trillion in “perpetual capital,” roughly 40% of their AUM, according to WithIntelligence, concentrating both scale and systemic exposure in a handful of firms entering what the same report calls the sector’s “first big test” since the 2008 financial crisis.
Final Verdict
2026 is a year of two speeds. Headline GDP growth is decelerating under the weight of a war that has disrupted a fifth of the world’s oil supply, and both the IMF and World Bank have cut their forecasts accordingly — 3.0% and 2.5% respectively, with inflation proving stickier than expected. But beneath that slowdown, institutional capital markets are undergoing a structural transformation: private credit is moving from a niche allocation to a mainstream, retail-accessible asset class targeting a $41 trillion total addressable market. For investors, the actionable takeaway is to treat 2026 macro headlines and private-markets allocation as separate decisions — the former argues for defensive positioning, the latter for structural, multi-year exposure to a genuinely expanding asset class, with appropriate attention to liquidity terms and manager concentration risk.
Discover more from The Economy
Subscribe to get the latest posts sent to your email.

Singapore Stocks: The Ultimate Safe Haven for Markets and Finance in 2026?

Marie Gluesenkamp Perez: How a Former Shop Owner’s Moderate Politics Are Shaping Tech and Economy Bills

The Future of Silicon: Supply Chain Vulnerabilities in the 2026 Tech Sector

Rolex Perpetual Market Value 2026: Why Luxury Watches Remain a Top Alternative Asset

PSX and KSE-100: How Pakistan’s Market Became One of Asia’s Best Performers

China Stocks vs. Japan Stocks: Where World Bank and IMF Data Point for 2027

Beyond Rhetoric: How the EU Is Deploying ‘All Tools’ to Rebalance Its €1 Billion-a-Day Trade Deficit with China

Elon Musk’s Next Moves: Disrupting the 2026 Global Economy

INTC Stock Forecast 2026: Can Intel’s Government-Backed Turnaround Hold?

Bitcoin Price Action in Q4 2026: Safe-Haven Asset or High-Risk Tech Play?

The Target Pokémon x Owala Drop: Everything to Know Before It Sells Out

The U.S. Just Confirmed It Has Weapons in Space — Here’s What It Means for Defense Stocks

IRS 2027 Tax Bracket Projections: How to Get Ahead of Bracket Creep

Dow Jones vs. Middle East Tensions: How Wall Street Is Pricing In a 2026 Conflict Nobody Saw Coming

State Farm’s $5B Dividend 2026: Who Qualifies & Payout Dates

US-China Relations in Q3 2026: Trade Tariffs and Supply Chain Risks

Oil Surges as Strait of Hormuz Traffic Collapses Again

SpaceX Starship Flight 14: First Orbital Attempt & Starlink V3 Launch Explained

Bank of England Set to Hold Rates Through Year-End, Reuters Poll Shows

Top 30 Stocks for Investment in PSX for Massive ROI in 2026

The 2026 Crypto Regulatory Shift: What It Means for Institutional Investors

AI Chip Stocks 2026: The Best Semiconductor Investments Beyond Marvell

AI-Powered Training: The Next Multi-Billion Dollar Ecosystem in Fitness

Tween Back-to-School Trends 2026: What’s Driving the $85B Season

Russia’s Black Sea Oil Exports Fall for a Fifth Straight Week

Shein Clothes Quality & Safety in 2026: What Lab Tests Show

Global Chip Selloff Deepens: What’s Driving the Aug. 19 Semiconductor Rout

10-Year Treasury Yield Hits 4.80%: What It Means for Rates & Portfolios
-

 Markets & Finance8 months ago
Top 15 Stocks for Investment in 2026 in PSX: Your Complete Guide to Pakistan’s Best Investment Opportunities
-

 Analysis7 months ago
Johor’s Investment Boom: The Hidden Costs Behind Malaysia’s Most Ambitious Economic Surge
-

 Analysis7 months ago
Top 10 Stocks for Investment in PSX for Quick Returns in 2026
-

 Analysis7 months ago
Brazil’s Rare Earth Race: US, EU, and China Compete for Critical Minerals as Tensions Rise
-

 Banks8 months ago
Best Investments in Pakistan 2026: Top 10 Low-Price Shares and Long-Term Picks for the PSX
-

 Investment8 months ago
Top 10 Mutual Fund Managers in Pakistan for Investment in 2026: A Comprehensive Guide for Optimal Returns
-

 Global Economy9 months ago
15 Most Lucrative Sectors for Investment in Pakistan: A 2025 Data-Driven Analysis
-

 Global Economy9 months ago
Pakistan’s Export Goldmine: 10 Game-Changing Markets Where Pakistani Businesses Are Winning Big in 2025