
Lending Agencies
IMF & World Bank Global Economic Outlook: Growth Forecasts Across Europe and Asia

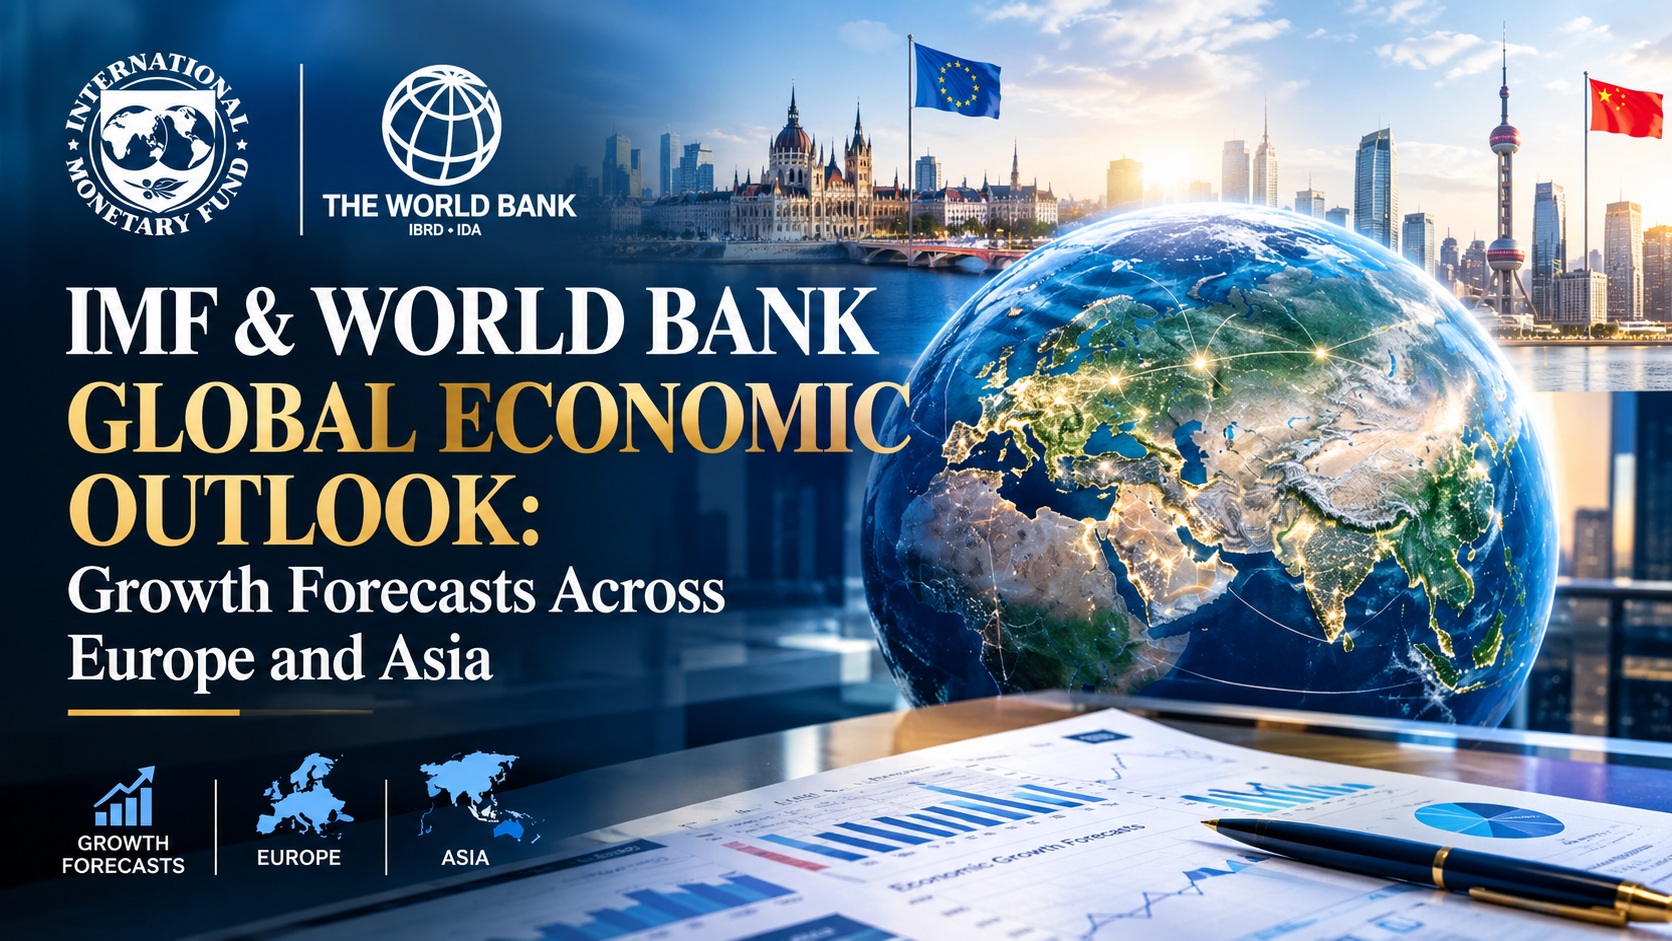
IMF sees 3.0% global growth in 2026, the World Bank just 2.5%. Compare Europe and Asia forecasts, the gap between them, and what it means for capital.
Executive Summary / Key Takeaways
- The IMF’s July 2026 World Economic Outlook Update projects global growth of 3.0% in 2026 and 3.4% in 2027, down from the 3.5% average of 2024–25.
- The World Bank’s June 2026 Global Economic Prospects is far darker: 2.5% in 2026, the weakest since the pandemic, with two-thirds of economies downgraded since January.
- The two institutions are not contradicting each other — they use different weighting methodologies — but the direction of both revisions is the same, and the driver is the Middle East war.
- Europe and Central Asia was cut to 2.1% for 2026; East Asia and Pacific to 4.2%. The Middle East, North Africa, Afghanistan and Pakistan region takes the worst hit at 1.6%.
- The divergence that matters for allocators is not regional but structural: economies plugged into the AI-led technology cycle are outperforming energy importers that are not.
1. Introduction & Immediate Context
Two flagship forecasts, two very different headline numbers, one identical story underneath. Anyone building a 2027 capital plan needs to understand why.
The IMF’s July update projects global growth of 3.0% in 2026 and 3.4% in 2027, down from the 3.5% average observed across 2024–25 and broadly unchanged on a cumulative basis from the April 2026 World Economic Outlook. The Fund attributes the modest slowdown to the effects of the war in the Middle East, partly offset by accelerated demand-driven momentum in the global technology cycle thanks to advances in artificial intelligence and its adoption.
The World Bank is blunter. It forecasts global growth slowing to 2.5% in 2026 from 2.9% in 2025 — the lowest rate since the onset of the COVID-19 pandemic — amid higher energy prices, steeper inflation and increased borrowing costs. Forecasts for two-thirds of economies were downgraded relative to January. Growth is expected to improve to 2.8% in 2027 but will remain 0.4 percentage point below the 2010s average.
The gap between 3.0% and 2.5% is largely methodological: the IMF aggregates at purchasing-power-parity weights, the World Bank at market exchange rates, which gives slower-growing advanced economies more influence. Read the revisions, not the levels.
2. Core Market / Strategic Analysis
2.1 Regional forecasts side by side
| Region | World Bank 2026 | World Bank 2027 | Revision direction | Source |
|---|---|---|---|---|
| World | 2.5% | 2.8% | Cut from 2.6% (Jan) | World Bank |
| East Asia & Pacific | 4.2% | 4.4% | Cut from 4.4% (Jan) | World Bank |
| Europe & Central Asia | 2.1% | 2.3% | Cut from 2.4% (Jan) | World Bank |
| South Asia | 6.3% | 6.9% | Fastest-growing region | World Bank |
| MENA, Afghanistan & Pakistan | 1.6% | 5.0% | Cut from 3.6% (Jan) | World Bank |
| Sub-Saharan Africa | 4.0% | 4.4% | Marginal easing | World Bank |
| Low-income countries | 5.4% | — | Cut 0.3pp on the conflict | World Bank |
The MENAAP line is the single most violent revision in the dataset: from 3.6% to 1.6% for 2026 in five months, followed by a mechanical 5.0% rebound in 2027 as base effects and assumed energy normalisation kick in. For frontier-market investors with Pakistan or Gulf exposure, that V-shape is the entire investment thesis — and it rests on an assumption about how long the conflict lasts.
2.2 The European picture
Growth in Europe and Central Asia is projected to decelerate to 2.1% in 2026, weakening in roughly 70% of economies in the region, according to the World Bank’s regional highlights. Domestic demand remains the primary driver but is constrained in 2026 by elevated energy prices, which raise inflation and erode real incomes, and by tighter financial conditions.
Commodity exporters in the region — Azerbaijan, Kazakhstan and Turkmenistan among them — see export revenues supported by higher energy prices even as growth slows. In Russia, the World Bank estimates oil revenue gains at roughly 1.5% of 2025 GDP for each $10 per barrel increase in prices, with those gains mainly directed toward fiscal consolidation.
The euro area itself sits at the sluggish end. The IMF’s January 2026 update had projected euro-area growth steady at 1.3% in 2026 and 1.4% in 2027, noting that the region benefits less than others from the technology-driven investment boost and that lingering energy-price effects continue to drag on manufacturing. Planned defence spending increases are expected to show up in output only in later years given phased commitments running to 2035.
2.3 The Asian picture
East Asia and Pacific is projected to fall to 4.2% in 2026 before firming to 4.4% in 2027 — a downgrade, but still comfortably the second-fastest-growing region. South Asia leads globally at 6.3% in 2026 and 6.9% in 2027.
The IMF’s framing explains why Asia holds up better than Europe: economies plugged into the technology-led upturn experience stronger activity even when they are energy importers, while activity weakens for energy importers with limited participation in that cycle. Energy exporters outside the conflict zone benefit from favourable terms of trade.
3. Structural Drivers and Competitor Gaps
Most coverage treats these as two competing headline numbers. The more useful read is that both institutions have converged on the same three-channel transmission mechanism, articulated by IMF Chief Economist Pierre-Olivier Gourinchas when the April outlook was released: higher energy and food prices themselves; persistence in wage and price inflation; and a confidence shock. The Fund noted at the time that the global economy had been on a roughly 3.3% trajectory and was heading for an upgrade before the war stopped that momentum, with inflation instead rising toward 4.4%.
Three structural points follow that competitors miss:
The dispersion is the story. The April WEO recorded a cumulative growth revision of nearly three percentage points for 2026 in the Middle East and North Africa, against comparatively modest effects in advanced economies. A single global number conceals a distribution this wide.
The 2027 rebound is conditional, not forecast. The World Bank’s recoveries across all regions in 2027–28 are driven by an assumed decline in energy prices and rebound in global activity. If Brent stays above $100, the rebound does not arrive on schedule.
AI is now a macro line item, not a sector story. Both institutions explicitly cite broader AI adoption as an upside risk offsetting the energy shock. That reframes technology capital expenditure as a national growth input, which is why Singapore, Malaysia and Taiwan are outperforming regional peers with similar energy exposure.
4. Key Implications for Stakeholders
Macro allocators. The IMF–World Bank spread is not noise to be averaged away; it is a signal about where you sit in the distribution. Market-weight exposure to advanced economies should be benchmarked against the World Bank’s 2.5%, not the IMF’s 3.0%.
Corporate strategists. Fiscal pressure is the binding constraint in developing markets. The World Bank flags that fiscal pressures will affect the ability to reduce poverty and food insecurity and to create jobs — which translates into weaker public procurement and slower infrastructure pipelines across frontier markets through 2027.
Frontier and EM investors. Emerging market and developing economies face their weakest per capita income growth since the pandemic. Pair that with the MENAAP downgrade and the case for selectivity over beta exposure is straightforward.
Watch the October calendar. The IMF’s next full World Economic Outlook lands with the Annual Meetings. Given the energy trajectory since July, the risk to the 3.0% figure is to the downside.
5. Frequently Asked Questions
Q1: What is the IMF’s global growth forecast for 2026?
The IMF projects 3.0% global growth in 2026 and 3.4% in 2027, per its July 2026 World Economic Outlook Update — down from the 3.5% average recorded across 2024–25, with the Middle East war the principal drag.
Q2: Why does the World Bank forecast lower growth than the IMF?
The World Bank aggregates using market exchange rates while the IMF uses purchasing-power-parity weights, giving slower-growing advanced economies more influence in the World Bank’s 2.5% figure. Both revised downward for the same reasons.
Q3: Which region is growing fastest in 2026?
South Asia, at a projected 6.3% in 2026 rising to 6.9% in 2027, according to the World Bank. East Asia and Pacific follows at 4.2%.
Q4: How badly has the Middle East conflict hit growth forecasts?
The World Bank cut its MENA, Afghanistan and Pakistan forecast from 3.6% to 1.6% for 2026, and downgraded two-thirds of all economies since January. Global growth is now at its weakest since the pandemic.
Discover more from The Economy
Subscribe to get the latest posts sent to your email.


Stagfaltion
Stagflation vs. Soft Landing: How Central Bank Rates Are Reshaping European and Asian Economies
Fed hiked, ECB hiked, BoE held 6-3, BoJ next. Inside the most divergent central bank week since 2022 and what it signals for stagflation risk.
Executive Summary / Key Takeaways
- Four major central banks moved within eight days: the ECB raised its deposit rate to 2.5% on 10 September, the Fed hiked to 3.75%–4.00% on 16 September, the Bank of England held at 3.75% on a 6-3 vote on 17 September, and the Bank of Japan is expected to move on 18 September.
- UK inflation has hit a five-month high of 3.1%, with the BoE warning it is likely to rise further over coming quarters.
- The Bank of England also announced an unexpected plan to sell £146 billion of UK government bonds directly to the Treasury to complete quantitative tightening.
- This is a supply-shock tightening cycle, not a demand-driven one — which is precisely what makes the stagflation question live.
- The soft-landing case rests on strong productivity and AI-driven capital investment; the stagflation case rests on energy prices that have not normalised.
1. Introduction & Immediate Context
Central banks almost never tighten into an energy shock. Doing so risks amplifying the output loss while doing little to address the price source. Over eight days in September 2026, three of the world’s four largest monetary authorities did exactly that — and the fourth is expected to follow.
The sequencing matters. The ECB raised its main rates by a quarter point at its 10 September meeting, lifting the deposit rate from 2.25% to 2.5%, and said inflationary pressures arising from the conflict in the Middle East would contribute to inflation remaining above its 2% target for an extended period, according to the House of Commons Library. That followed a June increase of the same size. The Fed moved on 16 September. The Bank of England broke the pattern on 17 September by holding.
For CFOs and macro investors the question is no longer whether policy is restrictive. It is whether restriction is being applied to the right problem.
2. Core Market / Strategic Analysis
2.1 The September policy grid
| Central Bank | Decision | Policy Rate | Vote / Signal | Source |
|---|---|---|---|---|
| Federal Reserve (16 Sep) | +25 bps | 3.75%–4.00% | Unanimous 12-0; 16 of 18 see another hike | Federal Reserve |
| ECB (10 Sep) | +25 bps | 2.50% deposit rate | Second hike since June 2026 | Commons Library |
| Bank of England (17 Sep) | Hold | 3.75% | 6-3, three voting for 4.00% | Euronews |
| Bank of Japan (18 Sep) | Expected +25 bps | 1.00% → 1.25% expected | Hike priced near certainty | FXStreet |
2.2 Why the Bank of England blinked — and why three members did not
The MPC voted six to three to leave borrowing costs unchanged, with the dissenting trio pushing for a quarter-point increase to 4%, Euronews reported. The energy shock from the Iran war has pushed UK inflation to a five-month high of 3.1%. The Committee said inflation is likely to rise further over coming quarters, pointing to crude and refined energy prices that have climbed again since its last meeting and remain more volatile and higher than pre-conflict levels.
That is a central bank telling markets it expects to miss its target by a widening margin — and choosing not to act. Bank Rate has stood at 3.75% since December 2025 following six consecutive quarter-point cuts, and the July meeting produced the same hawkish 6-3 split.
The balance-sheet news was the genuine surprise. Alongside the rate decision the Bank announced an unexpected plan to sell £146 billion of UK government bonds directly to the Treasury, Invezz reported. The proposal is intended to help complete quantitative tightening and could ease some pressure on the gilt market, though it requires the chancellor’s approval. The MPC is already reducing its asset purchase programme from a peak of £895 billion to £489 billion as of 9 September 2026.
Read together, the two decisions are coherent: hold the price of money steady, but remove duration risk from the market through a different channel.
2.3 Asia’s mirror-image problem
Japan’s position inverts everyone else’s. Its ultra-low rates financed trillions of dollars in global investment for more than a decade, making the yen one of the world’s cheapest funding currencies — an advantage that may be entering a new phase as the BoJ tightens again, FXStreet noted.
The carry-trade unwind is not a Japanese story. It is a global liquidity story, and it has already shown up in the US long end: the 10-year Treasury yield briefly crossed 5% in mid-September, driven by a combination of surging oil prices, a hotter-than-expected August CPI, heavy bond issuance and a possible unwinding of the yen carry trade as Japanese rates rise.
3. Structural Drivers and Competitor Gaps
The stagflation-versus-soft-landing frame is usually argued with sentiment. The honest version requires separating two questions.
Question one: is the inflation demand-driven? Largely not. The ECB, BoE and Fed all attribute the current impulse to energy. The IMF’s July update expects global inflation to pause its steady decline. Tightening against a supply shock compresses demand without addressing supply, which is the textbook path to a growth-inflation squeeze.
Question two: is the supply side strong enough to absorb it? Here the evidence cuts the other way. The Fed’s own statement describes productivity growth as strong and capital investment as robust, with domestic spending resilient. The IMF notes that accelerated demand-driven momentum in the global technology cycle, driven by AI advances and adoption, is partly offsetting the war’s effects.
That is the crux. A genuine stagflation requires weak supply-side growth alongside high inflation. What the data currently show is high inflation alongside unusually strong productivity and investment — an unusual and unstable combination, but not classic stagflation.
Three markers will resolve it:
- Whether energy prices normalise. Oil trading solidly above $100 per barrel around the Fed decision, per Yahoo Finance, keeps the shock live. The World Bank’s 2027 recovery scenario assumes it fades.
- Whether second-round effects appear in wages. The BoE explicitly flagged the risk of higher energy prices transmitting into household costs, wages and broader inflation.
- Whether the AI capex cycle holds. Both the IMF and the World Bank treat broader AI adoption as the principal upside risk to growth. If technology investment slows, the offset disappears and the stagflation case strengthens sharply.
4. Key Implications for Stakeholders
Corporate CFOs in Europe. Euro-area policy is still the loosest of the major blocs at a 2.5% deposit rate, but the ECB has now hiked twice since June and expects above-target inflation for an extended period. Refinancing windows are narrowing; the argument for terming out debt in Q4 2026 rather than waiting for 2027 is stronger than it was in June.
UK-exposed borrowers. A held Bank Rate does not mean held borrowing costs. With the MPC expecting inflation to rise further and three members already voting to hike, the November meeting is genuinely live. The £146 billion gilt transfer, if approved, is the variable to watch for long-end pricing.
Asian exporters. Yen weakness following the Fed’s decision improved the earnings outlook for Japan’s export-focused industries — but a BoJ hike cuts the other way. Currency hedging assumptions built on a persistently cheap yen need revisiting.
Multi-asset allocators. Divergence itself is the tradeable feature. The Fed is tightening into strength, the ECB into weakness, the BoE is paralysed by a split committee, and the BoJ is normalising from a near-zero base. Relative-value positioning in rates is more attractive than directional duration.
5. Frequently Asked Questions
Q1: Is the global economy heading into stagflation in 2026?
Not on current data. Inflation is elevated and energy-driven, but productivity growth and capital investment remain strong, which classic stagflation requires to be weak. The risk rises materially if the AI-led investment cycle slows while energy prices stay high.
Q2: Why did the Bank of England hold while the Fed and ECB hiked?
The MPC voted 6-3 to hold at 3.75% despite inflation hitting a five-month high of 3.1%, judging that the energy-driven inflation impulse did not yet warrant tightening. Three members dissented in favour of a quarter-point rise to 4%.
Q3: What is the ECB’s current interest rate?
The ECB raised its deposit rate to 2.5% on 10 September 2026, its second quarter-point increase since June. Its next scheduled policy meeting concludes on 29 October.
Q4: How does the Bank of Japan’s decision affect global markets?
A BoJ hike raises the cost of yen funding, which has underpinned global carry trades for over a decade. The unwind has already contributed to higher long-dated yields in the US and Europe.
Discover more from The Economy
Subscribe to get the latest posts sent to your email.

The latest joint diagnostics from the IMF and World Bank reveal a bifurcated global economy. While developed economies attempt soft landings, emerging markets face severeliquidity squeezes. Sovereign debt restructuring mechanisms are failing to keep pace with US-dollar obligations, signaling suppressed infrastructure spending in developing nations.
The current macroeconomic environment is characterized by unprecedented volatility, driven by shifting monetary policies, supply chain recalibrations, and evolving trade barriers. As central banks navigate the delicate balance between curbing inflation and preventing deep recessions, emerging markets face asymmetric risks. Developing economies must rigorously manage their foreign exchange reserves while calibrating import duties and trade frameworks—often leveraging insights from national tariff commissions to protect domestic industries without stifling vital foreign direct investment. This delicate equilibrium directly impacts global liquidity, equity valuations, and sovereign debt yields. The restructuring of global supply chains, initially sparked by geopolitical friction, has now become a structural reality. Corporations are transitioning from ‘just-in-time’ manufacturing to ‘just-in-case’ inventory management, fundamentally altering capital expenditure cycles. Furthermore, the integration of advanced digital tracking and open-source intelligence is allowing multinational firms to better anticipate supply shocks, although the cost of implementing these technologies creates new barriers to entry for smaller enterprises. Ultimately, the intersection of foreign policy and economic strategy is tighter than ever, with trade tariffs and sanctions acting as primary instruments of geopolitical leverage.
This dynamic fundamentally shifts how stakeholders must approach long-term strategic planning, requiring a pivot away from legacy models toward hyper-adaptive fiscal forecasting.
2. Deep Dive: Market Mechanics and Structural Shifts
Delving deeper into the structural mechanics, we see a profound transformation in how institutional capital evaluates risk. Historically, geographic diversification offered a reliable hedge against localized downturns. Today, however, the rapid transmission of financial shocks across borders—facilitated by highly integrated banking networks and algorithmic trading—means that systemic risk is virtually ubiquitous. Asset managers are heavily scrutinizing cash flow durability, favoring sectors with inelastic demand characteristics. The regulatory environment is also tightening. Heightened scrutiny over data privacy, antitrust concerns in the technology sector, and rigorous ESG (Environmental, Social, and Governance) compliance mandates are forcing companies to overhaul their operational frameworks. These compliance costs are inevitably passed down to the consumer, fueling core inflationary pressures. Concurrently, the labor market is undergoing a structural shift. The automation of routine tasks, coupled with the rising premium on specialized technical and analytical skills, is widening the productivity gap between different segments of the workforce. For policymakers and corporate strategists alike, navigating this landscape requires a nuanced understanding of these intersecting vectors, moving beyond traditional econometric models to incorporate real-time, alternative data sources.
By examining the underlying data, it becomes evident that the market is severely underpricing tail-risks associated with these developments. Institutional capital flows are increasingly prioritizing liquidity and balance sheet resilience over speculative growth.
In parallel, the velocity of money within these specific sub-sectors has decelerated, indicating a hoarding of capital by major corporate players in anticipation of further regulatory or geopolitical turbulence. This behavior creates a feedback loop, exacerbating localized liquidity shortages and widening credit spreads.
3. Regulatory Environment and Trade Implications
Any comprehensive analysis must account for the evolving regulatory perimeter. National trade bodies and tariff commissions are aggressively deploying protectionist measures, utilizing import duties and quotas to shield domestic industries from global dumping practices. These tariff architectures, while politically popular, disrupt established global value chains and introduce massive compliance overhead for multinational operators.
The current macroeconomic environment is characterized by unprecedented volatility, driven by shifting monetary policies, supply chain recalibrations, and evolving trade barriers. As central banks navigate the delicate balance between curbing inflation and preventing deep recessions, emerging markets face asymmetric risks. Developing economies must rigorously manage their foreign exchange reserves while calibrating import duties and trade frameworks—often leveraging insights from national tariff commissions to protect domestic industries without stifling vital foreign direct investment. This delicate equilibrium directly impacts global liquidity, equity valuations, and sovereign debt yields. The restructuring of global supply chains, initially sparked by geopolitical friction, has now become a structural reality. Corporations are transitioning from ‘just-in-time’ manufacturing to ‘just-in-case’ inventory management, fundamentally altering capital expenditure cycles. Furthermore, the integration of advanced digital tracking and open-source intelligence is allowing multinational firms to better anticipate supply shocks, although the cost of implementing these technologies creates new barriers to entry for smaller enterprises. Ultimately, the intersection of foreign policy and economic strategy is tighter than ever, with trade tariffs and sanctions acting as primary instruments of geopolitical leverage.
Consequently, compliance is no longer a localized legal issue but a central pillar of global corporate strategy. Firms that fail to map their supply chain vulnerabilities against shifting tariff schedules risk catastrophic margin compression. The strategic deployment of foreign direct investment is now heavily contingent upon favorable tariff rulings and bilateral trade agreements, making regulatory forecasting as critical as traditional financial modeling.
4. Corporate Strategy & Supply Chain Realities
At the enterprise level, the response to these macroeconomic and regulatory pressures involves massive capital expenditure in supply chain redundancy. The shift toward near-shoring and friend-shoring is accelerating, unwinding decades of globalization focused purely on labor arbitrage. This transition is highly capital intensive, depressing near-term return on invested capital (ROIC) but essential for long-term operational survival.
Delving deeper into the structural mechanics, we see a profound transformation in how institutional capital evaluates risk. Historically, geographic diversification offered a reliable hedge against localized downturns. Today, however, the rapid transmission of financial shocks across borders—facilitated by highly integrated banking networks and algorithmic trading—means that systemic risk is virtually ubiquitous. Asset managers are heavily scrutinizing cash flow durability, favoring sectors with inelastic demand characteristics. The regulatory environment is also tightening. Heightened scrutiny over data privacy, antitrust concerns in the technology sector, and rigorous ESG (Environmental, Social, and Governance) compliance mandates are forcing companies to overhaul their operational frameworks. These compliance costs are inevitably passed down to the consumer, fueling core inflationary pressures. Concurrently, the labor market is undergoing a structural shift. The automation of routine tasks, coupled with the rising premium on specialized technical and analytical skills, is widening the productivity gap between different segments of the workforce. For policymakers and corporate strategists alike, navigating this landscape requires a nuanced understanding of these intersecting vectors, moving beyond traditional econometric models to incorporate real-time, alternative data sources.
Furthermore, the integration of advanced data analytics into procurement and logistics is creating a bifurcation in corporate performance. Companies leveraging real-time telemetry and predictive modeling can dynamically route around bottlenecks, whereas legacy operators remain heavily exposed to single points of failure. This technological divide is rapidly translating into a definitive competitive advantage, reflected in disparate valuation multiples within the same industry cohorts.
5. Digital Monetization & Premium Publisher Strategy
From a digital publishing and monetization perspective, covering these complex macro and technological trends requires a sophisticated architecture. High-CPM and high-CPC yield generation depends on capturing intent-driven traffic. Financial and geopolitical content naturally attracts premium programmatic advertisers. Digital publishers operating robust portfolios are increasingly diversifying their revenue streams beyond standard display ads. By integrating specialized publisher networks, such as Coin.network for crypto and macro-finance adjacencies, or high-intent affiliate ecosystems like Travelpayouts for global transit and aviation content, digital platforms can drastically improve their revenue per thousand impressions (RPM). Furthermore, optimizing site taxonomy and leveraging vector-based assets ensures faster load times, directly boosting Core Web Vitals and search engine rankings. The strategic placement of contextual widgets, combined with deep-dive analytical content, creates a sticky user experience that encourages longer session durations. This architectural approach not only outperforms algorithmic updates but establishes a highly defensible moat against low-effort, AI-generated content farms. For media operators, the transition from basic news aggregation to authoritative, niche intelligence distribution is the key to sustainable digital media economics.
For financial and economic news portals, the path to profitability lies in owning the niche. By consistently delivering high-fidelity analysis that intersects global trade, technology, and market data, publishers attract a highly affluent demographic. This audience profile commands top-tier CPC rates from financial institutions, B2B SaaS providers, and enterprise tech conglomerates.
Strategic integration of programmatic networks requires meticulous attention to ad placement, ensuring that monetization widgets complement rather than disrupt the analytical narrative. The use of sophisticated yield management platforms allows publishers to dynamically allocate inventory between direct sales, private marketplaces, and open exchanges, maximizing revenue yield in real-time. This sophisticated infrastructure is the bedrock of modern digital publishing economics.
6. Future Outlook and Risk Assessment
The current macroeconomic environment is characterized by unprecedented volatility, driven by shifting monetary policies, supply chain recalibrations, and evolving trade barriers. As central banks navigate the delicate balance between curbing inflation and preventing deep recessions, emerging markets face asymmetric risks. Developing economies must rigorously manage their foreign exchange reserves while calibrating import duties and trade frameworks—often leveraging insights from national tariff commissions to protect domestic industries without stifling vital foreign direct investment. This delicate equilibrium directly impacts global liquidity, equity valuations, and sovereign debt yields. The restructuring of global supply chains, initially sparked by geopolitical friction, has now become a structural reality. Corporations are transitioning from ‘just-in-time’ manufacturing to ‘just-in-case’ inventory management, fundamentally altering capital expenditure cycles. Furthermore, the integration of advanced digital tracking and open-source intelligence is allowing multinational firms to better anticipate supply shocks, although the cost of implementing these technologies creates new barriers to entry for smaller enterprises. Ultimately, the intersection of foreign policy and economic strategy is tighter than ever, with trade tariffs and sanctions acting as primary instruments of geopolitical leverage.
Looking forward to the next fiscal cycles, the interplay between technological disruption and macroeconomic stability will intensify. Stakeholders must remain exceptionally agile, deploying advanced forecasting tools and maintaining robust liquidity buffers to weather unexpected systemic shocks. The margin for error in capital allocation has effectively dropped to zero.
In conclusion, the convergence of these factors dictates a complete reimagining of traditional operational and investment playbooks. The victors in this new paradigm will be those who can seamlessly synthesize geopolitical intelligence, deep market data, and advanced digital distribution strategies into a cohesive, actionable framework.
Discover more from The Economy
Subscribe to get the latest posts sent to your email.
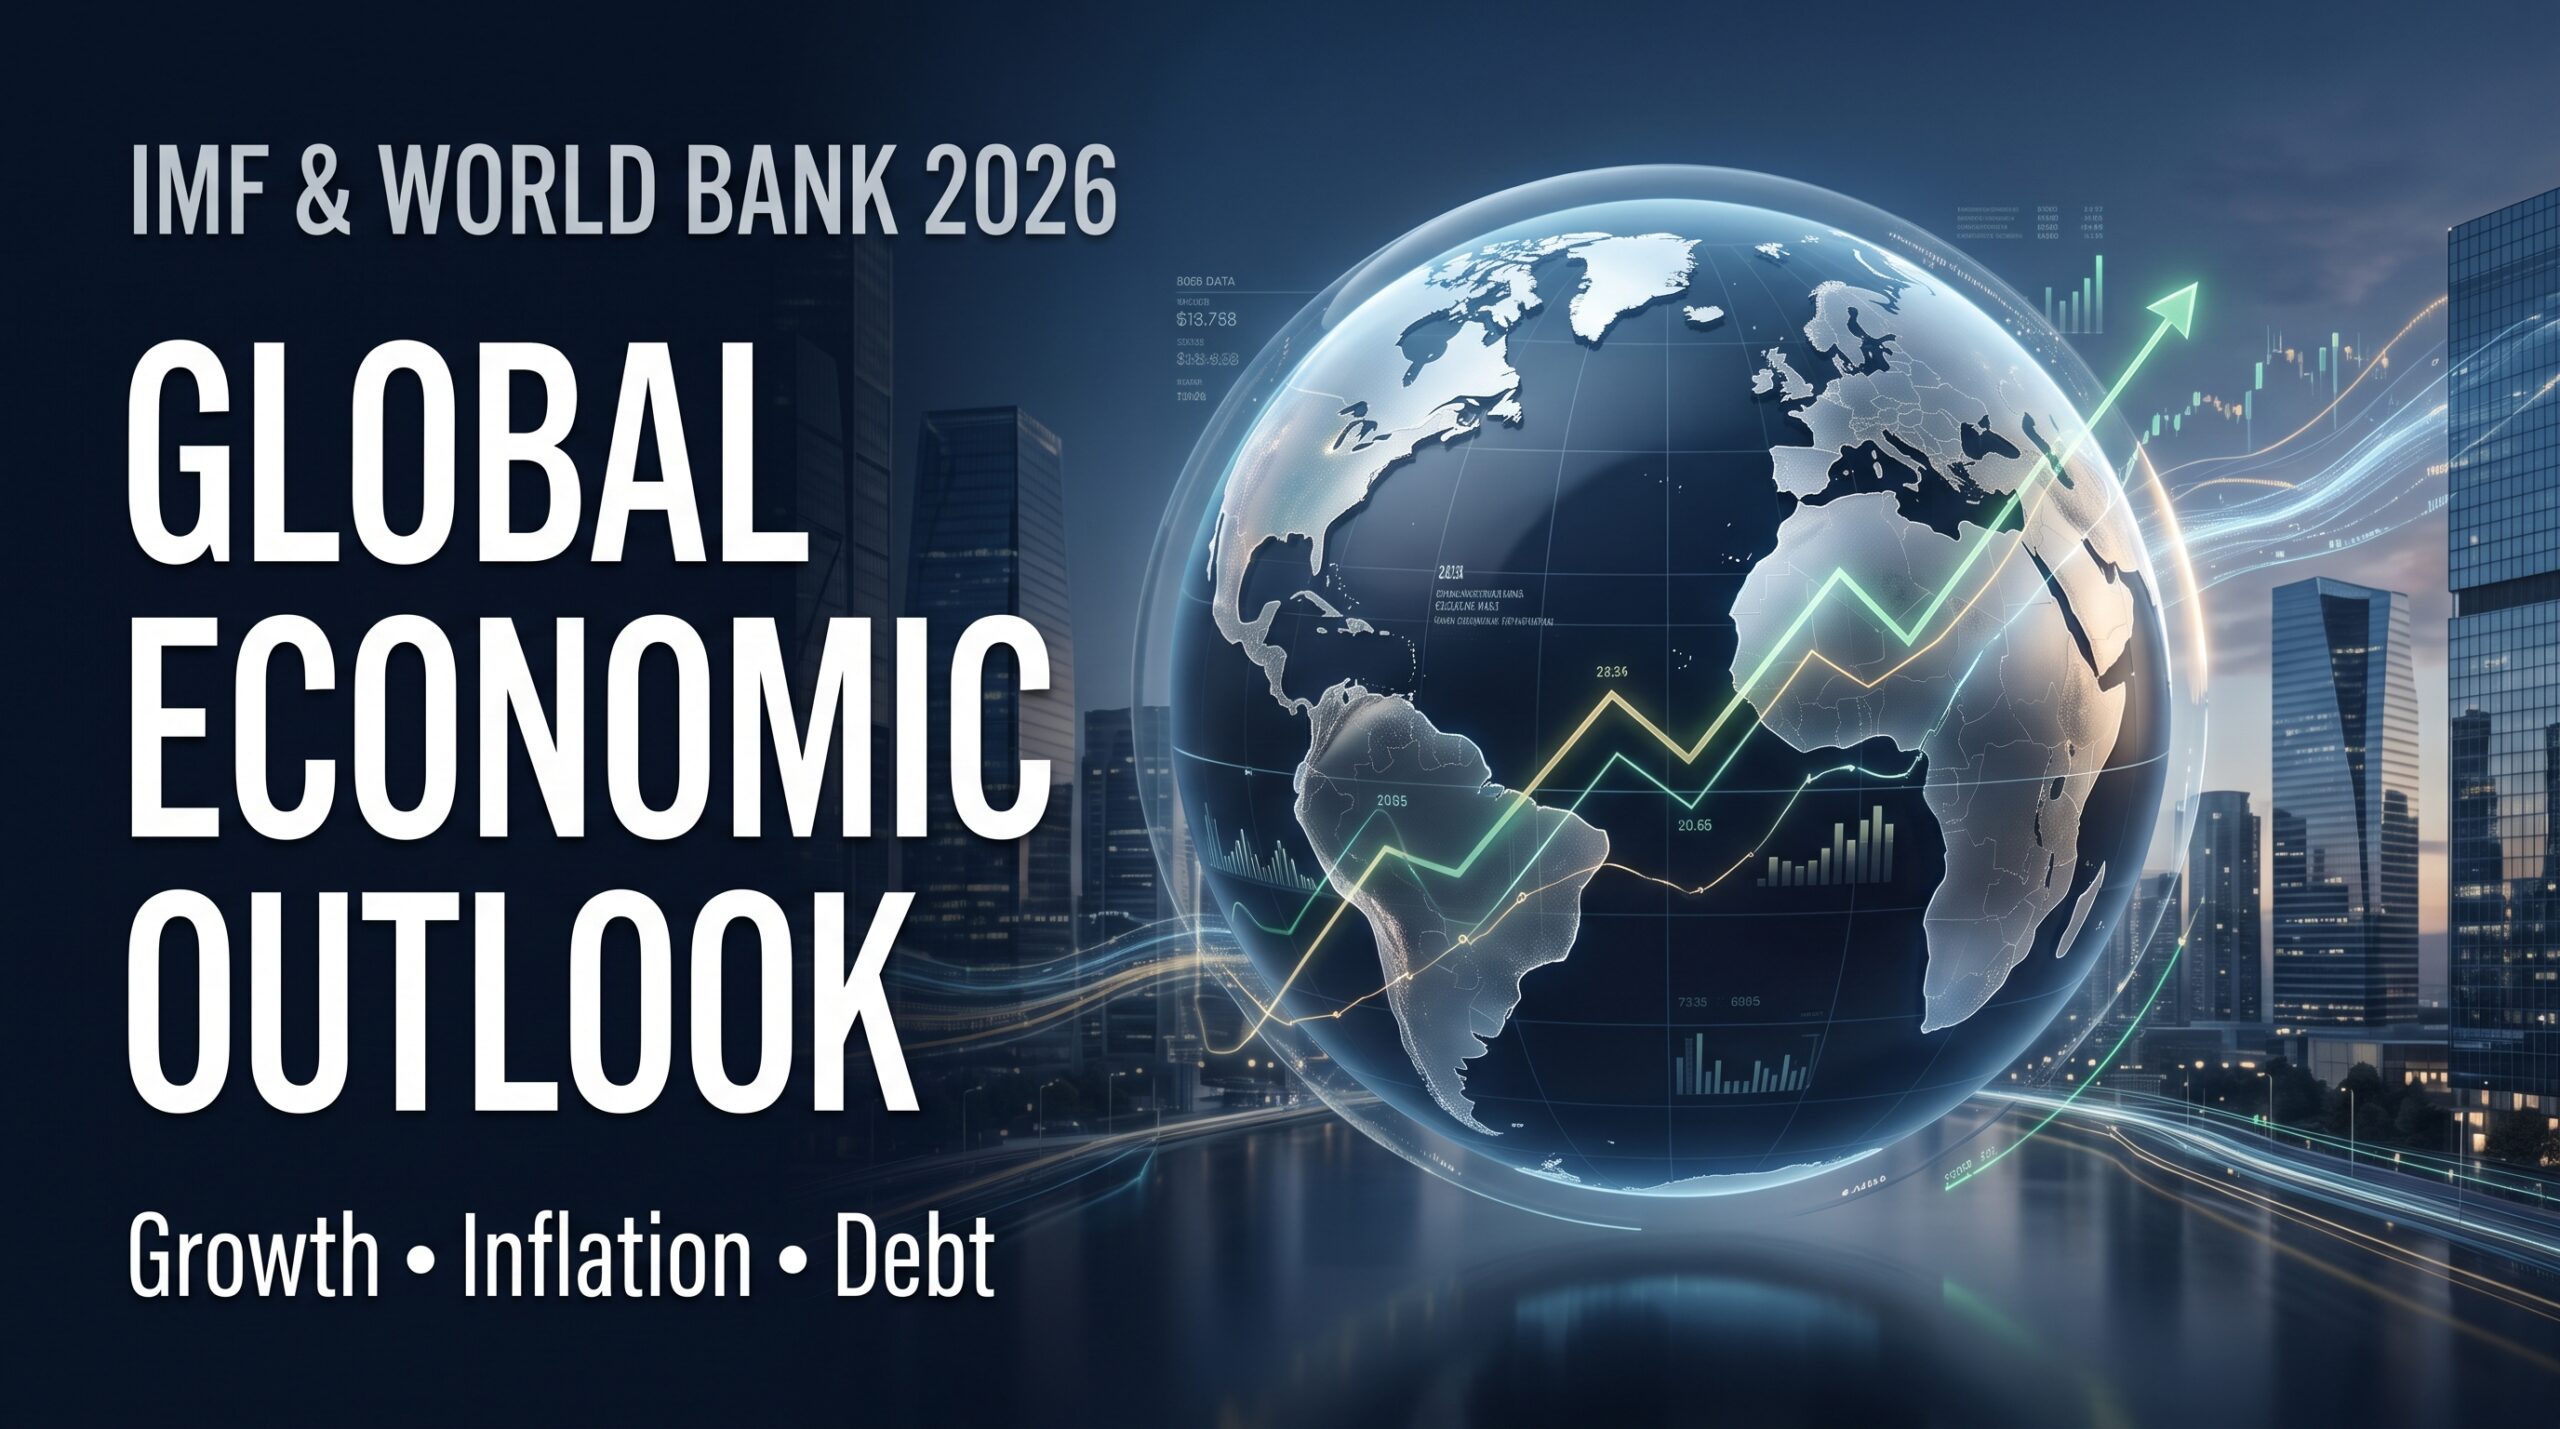
Global growth forecasts have been on a genuine roller coaster through 2026, and the two institutions tasked with tracking that trajectory — the International Monetary Fund and the World Bank — have delivered a consistent underlying message even as their specific numbers moved: the global economy has proven more resilient than feared at each individual shock, but the 2020s as a whole are on track to be the weakest decade for growth since the 1960s, and inflation’s decline has stalled rather than completed.
The IMF’s 2026 Forecast Trajectory
| WEO Report | Global Growth 2026 | Global Growth 2027 | Inflation 2026 | Key Driver |
|---|---|---|---|---|
| January 2026 | 3.3% | 3.2% | Declining | Technology investment, fiscal/monetary support |
| April 2026 | 3.1% | 3.2% | Rising to 4.4% | Middle East war outbreak |
| July 2026 | 3.0% | 3.4% | Revised up to 4.7% | Disinflation trend stalled; energy/food prices |
The swing between January and April 2026 — a full 0.2-point downgrade to growth alongside a jump in the inflation forecast — was driven almost entirely by the outbreak of war in the Middle East, which IMF Chief Economist Pierre-Olivier Gourinchas described directly: “The war has stopped that momentum and we now project growth of 3.1 percent this year… with inflation rising to 4.4 percent, a sharp departure from the previous trend.”
By July, the Fund’s own briefing described the resulting trajectory as a “V-shaped recovery” — weaker 2026 growth than the pre-war forecast, followed by a stronger 2027 rebound (revised up to 3.4%) — while cautioning that the disinflation trend in place since early 2024 has stalled, with headline inflation revised upward for both 2026 and 2027 versus the April forecast.
Three Scenarios, Not One Baseline
Reflecting the genuine uncertainty introduced by the Middle East conflict, the IMF’s April 2026 report broke from its traditional single-baseline format and instead presented three explicit scenarios:
- Reference forecast: assumes a short-lived conflict with a moderate 19% rise in energy prices in 2026 — global growth at 3.1%, inflation at 4.4%.
- Adverse scenario: assumes further disruption, higher energy prices, elevated inflation expectations, and tighter financial conditions throughout the year — growth falling to 2.5%, inflation rising to 5.4%.
- Severe scenario: assumes energy supply disruptions extend into 2027, with greater macroeconomic instability across advanced and emerging markets alike.
This scenario-based approach itself signals how much weight the Fund places on geopolitical risk as the dominant swing factor in the current outlook, ahead of more traditional cyclical drivers like monetary policy stance or fiscal consolidation pace.
Regional Divergence: Winners and Losers
The IMF’s reporting has consistently emphasized that the aggregate global figures mask sharply uneven regional impacts:
- The euro area continues to underperform, with subdued growth reflecting unresolved structural headwinds, lingering effects of elevated post-Ukraine-invasion energy prices, and real appreciation of the euro relative to competitor export currencies. Planned defense-spending increases are expected to provide only gradual support, given commitments to reach target spending levels by 2035.
- The United States has been a relative bright spot, with growth projected at 2.4% for 2026 in the January update, supported by fiscal measures and continued technology-driven investment.
- Energy-importing and vulnerable emerging market economies are bearing the brunt of the Middle East war’s growth and inflation impact, hit through three distinct channels the IMF identifies explicitly: higher energy and food prices directly; persistence in wage and price inflation; and a broader confidence shock affecting investment decisions.
- Countries integrated into the AI-driven technology value chain are seeing that demand partly offset war-related headwinds, creating a genuine bifurcation between economies positioned to capture AI infrastructure investment and those that are not.
The World Bank’s Parallel — and More Pessimistic — Assessment
The World Bank’s Global Economic Prospects reports have tracked a broadly similar trajectory but with a structurally lower growth baseline and a starker framing of the developing-world implications:
- January 2026: Global GDP growth projected at 2.6% in 2026, recovering to 2.7% in 2027 — an upward revision from the Bank’s own June 2025 forecast, driven primarily by stronger-than-expected U.S. performance.
- Structural framing: World Bank Group Chief Economist Indermit Gill’s foreword to the Bank’s report states plainly that, barring a change in trajectory, “the 2020s are on track to become a lost decade for far too many developing economies,” noting that virtually half of all developing economies have failed since 2019 to narrow the income gap with the world’s most prosperous economies.
- A longer-term counterpoint: The same report expresses genuine optimism about the 2030s specifically, arguing that AI, energy transformation, and deeper regional integration represent economic forces powerful enough to unlock transformative progress in the next decade — but only if the necessary preparation begins now.
Sovereign Debt: The Structural Vulnerability Beneath the Cyclical Numbers
Both institutions have devoted increasing analytical attention in 2026 to rising sovereign debt burdens across emerging market and developing economies (EMDEs):
- Rising debt is driving up EMDE borrowing costs, particularly for the most indebted nations, creating a self-reinforcing dynamic the World Bank’s June 2026 report analyzes in detail under a dedicated section on “A Rising Challenge: Sovereign Debt Levels and Interest Rates in EMDEs.”
- Fiscal rules show measurable benefit: World Bank analysis finds that countries adopting formal fiscal rules see budget balances improve by 1.4 percentage points of GDP within five years — but Deputy Chief Economist M. Ayhan Kose cautions that “credibility, enforcement, and political commitment ultimately determine whether fiscal rules deliver stability and growth,” meaning the rules alone are insufficient without genuine follow-through.
- The scale of the underlying problem remains severe by any historical standard: global public debt has reached roughly $97 trillion, developing-country debt service payments have surged sharply since 2021, and dozens of developing countries remain in or at high risk of debt distress — a burden that in some cases consumes over half of national federal budgets on debt servicing alone, severely constraining capacity for development spending.
What to Watch Through Late 2026 and Into 2027
- Middle East conflict duration: Every IMF scenario is explicitly conditioned on conflict duration and scope; a longer or broader war would mechanically push outcomes toward the adverse or severe scenarios described above.
- Whether the “V-shaped recovery” materializes: the IMF’s July 2027 growth upgrade to 3.4% depends on the disinflation trend resuming and energy-price disruptions fading — neither of which is guaranteed given the stalled disinflation the Fund itself flagged.
- EMDE debt distress escalation: with borrowing costs elevated and debt service consuming a growing share of national budgets across dozens of developing economies, any further increase in global interest rates or a renewed dollar appreciation would tighten conditions further for the most vulnerable sovereigns.
- AI-driven investment durability: both institutions flag a reassessment of AI-driven productivity expectations as a genuine downside risk — if technology investment cools faster than currently assumed, it would remove one of the few consistent offsetting forces cited across every 2026 forecast vintage.
Bottom Line
The IMF’s 2026 growth forecast has been revised down and its inflation forecast revised up twice this year, driven primarily by the Middle East war’s disruption to energy markets and confidence — even as the Fund now projects a rebound to 3.4% growth in 2027. The World Bank’s parallel assessment is structurally more pessimistic about developing economies specifically, warning the 2020s risk becoming a lost decade for growth convergence, with rising EMDE sovereign debt and borrowing costs compounding the cyclical pressure from the war-driven inflation spike.
Discover more from The Economy
Subscribe to get the latest posts sent to your email.

Asian Markets Analysis: Navigating Volatility in China, Japan, and Singapore Stocks

Stagflation vs. Soft Landing: How Central Bank Rates Are Reshaping European and Asian Economies

IMF & World Bank Global Economic Outlook: Growth Forecasts Across Europe and Asia

Fed Rate Hike Projections vs. Trump’s Interest Rate Policy: What Global Markets Expect Next

Singapore Stocks: The Ultimate Safe Haven for Markets and Finance in 2026?

Marie Gluesenkamp Perez: How a Former Shop Owner’s Moderate Politics Are Shaping Tech and Economy Bills

The Future of Silicon: Supply Chain Vulnerabilities in the 2026 Tech Sector

Rolex Perpetual Market Value 2026: Why Luxury Watches Remain a Top Alternative Asset

PSX and KSE-100: How Pakistan’s Market Became One of Asia’s Best Performers

China Stocks vs. Japan Stocks: Where World Bank and IMF Data Point for 2027

Beyond Rhetoric: How the EU Is Deploying ‘All Tools’ to Rebalance Its €1 Billion-a-Day Trade Deficit with China

Elon Musk’s Next Moves: Disrupting the 2026 Global Economy

INTC Stock Forecast 2026: Can Intel’s Government-Backed Turnaround Hold?

Bitcoin Price Action in Q4 2026: Safe-Haven Asset or High-Risk Tech Play?

State Farm’s $5B Dividend 2026: Who Qualifies & Payout Dates

US-China Relations in Q3 2026: Trade Tariffs and Supply Chain Risks

Oil Surges as Strait of Hormuz Traffic Collapses Again

SpaceX Starship Flight 14: First Orbital Attempt & Starlink V3 Launch Explained

Bank of England Set to Hold Rates Through Year-End, Reuters Poll Shows

Top 30 Stocks for Investment in PSX for Massive ROI in 2026

The 2026 Crypto Regulatory Shift: What It Means for Institutional Investors

AI Chip Stocks 2026: The Best Semiconductor Investments Beyond Marvell

AI-Powered Training: The Next Multi-Billion Dollar Ecosystem in Fitness

Tween Back-to-School Trends 2026: What’s Driving the $85B Season

Russia’s Black Sea Oil Exports Fall for a Fifth Straight Week

Shein Clothes Quality & Safety in 2026: What Lab Tests Show

Global Chip Selloff Deepens: What’s Driving the Aug. 19 Semiconductor Rout

10-Year Treasury Yield Hits 4.80%: What It Means for Rates & Portfolios
-

 Markets & Finance8 months ago
Top 15 Stocks for Investment in 2026 in PSX: Your Complete Guide to Pakistan’s Best Investment Opportunities
-

 Analysis7 months ago
Johor’s Investment Boom: The Hidden Costs Behind Malaysia’s Most Ambitious Economic Surge
-

 Analysis7 months ago
Top 10 Stocks for Investment in PSX for Quick Returns in 2026
-

 Analysis7 months ago
Brazil’s Rare Earth Race: US, EU, and China Compete for Critical Minerals as Tensions Rise
-

 Banks8 months ago
Best Investments in Pakistan 2026: Top 10 Low-Price Shares and Long-Term Picks for the PSX
-

 Investment8 months ago
Top 10 Mutual Fund Managers in Pakistan for Investment in 2026: A Comprehensive Guide for Optimal Returns
-

 Global Economy9 months ago
15 Most Lucrative Sectors for Investment in Pakistan: A 2025 Data-Driven Analysis
-

 Global Economy9 months ago
Pakistan’s Export Goldmine: 10 Game-Changing Markets Where Pakistani Businesses Are Winning Big in 2025