
Markets & Finance
Top 15 Financial Stocks for Investment in PSX


The Pakistan Stock Exchange delivered a historic comeback in 2025. The KSE-100 index delivered a total return of 51.2 percent in 2025, with banking and cement stocks leading the rally The News. The banking sector emerged as the top performer, posting a total return of 103.8 percent and contributing nearly 45 percent of the total index gain The News.
What makes PSX financial sector stocks the backbone of this rally? Commercial banks remained the largest contributor to market capitalization, with a market value of Rs4.15 trillion and a share of 25.1% in total market capitalization by end-March 2026 INP. The top 10 dominance is equally stark. The Pakistan Stock Exchange data as of June 30, 2026 shows five banks in the top 10 commanding approximately PKR 3,383 billion, representing 43.3 percent of the top 10 aggregate market cap Business Recorder.
For investors searching for the best bank stocks in PSX, this guide analyzes the Top 15 Financial Stocks for Investment in PSX based on June-September 2025/2026 market capitalization, S&P Global total returns, dividend yield, PAT, EPS, and net interest margin.
Table of Contents
- Why Invest in PSX Financial Sector in 2026?
- Top 15 Financial Stocks for Investment in PSX – Detailed Analysis
- Comparison Table: At-a-Glance
- Key Risks & Expert Tips for Financial Stocks
- Final Verdict – Which Financial Stock Should You Buy?
- FAQ
Why Invest in PSX Financial Sector in 2026?
1. Unmatched Market Weight: Commercial banks market value stood at Rs4.15 trillion with a 25.1% share of total PSX market cap as of March 2026 INP. When banks move, the KSE-100 index performance moves.
2. Historic Profitability: The KSE-100 banking sector recorded its highest-ever profit after tax (PAT) at $1.15 billion in the first half of 2025, a 19% year-on-year increase Business Recorder. Elevated policy rates supported healthy net interest margin, while remittances provided low-cost deposits.
3. Proven Index Driver: The listed banks played a key role in the KSE-100 Index’s historic rally from 50,000 to 150,000 points. Since June 2023 to date, the banking sector has contributed approximately 35% to the index’s overall gains Business Recorder.
4. S&P Global Validation: Seven Pakistani banks made it to S&P Global’s best performing Asia-Pacific bank stocks in 2025 Business Recorder. Pakistan banks delivered some of the highest total returns to investors among banks in Asia-Pacific in 2025 Business Recorder. This global recognition is driving overseas Pakistani interest in high dividend stocks PSX.
5. Structural Opportunity: Despite growth, Advance to Deposit Ratio remained modest at 39.8 percent as of December 2025 Business Recorder. Private sector credit is only around 11% of GDP, indicating massive room for lending growth once rates ease further. Banks are currently highly liquid and investing heavily in government securities, which de-risks balance sheets.
For retail investors looking for PSX financial sector stocks, the combination of high dividend yield, strong PAT, and low valuations vs. regional peers makes 2026 an entry window.
Top 15 Financial Stocks for Investment in PSX – Detailed Analysis
1. UBL – United Bank Limited
The titan of PSX. UBL is officially the second most valuable listed company on the PSX Business Recorder and its market capitalization experienced an astounding six-fold surge in just two years, leaping from under $0.5 billion to nearly $3 billion Business Recorder.
| Metric | Detail |
|---|---|
| Ticker | UBL |
| Market Cap | $3,352 million Business Recorder |
| 2025 Total Return | 143.7% Business Recorder |
| Dividend Yield | ∼12-13% |
| Why It’s a Top Pick | Highest market capitalization in banking, consolidated PAT Rs36.11 billion in Q1 2025, up 124% YoY Business Recorder. Beneficiary of Silkbank merger, strong international franchise. |
| Risk Factor | High valuation run-up, exposure to interest rate cut cycle affecting net interest margin |
E-E-A-T Note: Best for blue-chip stability. UBL contributed 321 points to KSE-100 in volatile weeks, showing institutional confidence.
2. MEBL – Meezan Bank Limited
Pakistan’s largest Islamic Bank and the leader in Islamic banks PSX category. Meezan Bank’s market cap stands at $2,516 million Business Recorder.
| Metric | Detail |
|---|---|
| Ticker | MEBL |
| Market Cap | $2,516 million Business Recorder |
| 2025 Total Return | ∼85% |
| Dividend Yield | ∼11% |
| Why It’s a Top Pick | Largest Islamic bank, 57.5% of listed securities are Shariah-compliant. PAT Rs22.42 billion in Q1 2025 with EPS Rs12.32 Business Recorder. Superior asset quality, best Advance to Deposit Ratio in Islamic space. |
| Risk Factor | Islamic banking net margin compression if SBP cuts rates faster |
Meezan Bank vs UBL: If you want ethical + growth, MEBL wins on ROE (45%+ historically). If you want absolute market cap dominance and conventional banking diversity, UBL wins. Many overseas portfolios hold both to hedge.
3. MCB Bank Limited (MCB)
One of the pioneers, first Pakistani bank with GDRs listed on London Stock Exchange Business Recorder.
| Metric | Detail |
|---|---|
| Ticker | MCB |
| Market Cap | $1,501 million Business Recorder |
| 2025 Total Return | ∼65% |
| Dividend Yield | 13.5% (highest among large caps) |
| Why It’s a Top Pick | PAT Rs63.47 billion in 2024 Business Recorder, fee income up 10% YoY to Rs24.78bn. Ultra-low cost deposits, best cost-to-income among big 5. |
| Risk Factor | Family-concentrated shareholding, slower branch growth |
4. HBL – Habib Bank Limited
Pakistan’s largest bank by assets, with parent Aga Khan Fund for Economic Development Business Recorder.
| Metric | Detail |
|---|---|
| Ticker | HBL |
| Market Cap | $1,360 million Business Recorder |
| 2025 Total Return | ∼70% |
| Dividend Yield | 10-11% |
| Why It’s a Top Pick | Consolidated PBT Rs75.3 billion in H1 2025, up 30% YoY, PAT Rs34.4 billion up 19% Business Recorder. EPS Rs23.44. Best international network for remittances. |
| Risk Factor | Higher operating cost, legacy compliance costs overseas |
5. NBP – National Bank of Pakistan
The government-owned giant turned turnaround star.
| Metric | Detail |
|---|---|
| Ticker | NBP |
| Market Cap | $1,296 million Business Recorder |
| 2025 Total Return | 301.3% – Ranked 2nd in Asia-Pacific Business Recorder |
| Dividend Yield | 8% |
| Why It’s a Top Pick | Total returns of 301.3% in 2025 Business Recorder. Surpassed Rs100 billion in gold-backed loans, PBT Rs56.7 billion despite Rs68bn pension charge. |
| Risk Factor | Government intervention risk, high pension litigation exposure |
6. SCBPL – Standard Chartered Bank Pakistan
The only foreign bank in the high dividend stocks PSX club.
| Metric | Detail |
|---|---|
| Ticker | SCBPL |
| Market Cap | $1,022 million Business Recorder |
| 2025 Total Return | ∼45% |
| Dividend Yield | 14% |
| Why It’s a Top Pick | PBT Rs32.9 billion in H1 2025 Business Recorder, best-in-class capital adequacy. Parent support, premium corporate book. |
| Risk Factor | Lower revenue Rs44.4bn down 24% YoY due to rate cuts Business Recorder, limited growth ambition |
7. BAHL – Bank AL Habib
Quiet compounder favored by high-net-worth families.
| Metric | Detail |
|---|---|
| Ticker | BAHL |
| Market Cap | $758 million Business Recorder |
| 2025 Total Return | ∼55% |
| Dividend Yield | 12% |
| Why It’s a Top Pick | Net interest income Rs33.71bn in Q1 2025, EPS Rs9.65 up from Rs9.22 Business Recorder. Most consistent dividend payer, closed Kenya office to focus on Pakistan. |
| Risk Factor | Low free float, limited analyst coverage |
8. ABL – Allied Bank Limited
| Metric | Detail |
|---|---|
| Ticker | ABL |
| Market Cap | $707 million Business Recorder |
| 2025 Total Return | ∼50% |
| Dividend Yield | 13% |
| Why It’s a Top Pick | PAT Rs44.4 billion in 2024, up 7% YoY, EPS Rs38.77 Business Recorder. Strong capital buffer, zero NPL growth. |
| Risk Factor | Conservative lending limits growth in bull market |
9. BAFL – Bank Alfalah
| Metric | Detail |
|---|---|
| Ticker | BAFL |
| Market Cap | $591 million Business Recorder |
| 2025 Total Return | ∼60% |
| Dividend Yield | 11% |
| Why It’s a Top Pick | Consolidated PAT Rs39.9bn in 2024, up 10% YoY, EPS Rs25.27 Business Recorder. Digital banking leader, high non-markup income. |
| Risk Factor | Abu Dhabi Group ownership overhang |
10. HMB – Habib Metropolitan Bank
| Metric | Detail |
|---|---|
| Ticker | HMB |
| Market Cap | $454 million Business Recorder |
| 2025 Total Return | ∼40% |
| Dividend Yield | 12.5% |
| Why It’s a Top Pick | Subsidiary of Habib Bank AG Zurich with 51% share Business Recorder, 500+ branches, presence in 10 countries. Defensive stock. |
| Risk Factor | Low liquidity, small free float |
11. BOP – The Bank of Punjab
The comeback king. Ranked #1 bank in Asia-Pacific by S&P Global with total returns of 333.8% in 2025 Business Recorder.
| Metric | Detail |
|---|---|
| Ticker | BOP |
| Market Cap | ~$450M |
| 2025 Total Return | 333.8% Business Recorder |
| Dividend Yield | 7% |
| Why It’s a Top Pick | Operating profit Rs15.52 billion in H1 2025, up 278% YoY Business Recorder. First-ever interim dividend 10%. Highest-ever profit CY25 Rs15.4bn. |
| Risk Factor | Government of Punjab ownership, historically volatile asset quality |
12. Askari Bank (AKBL)
S&P Global star with 194.2% total return Business Recorder.
| Metric | Detail |
|---|---|
| Ticker | AKBL |
| Market Cap | ~$380M |
| 2025 Total Return | 194.2% Business Recorder |
| Dividend Yield | 6.73% TTM |
| Why It’s a Top Pick | Army Welfare Trust backing, Fauji Foundation merger synergies, corporate banking strength. |
| Risk Factor | Mid-tier net interest margin vs big 5 |
13. Bank of Khyber (BOK)
Northern powerhouse.
| Metric | Detail |
|---|---|
| Ticker | BOK |
| Market Cap | ~$210M |
| 2025 Total Return | 177.4% Business Recorder |
| Dividend Yield | 12% |
| Why It’s a Top Pick | PAT Rs5.82 billion in FY25, up 61% YoY, highest in bank history Business Recorder. EPS Rs5.02, total dividend Rs3.20/share (32%). |
| Risk Factor | KP government concentration, regional political risk |
14. FABL – Faysal Bank
Fastest growing Islamic conversion story.
| Metric | Detail |
|---|---|
| Ticker | FABL |
| Market Cap | ~$650M |
| 2025 Total Return | 115.1% Business Recorder |
| Dividend Yield | 9% |
| Why It’s a Top Pick | PBT PKR 47 billion and net profit PKR 21.7 billion for 2025, EPS PKR 14.30 Business Recorder. Full Islamic conversion completed. |
| Risk Factor | Branch expansion costs pressuring cost-to-income |
15. BML – Bank Makramah (formerly Summit Bank)
Pure turnaround growth story.
| Metric | Detail |
|---|---|
| Ticker | BML |
| Market Cap | ~$180M |
| 2025 Total Return | 119.6% Business Recorder |
| Dividend Yield | Nil (reinvesting) |
| Why It’s a Top Pick | S&P Global top 10 Asia-Pacific performer, new management, Nimir Group acquisition, cleaned balance sheet. Best capital gains play among Top 15 Financial Stocks for Investment in PSX. |
| Risk Factor | Highest risk, no dividend, still in consolidation phase |
Comparison Table: At-a-Glance
| Bank | Ticker | Market Cap (Sep 2025) | S&P 2025 Return | PAT Highlight | Best For |
|---|---|---|---|---|---|
| UBL | UBL | $3,352M Business Recorder | 143.7% | Rs36.11bn Q1 PAT +124% | Large Cap Stability |
| MEBL | MEBL | $2,516M Business Recorder | Rs22.42bn Q1 PAT | Islamic Growth | |
| MCB | MCB | $1,501M Business Recorder | Rs63.47bn FY24 PAT | Highest Dividend | |
| HBL | HBL | $1,360M Business Recorder | Rs34.4bn H1 PAT +19% | Remittance Play | |
| NBP | NBP | $1,296M Business Recorder | 301.3% | Rs56.7bn PBT | Turnaround Momentum |
| BOP | BOP | $450M | 333.8% Business Recorder | Rs15.52bn Op Profit +278% | Highest Growth |
| Askari | AKBL | $380M | 194.2% Business Recorder | Strong corporate | Mid-Cap Value |
| BOK | BOK | $210M | 177.4% Business Recorder | Rs5.82bn PAT +61% | High Dividend |
Key Risks & Expert Tips for Financial Stocks
Key Risks:
- Interest Rate Reversal: Net interest margin will compress as SBP cuts from 22% peak to ∼12%. Banks with high Advance to Deposit Ratio like MEBL will be more resilient.
- Taxation: Super tax and windfall taxes have kept effective tax rate 49-54% for banks. Any new levy hits EPS directly.
- Crowding Out: Banks channel substantial liquidity into government securities Business Recorder. Private credit is only 11% of GDP.
- Dividend Expectations: SCBPL posted profit before tax Rs32.9bn in H1 2025 vs Rs49.3bn last year, down 24% due to rate cuts Business Recorder. Expect yield moderation.
Expert Tips:
- Don’t chase only 2025 return. BOP’s 333.8% is not repeatable annually; combine with market capitalization leaders for balance.
- For high dividend stocks PSX, focus on MCB, ABL, BAHL – they pay 90%+ payout consistently.
- Check Advance to Deposit Ratio – ideal 45-60%. Below 40% means bank is not lending enough for future growth.
- For Islamic banks PSX, MEBL + FABL combo gives you large + mid cap Islamic exposure.
- Use staggered buying. PSX KSE-100 banking sector contributed 35% to rally Business Recorder – it will be volatile on profit-booking.
Final Verdict – Which Financial Stock Should You Buy?
There is no single best bank stock in PSX. It depends on your investor profile:
- For Conservative Long-Term & Overseas Pakistanis: UBL + MEBL + MCB. This trio covers 60% of banking sector market cap. UBL gives you 2nd most valuable company status Business Recorder, MEBL gives Islamic growth, MCB gives highest dividend yield. This is the core of any Top 15 Financial Stocks for Investment in PSX portfolio.
- For Aggressive Growth & Capital Gains: BOP + NBP + BOK + AKBL. All four delivered 177-333% returns in 2025 per S&P Global Business Recorder. They are mid-tier banks with massive re-rating potential but higher risk.
- For Income Investors (High Dividend Stocks PSX): SCBPL + ABL + BAHL + HMB. Consistently 11-14% yield, best for monthly income seekers.
- For Turnaround Speculators: Bank Makramah (BML). Ranked 10th in Asia-Pacific with 119.6% return Business Recorder. High risk, high reward.
My Model Portfolio for 2026: 50% in Top 5 (UBL 20%, MEBL 15%, MCB 15%), 30% in Mid-Cap Performers (BOP 10%, NBP 10%, Askari 10%), 20% in Dividend (SCBPL, BAHL). Rebalance quarterly based on PAT and net interest margin trends.
FAQ
1. What is the best financial stock in PSX for 2026?
For market capitalization and stability, United Bank Limited (UBL) at $3,352 million is the best financial stock Business Recorder. For total return, Bank of Punjab with 333.8% return in 2025 topped Asia-Pacific Business Recorder. A balanced portfolio should include both large-cap and mid-cap winners.
2. Which PSX bank gives highest dividend?
Among large caps, MCB Bank and Allied Bank offer 12-13.5% dividend yield. Standard Chartered Pakistan (SCBPL) historically pays 14% but its PBT fell to Rs32.9bn in H1 2025 vs Rs49.3bn Business Recorder, so yield may moderate.
3. Is Meezan Bank a good investment vs UBL?
Meezan Bank vs UBL is Islamic vs Conventional debate. MEBL has higher ROE and is largest Islamic Bank at $2,516M market cap Business Recorder, while UBL is 2nd most valuable listed company overall with $3,352M cap Business Recorder. MEBL suits Shariah-compliant growth investors; UBL suits stability seekers. Both are top holdings in PSX KSE-100 banking sector.
4. Why did PSX banking stocks rally so much in 2025?
Three reasons: 1) KSE-100 banking sector PAT hit record $1.15bn in H1 2025 up 19% Business Recorder, 2) Banking sector contributed 35% to index rally from 50k to 150k Business Recorder, 3) Pakistan banks delivered highest total returns in Asia-Pacific per S&P Global with BOP 333.8% leading Business Recorder.
5. What is Advance to Deposit Ratio and why does it matter?
Advance to Deposit Ratio (ADR) shows how much of deposits are lent. Industry ADR was 39.8% as of Dec 2025 Business Recorder, which is low. Low ADR means banks are safe but not growing lending. A rising ADR signals future profit growth from private credit, which is only 11% of GDP currently.
Disclaimer: This is not financial advice. Do your own research (DYOR) and consult a licensed financial advisor. PSX investments carry market risk. Past returns (e.g., BOP 333.8%, Askari 194.2%) do not guarantee future performance. Data as of September 2025/March 2026 per sources.
Sources & References
- Business Recorder – Top 10 commercial banks as of September 2025 market cap data
- Business Recorder – UBL 2nd most valuable, 6-fold surge
- Business Recorder – Seven Pakistani banks in S&P Global best performing Asia-Pacific 2025, BOP 333.8%
- The News – KSE-100 delivered 51.2% in 2025, banking sector 103.8% return
- INP – Commercial banks Rs4.15 trillion market cap 25.1% share
- Business Recorder – Banking sector dominance 43.3% of top 10
- Business Recorder – Bank of Khyber PAT 5.8bn, Faysal Bank PBT 47bn
- Business Recorder – BOP operating profit 278% growth
Discover more from The Economy
Subscribe to get the latest posts sent to your email.



Is SpaceX going public in 2026? SpaceX is actively preparing for a potential initial public offering targeted for mid-to-late 2026, with reported valuation estimates that have climbed dramatically over the course of the year — from around $800 billion in insider share-sale discussions in December 2025, to over $1 trillion by mid-2026, to Bloomberg reports of a $1.5 trillion target more recently, according to reporting compiled by Capital Brief. That trajectory represents an extraordinary escalation from SpaceX’s own late-2023 tender offer valuation of roughly $175 billion — nearly a tenfold increase in under three years.
If completed anywhere near the higher end of reported estimates, this would be the largest initial public offering in history, surpassing Saudi Arabia’s Aramco, which remains the only company ever to reach a trillion-dollar-plus IPO valuation, having listed at $1.7 trillion in 2019.
What’s Actually Confirmed, Versus Speculation
Featured Snippet Target: Elon Musk has effectively confirmed SpaceX is preparing for a 2026 IPO, responding “As usual, Eric is accurate” to a journalist’s analysis of why the company appears ready to go public — but Musk has separately and explicitly disputed specific valuation figures reported by Bloomberg and the Wall Street Journal, meaning the exact valuation, timing, and even whether the full company (versus just Starlink) will be listed all remain genuinely unconfirmed as of September 2026.
That distinction matters for anyone reading SpaceX IPO headlines this year: the company’s intent to go public appears real and has been acknowledged by Musk himself, but nearly every specific number attached to the deal — from the $800 billion figure to the more recent $1.5 trillion reports — has come from unnamed sources cited by financial media rather than official company disclosures, and Musk has pushed back on at least one of those figures directly.
Why SpaceX Is Considering Going Public Now
SpaceX board director Kimbal Musk’s associate and company leadership have framed the potential IPO around a specific financial threshold: Musk has previously stated Starlink specifically would go public once its revenue growth became steady and predictable — a milestone the company appears to have now reached. SpaceX’s overall revenue is projected to reach roughly $15 billion in 2025, climbing to an estimated $22-24 billion in 2026, with Starlink as the primary revenue driver, according to reporting from IDN Financials.
SpaceX’s own internal communications have framed the potential listing explicitly around funding needs rather than simply providing liquidity to existing shareholders. In a December 2025 letter to shareholders, SpaceX indicated plans to channel IPO proceeds toward accelerating the Starship rocket program’s launch cadence, establishing AI-powered data centers in orbit, developing a “Moonbase Alpha” concept, and supporting both robotic and eventual human missions to Mars, according to Outlook Business. That’s a notably broader capital-allocation vision than a typical IPO prospectus, reflecting SpaceX’s unusual position as simultaneously a commercial launch provider, a satellite internet company, and an increasingly central node in U.S. space and defense strategy.
Listing the Whole Company, Not Just Starlink
An important shift in SpaceX’s IPO planning during 2026 has been the move away from spinning off Starlink as a standalone public entity — long considered the most likely path to a public listing — toward preparing to list SpaceX’s core business in its entirety. According to DriveTeslaCanada’s reporting on Bloomberg’s coverage, that shift would bring the full SpaceX operation — rockets, Starlink satellites, a growing defense contracting business, and various off-world infrastructure projects — into a single public entity, rather than carving out only the more straightforwardly valued satellite-internet business.
That distinction matters enormously for how the eventual IPO gets valued. Starlink alone, as a subscription satellite-internet business, would be comparatively simple for public-market analysts to model against comparable telecom and satellite companies. The full SpaceX entity — encompassing an active national-security launch provider handling more than 80% of global payload weight, according to analysis from QZ, alongside a rapidly scaling satellite business and speculative future ventures like orbital data centers and lunar infrastructure — is a fundamentally harder company for public markets to price cleanly.
The Comparison That Keeps Coming Up
Every report on SpaceX’s potential IPO valuation inevitably returns to the same comparison: Saudi Aramco’s 2019 listing, which raised approximately $29 billion at a $1.7 trillion valuation and remains the only trillion-dollar-plus IPO in history. If SpaceX executes even the lower end of its reported fundraising targets — $25-30 billion raised — it would still exceed Aramco’s raise amount while potentially matching or exceeding Aramco’s valuation, depending on which of the widely varying reported figures ultimately proves accurate. Some reports suggest SpaceX could reach a valuation “in the same valuation airspace as Meta or Amazon” — a scale of comparison that, regardless of the exact final number, places SpaceX’s potential public debut among a small handful of the most consequential stock-market listings in history.
The Bottom Line
SpaceX’s 2026 IPO remains genuinely in-progress rather than finalized: Musk has acknowledged the company is preparing for a public listing, but the specific valuation (reported anywhere from $800 billion to $1.5 trillion), timing (mid-to-late 2026, with some reports suggesting a possible slip into 2027), and structure (full company versus Starlink spinoff) all remain unconfirmed by the company itself. What is clear is that any completed listing at even the lower end of reported estimates would represent one of the most significant capital markets events in recent history, both for its sheer scale and for what it would signal about public investors’ appetite for space, satellite, and AI-infrastructure exposure in a single company.
Next step: Investors and space-industry watchers should treat specific SpaceX IPO valuation figures reported by any single outlet with real skepticism until the company files actual registration documents — the reported estimates have nearly doubled within a matter of months this year, and Musk himself has directly disputed at least one widely-cited figure.
Discover more from The Economy
Subscribe to get the latest posts sent to your email.
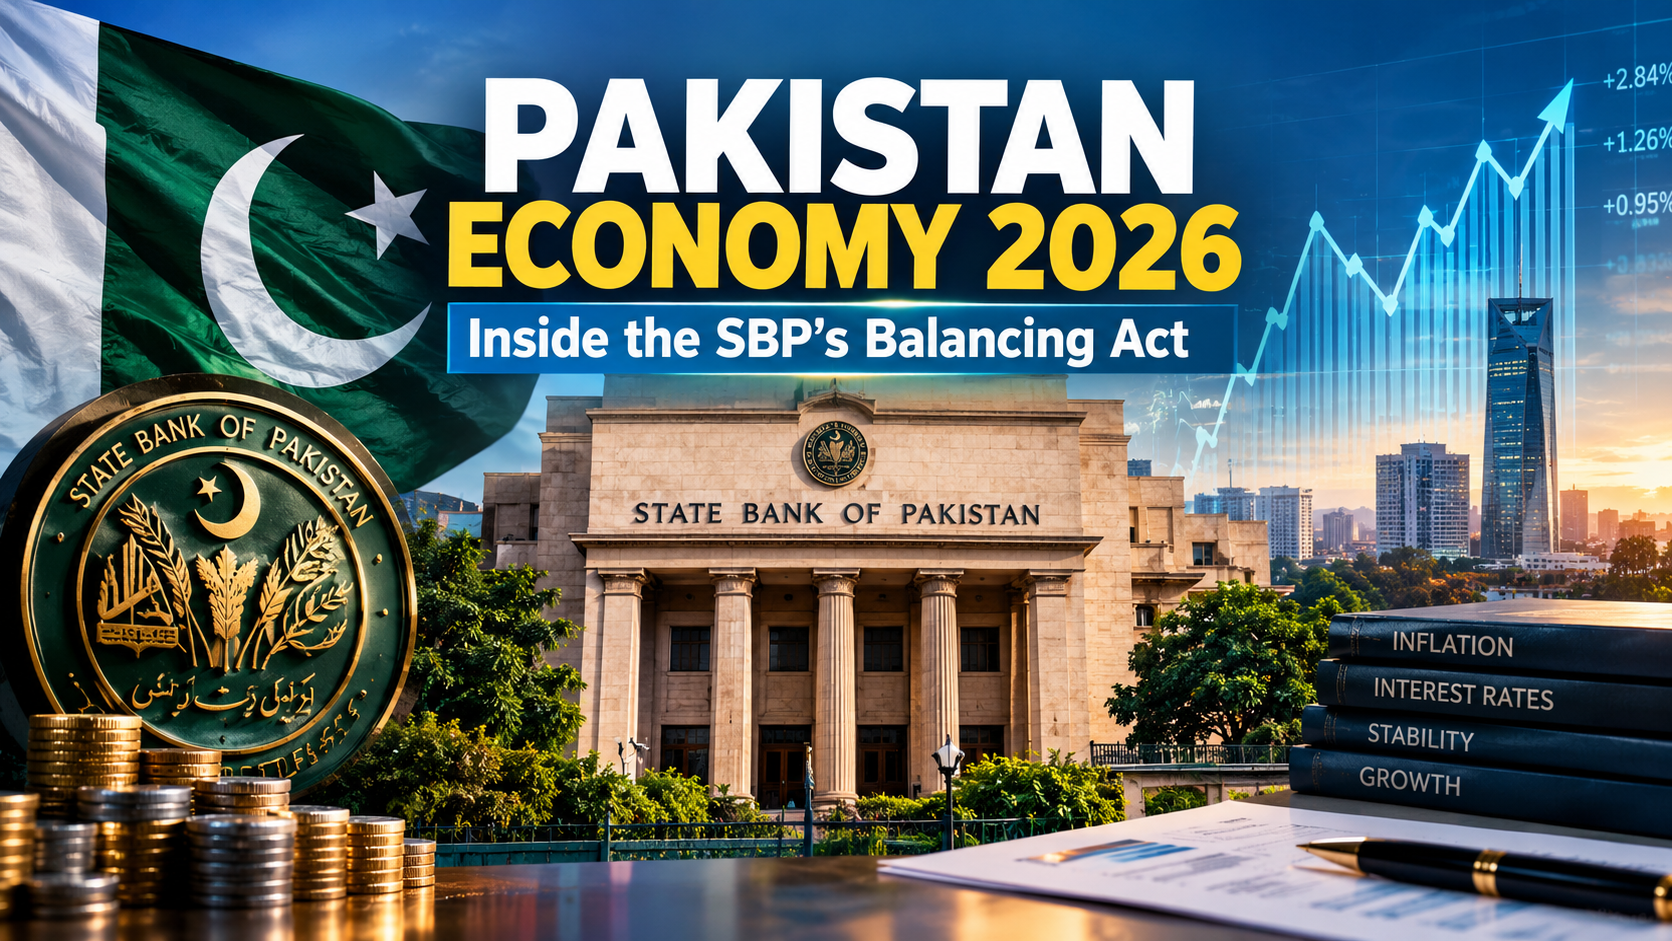
What is Pakistan’s central bank policy rate in 2026? The State Bank of Pakistan (SBP) held its policy rate unchanged at 11.5% at its September 14, 2026 meeting, according to the central bank’s official statement, even as headline inflation jumped to 11.1% year-on-year in August from 9.2% in July. The Monetary Policy Committee specifically cited the “recent intensification of the prolonged Middle East conflict” as having pushed already-elevated global commodity prices even higher, compounding persistent supply chain disruptions — a clear signal that Pakistan’s domestic inflation fight in 2026 has become inseparable from the global oil-price volatility tied to the Strait of Hormuz crisis.
That single decision captures the core tension defining Pakistan’s economy this year: a genuine, hard-won macroeconomic stabilization story running headlong into external shocks the country has no control over.
The Long Road From 22% to 11.5%
Featured Snippet Target: The State Bank of Pakistan has cut its policy rate by roughly 1,100 basis points since June 2024, when rates peaked at 22% amid inflation nearing 40% — one of the most aggressive monetary easing campaigns among emerging-market central banks in recent history — before pausing the cutting cycle in 2025 and holding steady through 2026 amid renewed inflation risk from Middle East-driven commodity price increases.
That easing campaign reflected a genuine turnaround in Pakistan’s inflation trajectory: from a peak above 38% in May 2023, inflation had fallen to single digits by late 2024, allowing the central bank room for aggressive cuts. But the pace of easing slowed and eventually paused as new pressures emerged — first flood-related agricultural disruptions in late 2025, and then, more significantly, the economic fallout from the Iran conflict that erupted in February 2026.
The Pause, Meeting by Meeting
The SBP’s rate path through 2026 has been a study in caution rather than continued easing. The central bank held rates steady at 11% in October 2025 for a fourth consecutive meeting, citing modest economic growth alongside external-sector vulnerabilities and inflation risks, with foreign exchange reserves projected to reach $15.5 billion by December 2025 and around $17.8 billion by June 2026, according to reporting from Arab News. By April 2026, with Middle East tensions escalating and oil prices surging, the SBP raised its rate by 100 basis points to 11.50%, according to ARY News — reversing its prior easing bias entirely in direct response to the geopolitical shock. The rate has been held steady at that level through subsequent meetings in June, July, and September.
The Good News Buried in the September Statement
Despite the inflation jump, the SBP’s September policy statement contained several genuinely positive developments that complicate any purely negative reading of Pakistan’s 2026 economic trajectory. The central bank’s foreign exchange reserves surpassed the end-June 2026 target of $18 billion, driven by continued FX purchases amid a small current account deficit for the fiscal year and the realization of planned official inflows. Separately, Standard & Poor’s upgraded Pakistan’s sovereign credit rating to “B” during the year — a meaningful signal of improving international investor confidence in the country’s debt sustainability. Inflation expectations among both consumers and businesses had also eased in the latest sentiment surveys, according to the SBP’s own reporting, suggesting the current inflation spike is being read by markets as externally-driven rather than a sign of a fundamental loss of policy credibility.
Growth, Floods, and a Still-Live IMF Program
Pakistan’s real GDP growth for the fiscal year was revised upward into the upper half of a previously projected 3.25%-4.25% range as of late 2025, underpinned by robust performance in agriculture and industry alongside rising domestic demand, according to Trading Economics coverage of the central bank’s own projections. That growth trajectory has had to absorb genuine shocks: flood-related crop losses drove a temporary inflation spike to 5.6% in September 2025, and border closures with Afghanistan disrupted staple food supplies including tomatoes and apples. Pakistan’s stabilization program remains anchored by its ongoing International Monetary Fund arrangement, with fiscal consolidation and the realization of planned external inflows continuing to be treated by the SBP as prerequisites for durable macroeconomic stability, consistent with the terms of the country’s 37-month, roughly $7 billion IMF Extended Fund Facility.
The Real Asset Allocation Shift Feeding Pakistan’s Stock Rally
Pakistan’s improving macro picture — falling rates through 2024-2025, easing inflation, and rising foreign reserves — has had a direct and visible knock-on effect on domestic markets: a structural shift of household savings out of fixed-income instruments and into equities, as falling returns on traditional savings vehicles pushed investors toward the stock market, according to brokerage house Topline Securities’ analysis reported by Aaj News. That reallocation has been the primary fuel behind the KSE-100’s historic rally through 2026, even as the index has periodically corrected sharply on single-session sentiment shifts.
The Bottom Line
Pakistan’s 2026 economic story is genuinely two-sided: a real, credible stabilization achieved through 1,100 basis points of rate cuts, improving foreign reserves, a credit rating upgrade, and a domestic savings shift that has fueled one of the world’s best-performing stock markets — all now being tested by an externally-driven inflation shock tied to Middle East oil-price volatility that is entirely outside the State Bank’s control. The SBP’s response so far — holding rates steady rather than resuming cuts or panicking into further hikes — suggests the central bank is treating the current inflation spike as a temporary, externally-driven disruption rather than a sign that its underlying stabilization program has failed.
Next step: Businesses and investors tracking Pakistan’s economy should watch the SBP’s October 26, 2026 Monetary Policy Committee meeting closely — a continued hold would reinforce the “temporary external shock” reading, while any additional rate hike would signal the central bank sees the Middle East-driven inflation pressure as more durable than currently assessed.
Discover more from The Economy
Subscribe to get the latest posts sent to your email.

Is the AI stock rally a bubble? The honest answer in 2026 is that the market itself is genuinely split — and the concentration numbers explain why the debate has gotten so intense. Roughly two dozen stocks now account for over half of the S&P 500’s total value, a concentration level comparable to the 32-stock peak reached during the 2000 dot-com bubble, according to market analysis relayed through Charles Schwab’s commentary. Three companies alone — Alphabet, Amazon, and Meta — are expected to drive roughly 70% of the S&P 500’s entire 2026 earnings growth.
That’s the bear case in a single statistic: an index marketed to investors as broadly diversified across 500 companies is, in practice, a leveraged bet on whether a handful of AI infrastructure spenders convert capital expenditure into earnings fast enough to justify their valuations.
The Bull Case: Spending Is Turning Into Real Revenue
Featured Snippet Target: The bull case for 2026’s AI rally rests on genuine, verifiable revenue growth rather than pure speculation — Microsoft’s AI revenue run rate surpassed $37 billion annually, Alphabet’s Google Cloud backlog nearly doubled to over $460 billion, and Amazon Web Services grew 28% — figures that distinguish this cycle from dot-com-era companies that had capital spending but little corresponding revenue.
Alphabet spent $35.67 billion on capital expenditure in a single recent quarter — more than double the prior year’s pace — while Amazon led hyperscaler quarterly spending at $44.2 billion, according to reporting compiled by Yahoo Finance’s technology desk. Combined, the four largest U.S. hyperscalers — Alphabet, Amazon, Microsoft, and Meta — are on pace to spend over $700 billion in 2026 alone. Unlike the fiber-optic overbuild of the dot-com era, where telecom capacity sat unused for years, current AI infrastructure spending is being absorbed by measurable, growing cloud and AI-service revenue in the same reporting periods it’s being deployed.
The Financing Shift That’s Making Analysts Nervous
What has shifted the debate in recent months isn’t the spending itself — it’s how that spending is being funded. Goldman Sachs has characterized 2026 as marking a transition from a low-cost-of-capital “Modern” market cycle to a higher-volatility “Post-Modern” one, in which capital expenditure is increasingly rewarded over shareholder buybacks: S&P 500 companies posted 24% year-on-year capex growth in the second quarter of 2026 alongside a 1% decline in gross buybacks, according to market commentary circulated via KuCoin’s research desk.
Consensus hyperscaler capex estimates for the 2026-2028 period were revised upward from roughly $2.5 trillion to $2.8 trillion during recent earnings seasons, with gross debt issuance among these companies expected to peak near $460 billion in fiscal 2028 — roughly a third of total capex — according to Macquarie’s Investment Strategy Insights. Alphabet’s own June 2026 equity raise, combining Class A common stock, Class C capital stock, and mandatory convertible preferred shares, ranks as the largest single AI-funding capital raise in market history. That shift — from funding AI buildout purely from operating cash flow toward relying on debt and equity markets — is precisely the kind of financing pattern that historically precedes sharper corrections when growth expectations disappoint, even when the underlying business fundamentals remain genuinely strong.
Early Cracks Have Already Appeared
The market has not been uniformly bullish through 2026 — there have already been real bouts of AI-specific volatility. Mid-September commentary from CNBC noted bond yields spiking and AI-linked stocks selling off even as broader investor sentiment remained constructive on equities generally — an early signal that markets have begun pricing a wider range of outcomes for the AI capex cycle than the largely unbroken bull run of the year’s first half suggested. That divergence between AI-specific stocks and the broader market is itself notable: in a genuine across-the-board bubble, sentiment tends to move in lockstep across a sector; a split reaction suggests investors are starting to differentiate between AI companies converting spending into revenue and those merely riding sector-wide enthusiasm.
What Would Actually Confirm a Bubble
The distinction analysts increasingly draw is not “is there a lot of spending” — there unambiguously is — but whether that spending is converting into durable revenue at a pace that justifies current valuations. The genuinely bubble-confirming scenario would involve a sustained gap opening between hyperscaler capex growth and actual AI-linked revenue growth, forcing companies to either write down infrastructure investments or continue raising debt at deteriorating terms to sustain spending. As of September 2026, revenue growth at the largest hyperscalers has generally kept pace with — and in some cases exceeded — capex growth, which is the key data point separating this cycle from a pure speculative bubble so far.
The Bottom Line
The 2026 AI trade sits in a genuinely ambiguous middle ground: spending levels and market concentration have reached bubble-era extremes by historical comparison, but the revenue being generated alongside that spending remains real and, so far, largely justifies it. The financing shift toward debt — rather than the spending level itself — is the single most important variable to watch, because it introduces a genuine failure mode (refinancing risk, credit-market stress) that pure equity-funded capex would not carry. Neither the unambiguous bull case nor the unambiguous bubble case is fully supported by the data as it stands; both remain live possibilities depending on how the next several quarters of hyperscaler earnings play out.
Next step: Track the spread between hyperscaler capex growth rates and their AI-linked revenue growth rates each earnings season — a widening gap, more than any single stock’s valuation multiple, would be the clearest confirming signal that 2026’s AI rally has crossed from justified investment into unsustainable bubble territory.
Discover more from The Economy
Subscribe to get the latest posts sent to your email.

Solar Panel Installation Cost in 2026: Why the Math Changed Overnight

Business Insurance: What Coverage You Actually Need and What It Costs in 2026

Auto Insurance Quotes: How to Get the Lowest Rate Without Losing Coverage

Huntington Online Banking: Full Features, Fees, and How It Compares in 2026

Apply for a Bank Account Online: What You Need and How Long It Actually Takes

World’s Largest Economies: Ranking the Top Global Powers

Business Loan: A Complete 2026 Guide to Rates, Types, and Qualifying

Fast Invoice Factoring: How to Turn Unpaid Invoices Into Cash Within 24 Hours

Investment Banking Services: What They Cost and How to Choose the Right Firm in 2026

Structured Settlement Loan: What “Cash Now” Offers Actually Cost You

DUI Attorney: Why Your First Call After an Arrest Should Never Be to the Court

Personal Injury Lawyer: A Complete Guide to Filing Your Claim in 2026

Commercial Vehicle Accident Lawyer: Holding Companies Accountable Beyond the Driver

Inside the White House Feud: How Trump’s Allies Are Painting Anthropic’s Dario Amodei as the Face of ‘AI Doomerism’

Top 30 Stocks for Investment in PSX for Massive ROI in 2026

SpaceX Starship Flight 14: First Orbital Attempt & Starlink V3 Launch Explained

Oil Prices Break $100 in 2026: Middle East Conflict & Energy Markets

Fidelity Investments Review 2026: SPAXX Yields & Zero-Fee Funds

AI Chip Stocks 2026: The Best Semiconductor Investments Beyond Marvell

BRICS+ Cross-Border Payments 2026: Interoperability Explained

Tween Back-to-School Trends 2026: What’s Driving the $85B Season

10-Year Treasury Yield Hits 4.80%: What It Means for Rates & Portfolios

Shein Clothes Quality & Safety in 2026: What Lab Tests Show

China’s US$10.8 Billion Trade Shortcut: Why the Pinglu Canal Matters

MRVL Earnings 2026: Why Marvell Sank Despite Beating Estimates

IMF & World Bank 2026 Global Economic Outlook: Growth, Inflation, Debt

High-CPM Finance Niches 2026: Publisher Monetization Blueprint

Middle East War Economics 2026: Oil Prices & Energy Markets
-

 Markets & Finance9 months ago
Top 15 Stocks for Investment in 2026 in PSX: Your Complete Guide to Pakistan’s Best Investment Opportunities
-

 Analysis7 months ago
Johor’s Investment Boom: The Hidden Costs Behind Malaysia’s Most Ambitious Economic Surge
-

 Analysis7 months ago
Top 10 Stocks for Investment in PSX for Quick Returns in 2026
-

 Banks8 months ago
Best Investments in Pakistan 2026: Top 10 Low-Price Shares and Long-Term Picks for the PSX
-

 Analysis8 months ago
Brazil’s Rare Earth Race: US, EU, and China Compete for Critical Minerals as Tensions Rise
-

 Investment9 months ago
Top 10 Mutual Fund Managers in Pakistan for Investment in 2026: A Comprehensive Guide for Optimal Returns
-

 Global Economy9 months ago
15 Most Lucrative Sectors for Investment in Pakistan: A 2025 Data-Driven Analysis
-

 Global Economy9 months ago
Pakistan’s Export Goldmine: 10 Game-Changing Markets Where Pakistani Businesses Are Winning Big in 2025