
Global Economy
Singapore’s $133B Manufacturing Miracle: Why 4.1% Growth Changes Everything for Asia
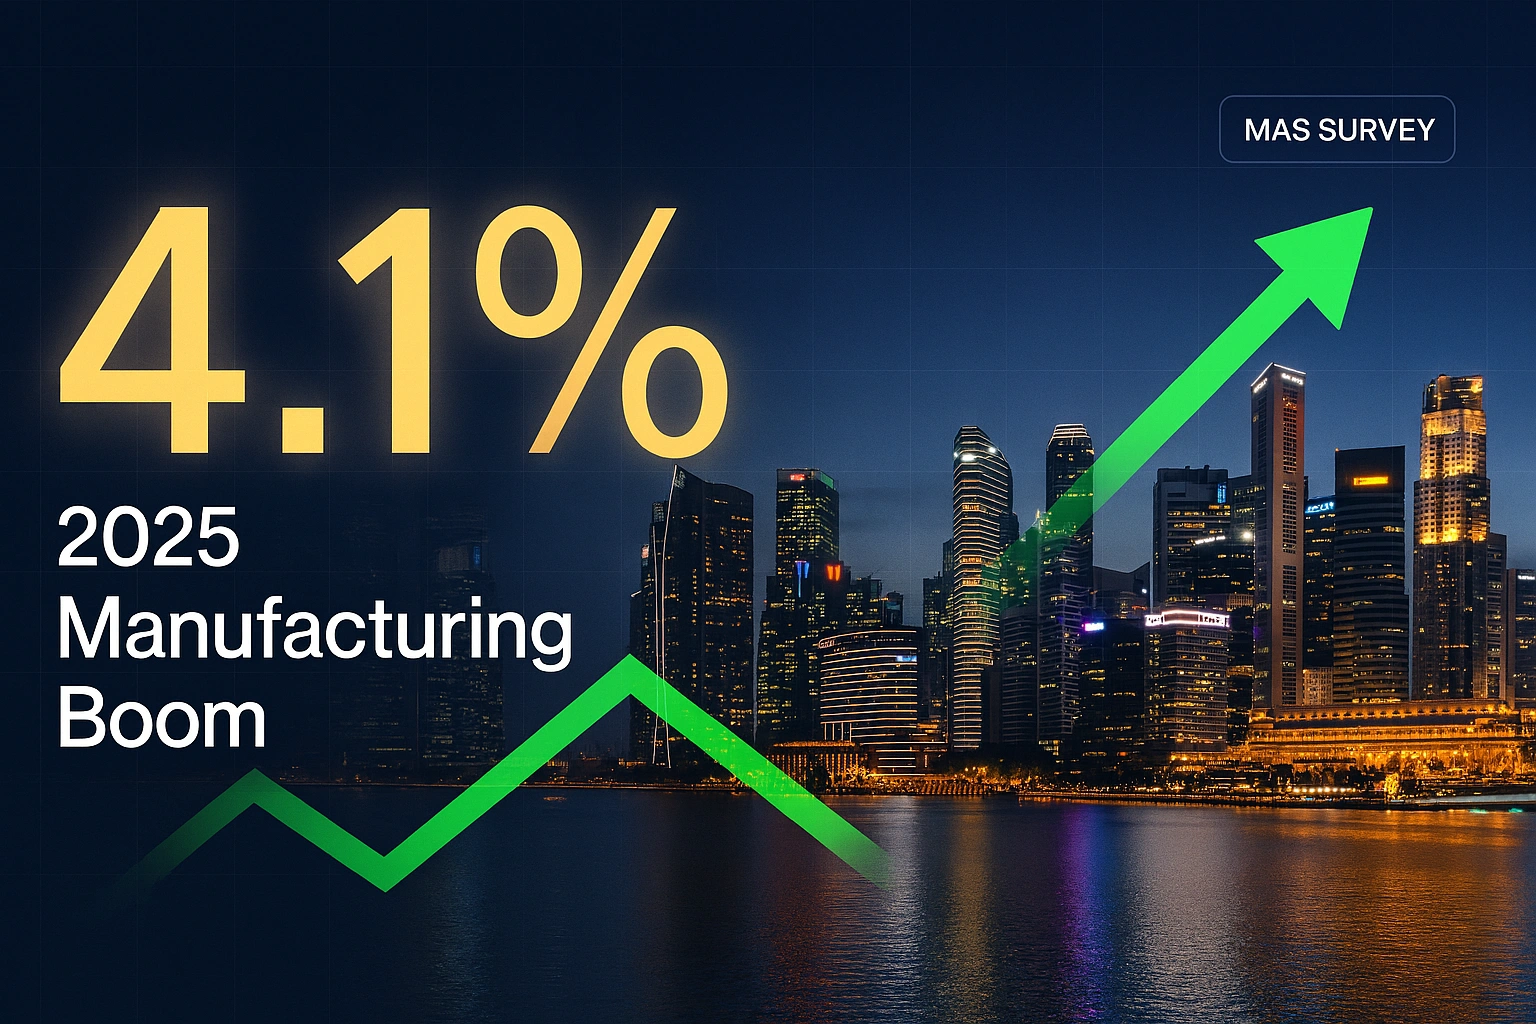
Economists dramatically upgrade 2025 forecast from 2.4% to 4.1% as semiconductor boom rewrites the growth playbook—but can the Lion City sustain momentum through 2026’s headwinds?
December 2025 — When 20 leading economists gathered for the Monetary Authority of Singapore’s December survey, their revised numbers told a story that few saw coming six months ago. Singapore’s 2025 GDP growth forecast now stands at 4.1%—a dramatic upgrade from September’s modest 2.4% projection and a wholesale repudiation of June’s pessimistic 1.7% estimate.
This isn’t just statistical noise. It’s a fundamental reassessment of Singapore’s economic trajectory, powered by a manufacturing renaissance that saw October production surge 29.1% year-over-year—the strongest growth since November 2010. But here’s the twist: as economists project 2026 growth to moderate to 2.3%, Singapore faces a critical question: Is this a sustainable transformation or a temporary boom driven by AI-fueled semiconductor demand?
The Numbers That Shocked the Forecasters
The sharp revision reflects upgrades across all major economic sectors, with manufacturing expected to expand 5.4% in 2025, up from earlier estimates of just 0.8%. To put this in perspective, that’s a seven-fold increase in expected manufacturing growth—a swing of unprecedented magnitude for a developed economy.
The sectoral breakdown reveals where Singapore’s strength truly lies:
- Manufacturing: 5.4% growth (up from 0.8% forecast)
- Finance & Insurance: 4.1% (up from 3.3%)
- Construction: 4.8% (up from 4.7%)
- Wholesale & Retail Trade: 4.4% (up from 2.9%)
- Private Consumption: 3.8% (up from 3.1%)
- Non-Oil Domestic Exports: 4.5% (up from 2.2%)
In the third quarter of 2025, Singapore’s economy expanded by 4.2% year-on-year, significantly exceeding the economists’ median forecast of just 0.9%. This wasn’t marginal outperformance—it was a complete upending of expectations that forced a fundamental reassessment of Singapore’s economic potential.
The Manufacturing Engine Roars Back to Life
Singapore’s manufacturing sector, which contributes approximately 17% of the nation’s GDP, has undergone a remarkable transformation. October 2025 manufacturing production jumped 29.1% year-over-year, marking the sharpest growth since November 2010, driven by an explosive cocktail of biomedical manufacturing, electronics, and transport engineering.
The data reveals three distinct manufacturing powerhouses:
Biomedical Manufacturing: The standout performer, with October output soaring 89.6%, led by pharmaceuticals which surged 122.9%. This sector, which has historically contributed over 18% of Singapore’s manufacturing output, has become a critical pillar of the economy. In 2023 alone, the biomedical sector generated production valued in excess of tens of billions of dollars.
Electronics Cluster: Electronics expanded 26.9% in October, bolstered by a 155.6% surge in the infocomms and consumer electronics segment. The semiconductor industry, accounting for 44% of Singapore’s total manufacturing output, has been the primary beneficiary of global AI infrastructure buildout. Singapore now contributes more than 10% of global semiconductor output and produces approximately 20% of the world’s semiconductor equipment.
Transport Engineering: Transport engineering rose 29.5% in October, supported by aerospace production and higher-value maintenance, repair, and overhaul jobs. Singapore’s strategic position as Asia’s aerospace hub continues to pay dividends, with the sector benefiting from post-pandemic recovery in global aviation.
The manufacturing renaissance didn’t emerge overnight. Singapore’s semiconductor manufacturing sector generated over S$133 billion (US$101 billion) in 2023, contributing approximately seven percent of the nation’s GDP. The government’s S$18 billion commitment (US$13.6 billion) between 2021 and 2025 for semiconductor R&D, infrastructure development, and tax incentives has created an ecosystem where innovation thrives.
Why 2026 Looks Different: The Moderation Story
While 2025’s performance has exceeded all expectations, economists project Singapore’s GDP growth will moderate to 2.3% in 2026, with the most probable outcome falling within the 2.0-2.4% range. This isn’t pessimism—it’s realism grounded in three converging factors.
The Front-Loading Effect Fades: Much of 2025’s export surge came from businesses accelerating shipments ahead of anticipated U.S. tariffs. As one economist noted, companies may have chosen to front-load even more exports during the tariff pause period that extended to August 2025. This artificial boost won’t repeat in 2026.
Geopolitical Headwinds Intensify: Geopolitical tensions, including higher tariffs, emerged as the most cited downside risk to Singapore’s economic outlook, identified by respondents in the MAS survey. With U.S.-China tensions showing no signs of abating and the potential for sector-specific tariffs on semiconductors and pharmaceuticals looming, Singapore’s export-oriented economy faces structural challenges.
China Factor Looms Large: More robust growth in China was identified as the most frequently cited upside risk to Singapore’s economic outlook, mentioned by 60% of respondents. However, China’s own economic struggles—including a property market crisis, deflationary pressures, and slowing domestic consumption—create uncertainty for Singapore’s trade-dependent sectors.
The moderation from 4.1% to 2.3% represents a normalization toward Singapore’s long-term trend growth rate. Ministry of Trade and Industry projects 2026 growth between 1-3%, with significant uncertainty reflecting global economic volatility.
The Global Context: Singapore Versus the World
Singapore’s story cannot be understood in isolation. The broader Asia-Pacific context reveals why Singapore’s performance stands out—and what challenges lie ahead.
Regional Comparison: Southeast Asian economies delivered mixed results in the third quarter of 2025, with Vietnam maintaining its position as the region’s top-performing economy, while Malaysia posted a notable growth uptick. Singapore’s revised growth trajectory places it among the region’s strongest performers, despite being a mature, high-income economy.
The ASEAN-5 landscape reveals diverging fortunes:
- Vietnam: Continued resilience with growth exceeding regional averages
- Malaysia: Growth uptick driven by diversified manufacturing base
- Indonesia: Steady 5% growth supported by domestic consumption
- Philippines: Slower growth, recovering from one-off shocks in 2025
- Thailand: Softer growth at approximately 1.8% projected for 2026
- Singapore: 4.1% in 2025, moderating to 2.3% in 2026
Global Trade Dynamics: The ASEAN+3 region (ASEAN plus China, Japan, and Korea) is forecast to grow 4.1% in 2025 and 3.8% in 2026. Singapore’s ability to outperform this average in 2025 while moderating in line with regional trends in 2026 reflects both its manufacturing competitiveness and its vulnerability to external demand shocks.
The IMF projects global growth at 3.2% in 2025 and 3.1% in 2026, while ASEAN is expected to maintain 4.3% growth in both years. Singapore’s trajectory—exceptional in 2025, moderate in 2026—mirrors the broader pattern of manufacturing-led Asian economies adjusting to post-pandemic realities.
Inflation and Monetary Policy: The Delicate Balance
Singapore’s exceptional growth hasn’t come with an inflation cost—yet. The latest median forecasts for core inflation and headline inflation stand at 0.7% and 0.9% respectively for 2025, unchanged from September. This remarkably subdued inflation environment reflects both global disinflation trends and Singapore’s open economy structure.
Looking ahead, economists see inflation picking up in 2026, with core inflation forecast at 1.3% and headline inflation at 1.5%. The modest uptick suggests price pressures remain well-contained, giving the Monetary Authority of Singapore flexibility in monetary policy management.
Monetary Policy Outlook: Nearly all economists polled expect no shifts in MAS monetary policy in the January 2026 and April 2026 reviews, while 11% anticipate tightening in July 2026 via an increase in the Singapore dollar nominal effective exchange rate (S$NEER) policy band slope.
This marks a notable shift from the previous survey where no respondents expected any policy tightening in the first three reviews of 2026. The changing sentiment reflects growing confidence that Singapore’s growth will prove durable enough to warrant a gradual return to policy normalization.
The MAS operates through the S$NEER—managing the Singapore dollar against a trade-weighted basket of currencies rather than targeting interest rates. This approach has proven remarkably effective in maintaining price stability while allowing the economy to adjust to external shocks. The Singapore dollar has appreciated over 5% year-to-date in 2025, reflecting the economy’s strong fundamentals and Singapore’s status as a safe-haven currency in turbulent times.
The Semiconductor Wild Card: Boom, Bust, or Transformation?
No discussion of Singapore’s economic future is complete without examining the semiconductor industry’s outsized influence. The sector’s dominance—contributing 44% of manufacturing output—creates both opportunity and vulnerability.
The AI Dividend: Global demand for AI infrastructure has created a semiconductor supercycle that Singapore is perfectly positioned to exploit. The Singapore semiconductor market reached USD 10.16 billion in 2025 and is forecast to grow to USD 14.15 billion by 2030, posting a 6.9% compound annual growth rate. This growth is underpinned by data center buildouts, high-bandwidth memory demand, and advanced packaging capabilities.
Strategic Investments Pay Off: Major multinational corporations continue betting on Singapore. Companies like NXP Semiconductors and Vanguard International Semiconductor Corporation announced plans to invest USD 7.8 billion in a joint venture for a new silicon wafers manufacturing facility, expected to begin operations by 2027. Meanwhile, Micron is expanding its advanced DRAM and HBM memory production, and TSMC affiliate VIS accelerated its USD 7.8 billion Singapore fab timeline to late 2026.
The Concentration Risk: Singapore’s over-reliance on semiconductors creates vulnerability. A global semiconductor downturn in 2023-2024 demonstrated this risk, with manufacturing output contracting sharply before the 2025 recovery. The current boom raises a critical question: Are we witnessing cyclical recovery or structural transformation?
The answer lies somewhere in between. While AI-driven demand appears durable in the medium term, semiconductor cycles remain notoriously volatile. Singapore’s challenge is to maintain its manufacturing excellence while diversifying into adjacent high-value sectors.
The Policy Implications: What Singapore Must Do Now
Singapore’s economic outperformance in 2025 creates both opportunity and obligation. Policymakers face critical decisions that will determine whether today’s manufacturing boom becomes tomorrow’s sustainable competitive advantage.
Fiscal Strategy: With growth exceeding expectations, Singapore has fiscal space to invest in future capabilities. The government should prioritize:
- Continued R&D funding in semiconductors, biotech, and advanced manufacturing
- Workforce reskilling programs to address talent gaps in high-tech industries
- Infrastructure investments in digital connectivity and renewable energy
- Strategic reserves to buffer against potential downturns
Industrial Diversification: While semiconductors drive current growth, Singapore cannot afford complacency. Emerging sectors demanding attention include:
- Silicon Photonics: Critical for next-generation AI data centers, offering Singapore a pathway to maintain semiconductor leadership
- Advanced Packaging: Higher-value segment where Singapore possesses competitive advantages
- Biomedical Innovation: Building on pharmaceutical manufacturing strength to capture more of the healthcare value chain
- Green Technology: Positioning Singapore as ASEAN’s clean energy hub
Labor Market Evolution: In 2024, GlobalFoundries, Micron, STMicroelectronics, and the Institute of Microelectronics signed agreements with the Institute of Technical Education to offer student internships, staff training, and collaborative projects. These partnerships represent the kind of public-private collaboration needed to build a talent pipeline capable of sustaining high-tech manufacturing growth.
Trade Diplomacy: Singapore’s export-oriented economy requires proactive engagement with multiple trading blocs. With U.S.-China tensions unlikely to dissipate, Singapore must:
- Deepen ASEAN economic integration to create alternative markets
- Strengthen bilateral trade agreements with emerging economies
- Maintain technological neutrality to preserve access to both Western and Chinese markets
- Advocate for rules-based international trade at multilateral forums
The Risk Matrix: What Could Derail Singapore’s Momentum
Every economic forecast carries uncertainty, but Singapore’s 2026 outlook faces particularly acute risks:
Tariff Escalation: While semiconductor products currently fall outside the U.S. base tariff regime, President Trump is considering imposing targeted tariffs on semiconductor products, with 16.6% of Singapore’s exports to the United States being semiconductor-related. Such tariffs would directly impact Singapore’s largest export sector.
China Slowdown: China’s economic struggles pose the most significant downside risk. A sharper-than-expected Chinese deceleration would reduce demand for Singapore’s exports and potentially trigger a regional growth slowdown.
Semiconductor Cycle Turn: The current AI-driven semiconductor boom could prove shorter-lived than expected. If global capital expenditure on AI infrastructure plateaus or technology transitions prove slower than anticipated, Singapore’s manufacturing engine could sputter.
Geopolitical Shocks: Taiwan Strait tensions, Middle East conflicts, or unexpected policy shifts in major economies could disrupt global supply chains and trade flows, with Singapore—as a major logistics hub—particularly exposed.
Financial Market Volatility: Rising U.S. interest rates or emerging market crises could trigger capital outflows from Asia, strengthening the U.S. dollar and making Singapore’s exports less competitive.
The Upside Scenarios: How Singapore Could Exceed Expectations
Risk analysis must be balanced with opportunity assessment. Several scenarios could drive Singapore’s 2026 growth above the 2.3% consensus:
China Recovery: Robust growth in China was the most frequently cited upside risk by 60% of survey respondents. If Chinese stimulus measures prove more effective than expected, Singapore’s trade-dependent sectors would benefit disproportionately.
AI Infrastructure Boom Extends: Current AI investments might represent just the beginning of a multi-year buildout cycle. If enterprises and governments accelerate AI adoption, semiconductor demand could remain elevated longer than forecasters expect.
ASEAN Integration Accelerates: IMF analysis shows that reducing non-tariff barriers could boost ASEAN’s GDP by 4.3% over the long run, equivalent to adding over one-third of Malaysia’s current GDP to the bloc and creating approximately 4 million new jobs. Singapore, as ASEAN’s financial and logistics hub, would be a primary beneficiary.
Trade Tension Easing: Resilient global growth and the easing of trade tensions were cited as key upside risks in the MAS survey. Unexpected diplomatic breakthroughs or de-escalation could unleash pent-up investment and trade flows.
Manufacturing Renaissance Broadens: Singapore’s success in semiconductors could catalyze growth in adjacent sectors. Advanced packaging, silicon photonics, and biomedical manufacturing all offer high-value opportunities that could offset semiconductor volatility.
Investment Implications: What This Means for Your Portfolio
Singapore’s economic trajectory creates distinct opportunities and risks for different investor classes:
For Equity Investors:
- Singapore Stocks: The Straits Times Index has gained ground on strong economic fundamentals, but valuations reflect optimism. Selective exposure to semiconductor equipment suppliers, logistics companies, and financial services offers diversified Singapore exposure.
- Regional Play: Singapore’s growth provides a proxy for ASEAN economic health. Consider exchange-traded funds focusing on Southeast Asian markets for broader regional exposure.
- Sector Focus: Semiconductor equipment manufacturers, advanced packaging firms, and biomedical companies with Singapore operations warrant close attention.
For Fixed Income Investors:
- Singapore government bonds offer safe-haven characteristics with modest yields. The strong fiscal position and stable outlook make Singapore debt attractive for capital preservation.
- Corporate bonds from Singapore’s banking sector and blue-chip multinationals provide higher yields with manageable risk, particularly given the stable economic outlook.
For Currency Traders:
- The Singapore dollar’s safe-haven characteristics and central bank policy stance suggest continued strength against emerging market currencies, though appreciation against the U.S. dollar may moderate.
- The MAS’s management of the S$NEER creates a more predictable currency environment than many regional peers.
For Private Equity and Venture Capital:
- Singapore’s high-tech manufacturing ecosystem offers opportunities in semiconductor design, advanced materials, and automation technologies.
- Biomedical innovation and digital health startups benefit from Singapore’s regulatory clarity and talent pool.
- Southeast Asian expansion strategies often use Singapore as a regional headquarters, creating opportunities in logistics, fintech, and professional services.
The Long View: Singapore’s 2030 Vision
Beyond the immediate 2025-2026 cycle, Singapore’s economic strategy aims to transform the nation into an even more sophisticated knowledge economy. The government’s 10-year plan to boost manufacturing competitiveness and innovation targets significant industry growth by 2030.
Success will require navigating three fundamental tensions:
Growth versus Sustainability: Singapore’s manufacturing boom must align with climate commitments. The transition to renewable energy, circular economy principles, and green manufacturing will require substantial investment but positions Singapore as ASEAN’s sustainability leader.
Openness versus Resilience: Singapore’s prosperity depends on economic openness, yet geopolitical fragmentation pushes toward greater self-sufficiency. Balancing these imperatives will define Singapore’s strategic positioning.
Innovation versus Stability: High-tech sectors demand risk-taking and experimentation, while Singapore’s governance culture emphasizes stability and predictability. Creating space for entrepreneurial dynamism without sacrificing institutional quality presents an ongoing challenge.
The Bottom Line: A Year of Validation, A Future of Uncertainty
Singapore’s 4.1% growth in 2025 wasn’t luck—it was the payoff from decades of strategic investment in education, infrastructure, and institutions. The manufacturing surge, led by semiconductors and biomedicals, demonstrates Singapore’s ability to identify and dominate high-value sectors.
But 2026’s projected moderation to 2.3% growth serves as a reality check. Singapore cannot insulate itself from global headwinds. U.S.-China tensions, tariff uncertainties, and China’s economic struggles will constrain growth. The semiconductor cycle’s volatility adds another layer of uncertainty.
Yet Singapore enters this challenging period from a position of strength. Fiscal buffers remain robust, monetary policy has room for maneuver, and the manufacturing base has proven more resilient than pessimists feared. The nation’s ability to adapt—whether to pandemic shocks, financial crises, or geopolitical turbulence—suggests underestimating Singapore’s economic agility is unwise.
The key question isn’t whether Singapore can maintain 4% growth indefinitely—no mature economy can. It’s whether Singapore can sustain its position as Asia’s most competitive, innovative, and resilient small economy while managing the inevitable cycles of global capitalism.
Based on the evidence, Singapore has earned the benefit of the doubt. The 2025 surge wasn’t a fluke; it was a demonstration of what happens when good policy, private sector dynamism, and favorable external conditions align. The 2026 moderation won’t signal failure; it will reflect the natural rhythm of economic cycles.
For investors, policymakers, and business leaders, the message is clear: Singapore’s economic model remains robust, but complacency is the enemy of continued success. The manufacturing renaissance provides a foundation, but the next chapter requires diversification, innovation, and the same relentless focus on excellence that transformed a resource-poor island into one of the world’s richest nations.
What This Means for You
For Business Leaders: Singapore’s manufacturing strength creates opportunities in supply chain partnerships, regional expansion, and talent acquisition. Companies should evaluate Singapore as a regional headquarters or manufacturing hub, particularly in semiconductors, biomedicals, and advanced manufacturing.
For Policymakers: Singapore’s success offers a template for small, open economies navigating geopolitical tensions. Strategic investments in education, infrastructure, and targeted industrial policy can yield outsized returns—but require patience and institutional capacity.
For Investors: Singapore’s economic outperformance justifies selective exposure, but differentiate between cyclical semiconductor boom and sustainable economic transformation. Diversification across sectors and geographies remains prudent.
The story of Singapore’s 2025 manufacturing surge and 2026 moderation is ultimately a story about adaptation. In a world of rising geopolitical tensions, technological disruption, and climate change, the ability to identify opportunities, pivot quickly, and maintain institutional quality will separate winners from losers.
Singapore’s 4.1% growth in 2025 proves the Lion City still has the agility to roar. The question for 2026 and beyond is whether that roar can sustain its resonance as the global economic landscape shifts beneath its feet.
Data sources: Monetary Authority of Singapore Survey of Professional Forecasters (December 2025), Singapore Department of Statistics, Ministry of Trade and Industry, Economic Development Board, IMF World Economic Outlook, ASEAN+3 Macroeconomic Research Office, Trading Economics, and primary research.
Discover more from The Economy
Subscribe to get the latest posts sent to your email.


Banks
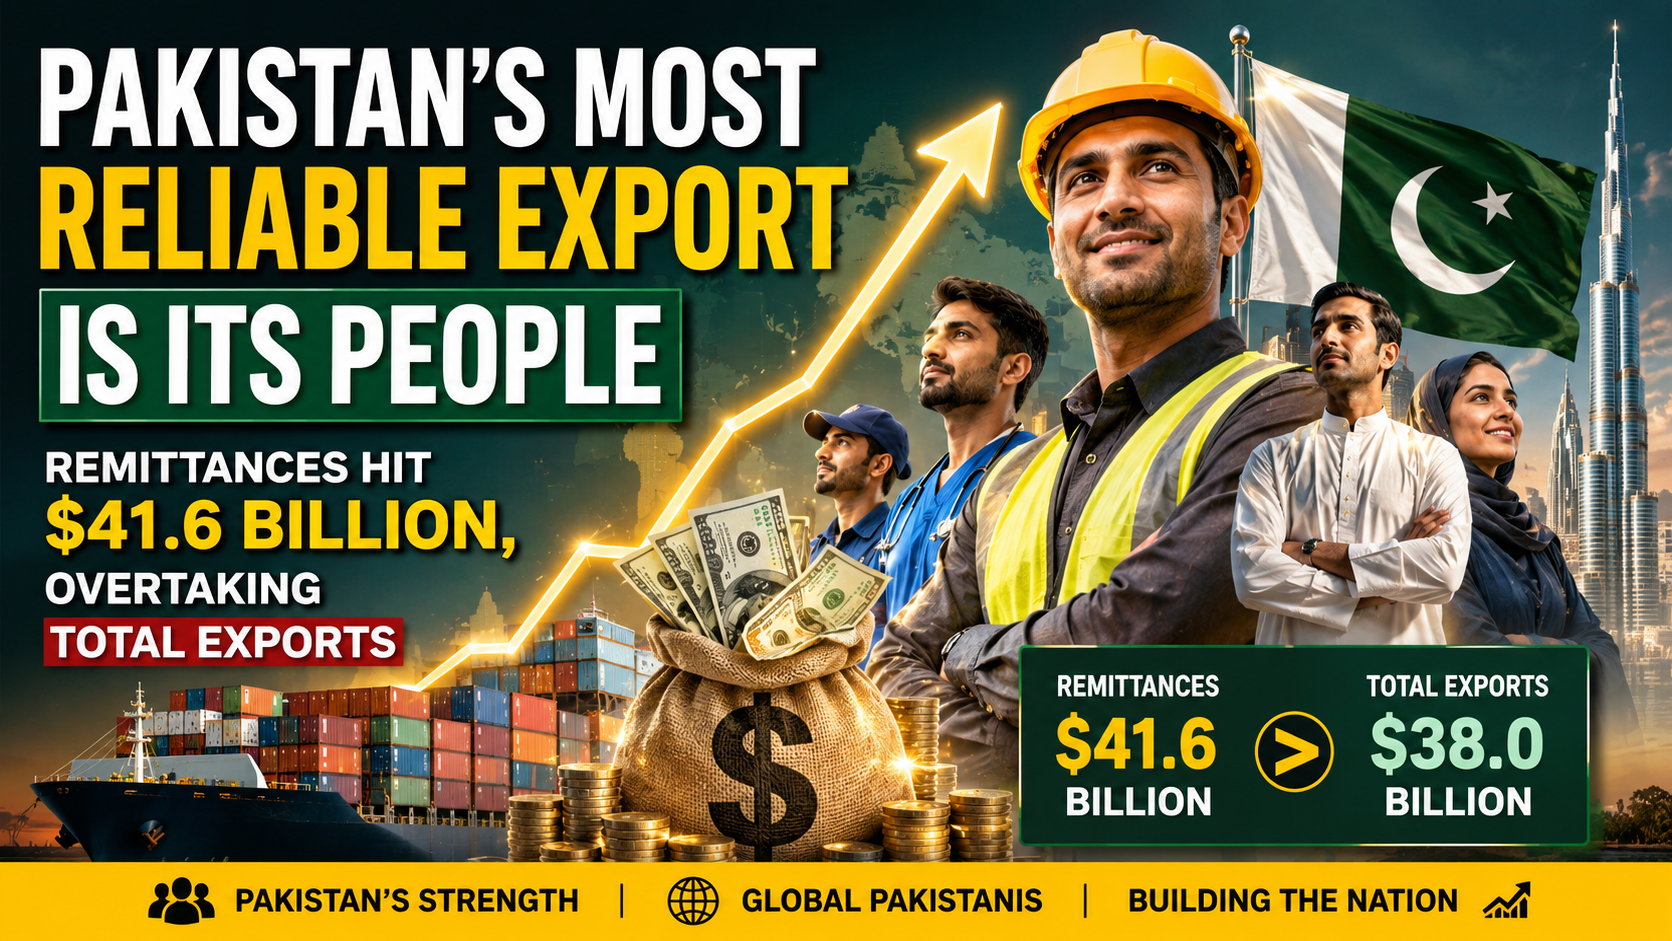
Pakistan’s Most Reliable Export Is Its People: Remittances Hit $41.6 Billion, Overtaking Total Exports
Introduction
For the first time in the country’s history, money sent home by Pakistan’s overseas workers has exceeded the value of everything Pakistan actually sells abroad. Remittances hit a record $41.6 billion in the fiscal year ending June 30, 2026, according to State Bank of Pakistan data — surpassing total merchandise exports for the same period and cementing a structural shift that economists are increasingly uneasy about (VOI World/State Bank of Pakistan).
The Numbers Behind the Milestone
Remittance inflows rose 8.6% year-on-year in FY26, up from $38.3 billion in FY25 (VOI World). Some reporting puts the full 11-month figure even higher at $38 billion before the final month was tallied, with May 2026 alone contributing $4.25 billion — an amount roughly equal to what the entire country spends on imports in a single month (Express Tribune). A separate Express Tribune report puts the full FY26 total even higher, at $41.58 billion, an increase of nearly $3.29 billion over the prior year, delivered “without structured educational, training or welfare support” for the overseas workforce generating it (Express Tribune — Remittances Without Structured Support).
Saudi Arabia remained the single largest source of remittances in June 2026 at $829.6 million, followed by the UAE ($792.3 million), the United Kingdom ($514.9 million) and the United States ($296.8 million), with Italy and Oman each contributing more than $100 million (VOI World). That geographic concentration matters: a substantial share of Pakistan’s remittance base originates from the Gulf, leaving the country’s external account exposed to labor market reforms, economic cycles and geopolitical developments concentrated in a single, currently volatile region (Business Recorder Editorial).
Exports Have Been Stuck for Years
The remittance surge stands in sharp contrast to Pakistan’s export performance, which has shown little sustained dynamism despite years of concessional financing, preferential tariff regimes and subsidized energy for exporters (Business Recorder Editorial). The textile sector — long considered the backbone of Pakistan’s export economy — has been stuck in a $15–18 billion annual range for years, even as a handful of forward-thinking textile groups have managed to grow exports and diversify product lines under the exact same operating conditions others cite as prohibitive (Express Tribune). Separately reported nine-month data for the fiscal year showed exports contracting 5.8% to $23.3 billion even as imports rose nearly 8% to $46.8 billion, widening the trade gap further (Minute Mirror).
Over the three fiscal years from 2023 to 2025, Pakistan received $95.8 billion in remittances compared with $91 billion in merchandise exports — a gap that reflects, according to Business Recorder analysis, a deliberate policy orientation that has effectively institutionalized remittances as the default tool for stabilizing the current account rather than addressing the underlying export weakness (Business Recorder Opinion).
The Dutch Disease Warning
Independent economists have begun explicitly framing this pattern as a precursor to Dutch disease — the phenomenon where a large, easy source of foreign currency inflow reduces the pressure and incentive to build a competitive tradeable export sector (Business Recorder Opinion). The policy dimension is not incidental: under IMF program conditions, a long-standing subsidy that had encouraged banks to actively mobilize remittance transfers was withdrawn in the 2026 Budget, contributing to a temporary slowdown in inflows during the early months of the fiscal year before the government released Rs30 billion from its contingency fund to help revive momentum (Business Recorder Opinion).
A Business Recorder editorial published in July 2026 was blunt about the implication: Pakistan’s overseas workers have effectively become the country’s “most reliable export,” with its own people functioning as its largest export commodity — a framing the editorial explicitly calls an unsustainable foundation for long-term development strategy (Business Recorder Editorial).
The Silver Linings
The remittance boom has provided genuine macroeconomic stabilization. Total liquid foreign reserves crossed $23.98 billion as of early July 2026, including $18.47 billion held by the State Bank of Pakistan itself, with the rupee holding relatively steady around Rs278 per dollar in the interbank market (Express Tribune — Remittances Without Structured Support). Inflation has also been easing, and large-scale manufacturing showed signs of recovery with 5.9% growth in earlier-reported data, while agricultural lending rose 14.4% during July–February, extending credit access to farmers (Minute Mirror). Separately, Pakistan has reportedly repaid roughly Rs4,722 billion in debt ahead of schedule and posted a historic milestone in IT sector exports, suggesting pockets of genuine structural improvement exist alongside the broader export stagnation (Radio Pakistan).
Why This Matters Beyond Pakistan
Pakistan’s experience is a useful case study for other remittance-dependent emerging economies navigating IMF program conditions. The core tension — using a reliable, low-effort capital inflow to paper over a harder structural problem in the tradeable goods sector — is not unique to Pakistan, but few economies illustrate the scale of the imbalance as starkly as a country where remittances now formally exceed total exports.
Key Takeaways
- Pakistan’s FY26 remittances hit a record $41.6 billion, surpassing total merchandise exports for the first time in the country’s history.
- Saudi Arabia and the UAE remain the largest single sources, concentrating external account risk in the Gulf region.
- Textile exports have been stuck between $15–18 billion annually for years despite sustained government support.
- Economists are increasingly framing the remittance-export imbalance as a Dutch disease risk rather than a stabilization success story.
- Reserves have strengthened to nearly $24 billion and the rupee has stabilized, but the underlying export competitiveness problem remains unresolved.
Sources: VOI World, Express Tribune — Remittances Dwarf Exports, Express Tribune — Remittances Without Structured Support, Business Recorder Opinion, Business Recorder Editorial, Minute Mirror, Radio Pakistan
Discover more from The Economy
Subscribe to get the latest posts sent to your email.
Markets & Finance
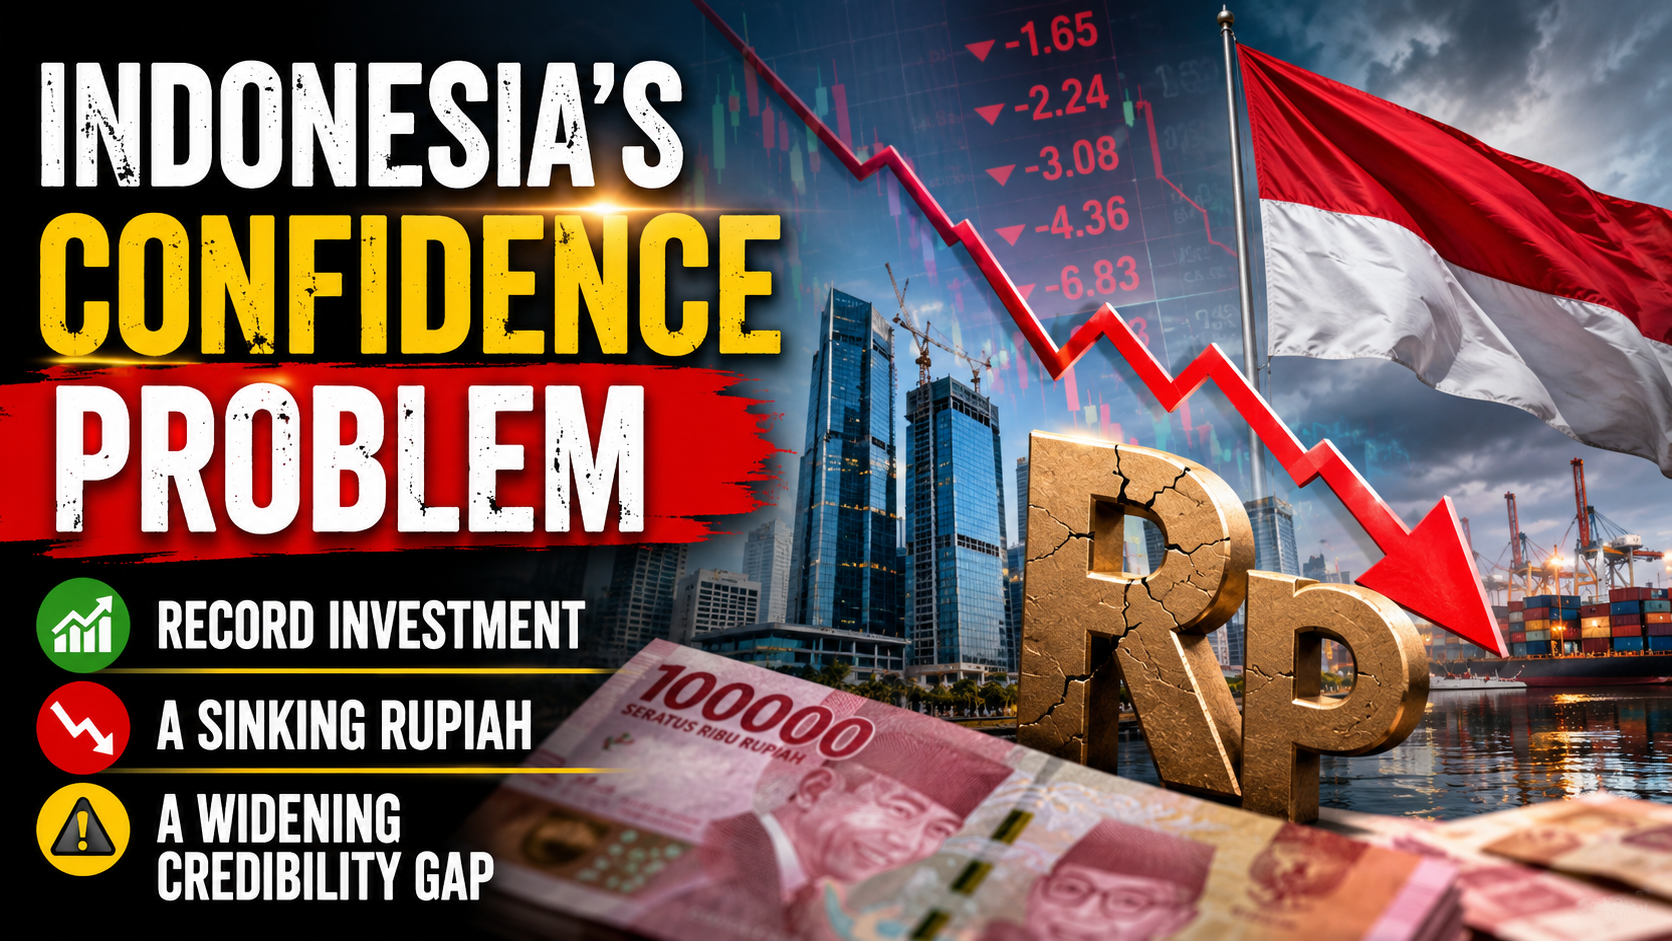
Indonesia’s Confidence Problem: Record Investment, a Sinking Rupiah, and a Widening Credibility Gap
Introduction
Indonesia’s economic story in mid-2026 is one of genuine contradiction. On one hand, the government posted a record Rp1,010.6 trillion ($56.1 billion) in realized investment for the first half of the year, up 7.2% from a year earlier and on pace to hit its full-year target (Antara News). On the other, the rupiah has been sliding toward Rp18,000 per US dollar, the state budget deficit has widened, and a growing chorus of domestic commentators is warning that Indonesia risks permanently losing what one Jakarta Post analysis called “the vital game of investor confidence” (The Jakarta Post).
The Investment Numbers Look Genuinely Strong
Indonesia’s Investment and Downstreaming Minister Rosan Roeslani reported that first-half 2026 investment realization reached 49.5% of the government’s full-year target of Rp2,041.3 trillion, creating 1.44 million jobs — a 15% increase in job creation compared to the first half of 2025 (Antara News). Domestic and foreign investment remained almost perfectly balanced, with foreign direct investment reaching Rp507.6 trillion (50.2% of the total) against Rp502.9 trillion in domestic investment (Antara News). Notably, investment outside the country’s most populous island, Java, exceeded inflows into Java itself for the first time in this dataset — Rp507.8 trillion versus Rp502.8 trillion — supporting the government’s long-standing goal of more balanced regional development (Antara News).
Singapore remained by far Indonesia’s largest source of foreign capital at $8.8 billion, followed by Hong Kong ($7.6 billion), China ($3.9 billion), Japan ($1.9 billion) and the United States ($1.7 billion) — together accounting for roughly 77.8% of all foreign direct investment into the country (Antara News). Second-quarter investment specifically rose 7.1% year-on-year to Rp511.8 trillion, with Minister Roeslani noting that investor commitment to Indonesia has held up despite significant “geopolitical and geoeconomic challenges” globally (The Jakarta Post).
But the Pace Is Slowing, and the Currency Is Under Pressure
Despite the record absolute figures, the Jakarta Post notes that investment growth in 2026 has been running at a distinctly slower pace than the country achieved in recent prior years, even as it remains on track to hit the annual target (The Jakarta Post). Meanwhile Bank Indonesia has had to actively respond to renewed rupiah weakness, attributing the currency’s slide toward Rp18,000 per dollar to hawkish signals from Federal Reserve officials and broader movements in the US dollar index (Samuel Sekuritas Daily Economic Insights). The state budget deficit reached Rp196.5 trillion in the first half of 2026, equivalent to 0.76% of GDP (Samuel Sekuritas Daily Economic Insights).
There has been some relief more recently: a 27.4% surge in second-quarter foreign direct investment helped strengthen the rupiah, with USD/IDR trading around 17,990 in mid-July as softer US inflation data reduced the odds of a near-term Fed hike (TMGM). Even so, the US dollar has retained broad support from escalating Middle East geopolitical tensions, keeping the rupiah’s recovery fragile rather than decisive (TMGM).
Why Growth Forecasts Keep Getting Trimmed
International lenders have grown more cautious about Indonesia’s growth trajectory for 2026. The OECD has held its outlook at 4.7% year-on-year — a clear deterioration from 2025’s realized 5.1% growth — with most major lending institutions clustering around the 5.0% threshold, implying a loss of momentum after Indonesia posted 5.61% growth in the first quarter of 2026 alone (Indonesia Investments). The deceleration is attributed to a softening labor market, weakening consumer confidence, and contracting retail sales in the second quarter (Indonesia Investments). High global oil prices are compounding the pressure on the government’s fiscal balance, since Indonesia continues to subsidize a significant portion of domestically sold fuel — a policy that transmits global energy volatility directly into the state budget rather than shielding consumers from it entirely (Indonesia Investments).
The Deeper Warning: A Confidence Problem, Not Just a Cyclical One
The most pointed recent critique comes from domestic commentary rather than foreign analysts. A Jakarta Post opinion piece published July 20, 2026 argues Indonesia must halt what it describes as erratic policymaking and institutional erosion before the country permanently damages its standing in the “vital game of investor confidence,” framing the rupiah’s weakness and shifting global market conditions as symptoms of a deeper credibility issue rather than purely external shocks (The Jakarta Post). That framing matters for how the strong headline investment numbers should be read: capital is still arriving, but the terms on which it arrives, and the confidence with which it stays, are visibly more fragile than the raw totals suggest.
Strategic Bright Spots
Not every recent development points toward strain. India secured access to Indonesian critical minerals through several major agreements signed during Prime Minister Narendra Modi’s visit to Jakarta, part of a broader push by Indonesia to leverage its resource base for deeper strategic partnerships (Samuel Sekuritas Daily Economic Insights). Indonesia is also pursuing energy independence through B50 biodiesel and compressed natural gas development, aimed explicitly at reducing reliance on imported LPG — a structural move that, if successful, would reduce exactly the kind of imported-energy vulnerability now straining the budget (Samuel Sekuritas Daily Economic Insights).
Key Takeaways
- Indonesia posted a record Rp1,010.6 trillion ($56.1 billion) in H1 2026 investment, up 7.2% year-on-year, with foreign and domestic capital nearly evenly split.
- The rupiah has weakened toward Rp18,000 per dollar on hawkish Fed signals, though a Q2 FDI surge has since provided partial relief.
- International lenders have trimmed Indonesia’s 2026 growth outlook to around 4.7–5.0%, down from 5.1% realized growth in 2025.
- The H1 2026 budget deficit reached 0.76% of GDP, pressured by continued fuel subsidies amid high global oil prices.
- Domestic commentary increasingly frames Indonesia’s challenge as a credibility and policymaking issue, not merely a cyclical external shock.
Sources: Antara News, The Jakarta Post — Investment Growth, The Jakarta Post — Confidence Game, Samuel Sekuritas Daily Economic Insights, Indonesia Investments, TMGM
Discover more from The Economy
Subscribe to get the latest posts sent to your email.
Introduction
The European Council formally extended its economic sanctions against Russia for another full year on 25 June 2026, keeping restrictive measures in place until 31 July 2027 (Council of the EU). More than four years into the war, the headline story of Russia’s economy has shifted from whether sanctions would work to a more nuanced question: how much longer can the Kremlin keep financing the war before the accumulated strain becomes impossible to hide behind favorable official statistics.
The Sanctions Architecture, Renewed Again
The EU’s economic measures against Russia, first introduced in 2014 and dramatically expanded after the February 2022 full-scale invasion, now span trade, finance, energy and dual-use technology restrictions, alongside asset freezes and travel bans on a broad range of individuals and entities (Council of the EU). Since February 2022, the EU has adopted 20 separate sanctions packages, and the European Council has explicitly stated it remains determined to keep weakening Russia’s war economy by further reducing its energy revenues, curbing shadow-fleet oil shipping operations and constraining its banking system (Council of the EU). Separately, on 3 July 2026 the EU sanctioned six individuals connected to the poisoning and death of opposition figure Alexei Navalny, underscoring that the sanctions regime continues to expand on human-rights grounds as well as economic ones (Council of the EU Sanctions Timeline).
The Headline Numbers Beijing-Style Optimism Can No Longer Explain Away
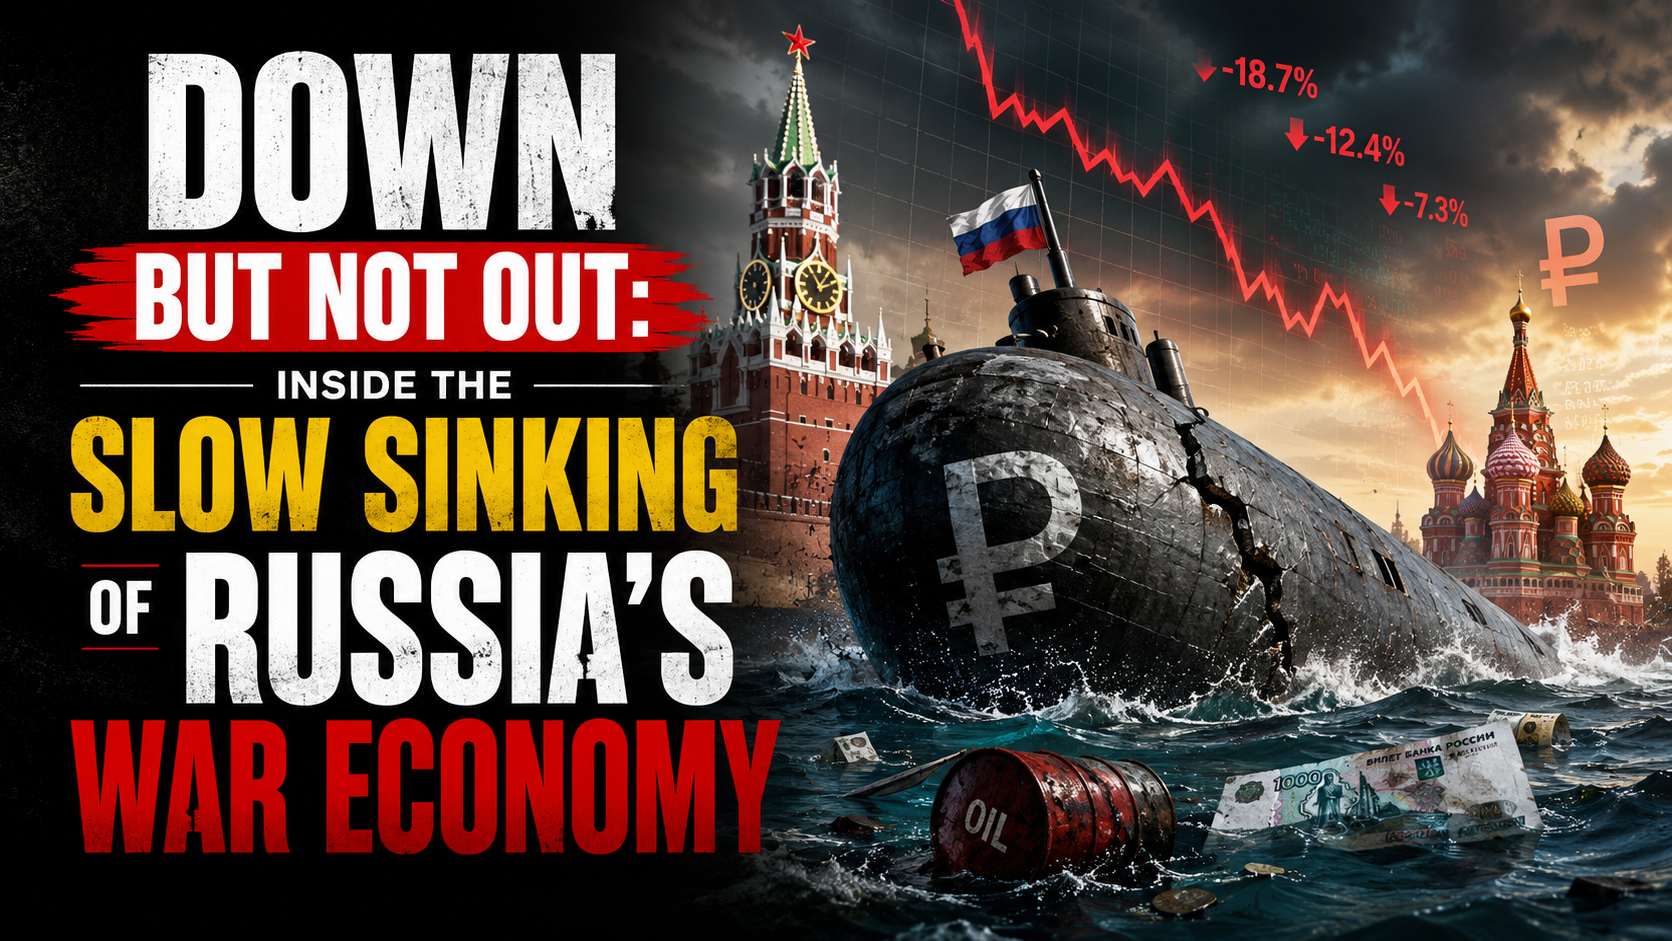
Russia’s GDP is now put at roughly $2.51 trillion, the world’s eleventh-largest economy — comparable in size to South Korea despite Russia’s vastly larger landmass and resource base — with 2026 growth projected at just 1.0% and inflation running at 5.2% (Statistics of the World). More pessimistic estimates put full-year 2026 growth even lower, at around 0.4%, which would be worse than 2025’s already-weak 1% expansion and would mark a sharp deceleration from the 4.1% growth Russia posted in 2023 as it forged new trading relationships to route around initial sanctions (Forbes).
Oil and gas revenues — historically around half of Russia’s state income — have fallen to roughly a quarter, a deliberate outcome of Western sanctions strategy that targets how much Russia earns from exports rather than blocking those exports outright (Stockholm School of Economics/SITE). Russia’s oil and gas budget revenues reportedly halved in January 2026 alone, with crude prices falling below $73 a barrel before the Middle East conflict briefly reversed the trend, sending Brent surging more than 55% to near $120 a barrel at its peak (Forbes).
The Middle East War: A Temporary Lifeline With Long-Term Costs
The spike in oil prices tied to the Iran conflict, combined with a period of eased US sanctions enforcement on Russian oil under President Trump, offered Moscow unexpected fiscal breathing room in mid-2026 (Forbes). But that same conflict has undermined Russia’s longer-term energy diversification ambitions in the region: two Russian-backed power plant projects in Iran have been put on hold, along with oil and gas exploration work and plans to build new transit routes linking Russia to India via Iran (Forbes).
The Gap Between Official Statistics and Underlying Reality
Perhaps the most important analytical point from recent research is not about any single data point but about the reliability of Russian statistics themselves. Torbjörn Becker of the Stockholm Institute of Transition Economics has argued the real test of sanctions is not whether they end the war overnight, but how much they erode the Kremlin’s capacity to finance it — and by that measure, the evidence points to deeper strain than headline GDP figures suggest (Stockholm School of Economics/SITE). Becker notes that Russia’s economy grew only modestly in 2022 despite oil prices rising sharply that year — a gap between expected and actual performance that implies a considerably larger hidden economic hit than the official contraction figures showed (Stockholm School of Economics/SITE). Compounding the problem, Russian authorities have stopped publishing several key statistics since 2022, making independent assessment of inflation, consumption and real economic conditions increasingly difficult — leading Becker to conclude that “statistics have become part of the narrative” rather than a neutral measure of economic reality (Stockholm School of Economics/SITE).
The Military-Civilian Economic Split
A recurring theme across recent analysis is the growing bifurcation between Russia’s overheating military-industrial sector and a stagnating civilian economy. This imbalance has pushed interest rates higher and forced the liquidation of a striking 71% of Russia’s gold reserves to help fund continued war spending (Forbes). Russia’s total fossil fuel export revenue is estimated at roughly €734 million per day, underscoring just how central hydrocarbon income remains to the entire war financing model even as that revenue stream shrinks (Forbes).
The Counter-Narrative: Wages Still Rising
It would be inaccurate to describe Russia’s economy as in freefall. CSIS research notes that Russian salaries rose 17.8% in nominal terms and 8.7% in real terms in 2024 compared to 2023, with disposable incomes up 6.1% in 2023 and 7.3% in 2024 — growth rates not seen in Russia in almost two decades (CSIS). Government budget projections still expect real salaries to rise, albeit at a decelerating pace: 7% in 2025, 5.7% in 2026 and 4.1% in 2027 — a marked slowdown from the 2024 peak but still roughly double the pre-invasion decade average (CSIS). This wage growth, driven substantially by wartime labor shortages and military-adjacent spending, is precisely the kind of headline-stabilizing data point that has allowed Putin to argue publicly that sanctions have failed to cripple his economy (Fortune) — even as think tanks describe the broader trajectory as pushing Russia toward what one report calls an “economic, political, and military abyss” (Fortune).
What Comes Next
Renewed legislative pressure in Washington — including the Sanctioning Russia Act introduced with strong bipartisan support — signals appetite in the US for tightening the screws further, even as the loss of a key congressional champion for that effort has complicated the political path forward (TIME). Whether the EU’s renewed sanctions regime, continued oil price pressure, and constrained reserves ultimately force a shift in Kremlin calculus toward negotiation remains the central open question for 2027.
Key Takeaways
- The EU has extended Russia sanctions for a further year, through 31 July 2027, continuing a regime built from 20 separate packages since 2022.
- Russia’s 2026 GDP growth is forecast between 0.4% and 1.0%, a sharp deceleration from 2023’s 4.1% post-shock rebound.
- Oil and gas revenue’s share of Russian state income has fallen from roughly half to about a quarter as Western sanctions target export earnings specifically.
- Russia has liquidated a large share of its gold reserves to sustain war financing amid a widening split between an overheating military sector and a stagnating civilian economy.
- Official Russian statistics likely understate the true economic strain, according to independent economists who cite a widening gap between reported and expected performance.
Sources: Council of the EU, Council of the EU Sanctions Timeline, Stockholm School of Economics/SITE, Forbes, Statistics of the World, CSIS, Fortune, TIME
Discover more from The Economy
Subscribe to get the latest posts sent to your email.

US Forced-Labour Tariffs on 60 Countries: The Hidden Trade Shock of 2026

Global Central Banks 2026: Fed, BoE and BoJ Decisions Could Reshape Markets

Gulf Capital Retreat From Pakistan 2026: UAE Loan Freeze & What It Means

Pakistan’s Most Reliable Export Is Its People: Remittances Hit $41.6 Billion, Overtaking Total Exports

Indonesia’s Confidence Problem: Record Investment, a Sinking Rupiah, and a Widening Credibility Gap

Down But Not Out: Inside the Slow Sinking of Russia’s War Economy

China’s Growth Slips to a Four-Year Low: Why Beijing Still Won’t Pull the Stimulus Trigger

The Johor-Singapore Corridor: How Malaysia Became Southeast Asia’s AI Infrastructure Powerhouse

Canada’s Economy ‘On Pause’: Inside the CUSMA Deadline That Passed Without a Deal

Dubai’s Millionaire Magnet: How the UAE Turned Middle East Turmoil Into a Capital Safe-Haven Boom

Britain’s Sixth Prime Minister in a Decade: What Starmer’s Exit Means for Gilts, Sterling and Your Portfolio

Anthropic Offers Up to $600,000 Salary for Critical IPO Role as AI Giant Prepares for Wall Street Debut

EU Readies Crisis Team for Potential China Rare Earths Stand-Off as Supply Chain Risks Mount

Singapore Weighs Hedge Fund Tax Cuts to Counter Hong Kong’s Growing Financial Challenge

Carry Trade Unwind 2026: How the Yen’s Snapback Triggered a Global Margin Call

AI Bubble Warning 2026: Why BIS, IMF and Bank of England Fear a Market Crash

BRICS De‑Dollarization Strategy Takes Shape with $15 Billion Local‑Currency Push

The AI Super Bubble Is Ready to Burst

Russia Bans Diesel Exports 2026: Global Fuel Market Impact Explained

Strait of Hormuz Blockade 2026: Oil Prices Surge 9% as US-Iran Conflict Reignites

Private Credit Warning: Most BDCs Turn Unprofitable in 2026, Reuters Finds

IMF Cuts Pakistan Growth Forecast, Raises Inflation to 8.4%

Bitcoin $150k Milestone Achieved as US Sovereign Crypto Pivot Looms
Gulf Capital Retreat From Pakistan 2026: UAE Loan Freeze & What It Means

India Economic Rise 2026: How the Subcontinent Toppled Japan

Strait of Hormuz 2026: Why Markets Still Don’t Trust It’s Open

Argentina Economy 2026: Milei’s Fiscal Surplus, Inflation Drop to 29%, and What Comes Next

China Housing Market Turnaround: White‑List Model Stabilises Prices
-

 Markets & Finance7 months ago
Top 15 Stocks for Investment in 2026 in PSX: Your Complete Guide to Pakistan’s Best Investment Opportunities
-

 Analysis5 months ago
Johor’s Investment Boom: The Hidden Costs Behind Malaysia’s Most Ambitious Economic Surge
-

 Analysis5 months ago
Top 10 Stocks for Investment in PSX for Quick Returns in 2026
-

 Analysis6 months ago
Brazil’s Rare Earth Race: US, EU, and China Compete for Critical Minerals as Tensions Rise
-

 Banks6 months ago
Best Investments in Pakistan 2026: Top 10 Low-Price Shares and Long-Term Picks for the PSX
-

 Investment7 months ago
Top 10 Mutual Fund Managers in Pakistan for Investment in 2026: A Comprehensive Guide for Optimal Returns
-

 Global Economy7 months ago
15 Most Lucrative Sectors for Investment in Pakistan: A 2025 Data-Driven Analysis
-

 Global Economy7 months ago
Pakistan’s Export Goldmine: 10 Game-Changing Markets Where Pakistani Businesses Are Winning Big in 2025