
Analysis
Kevin Warsh Takes the Fed’s Helm — and Walks Straight Into a Rate-Hike Storm

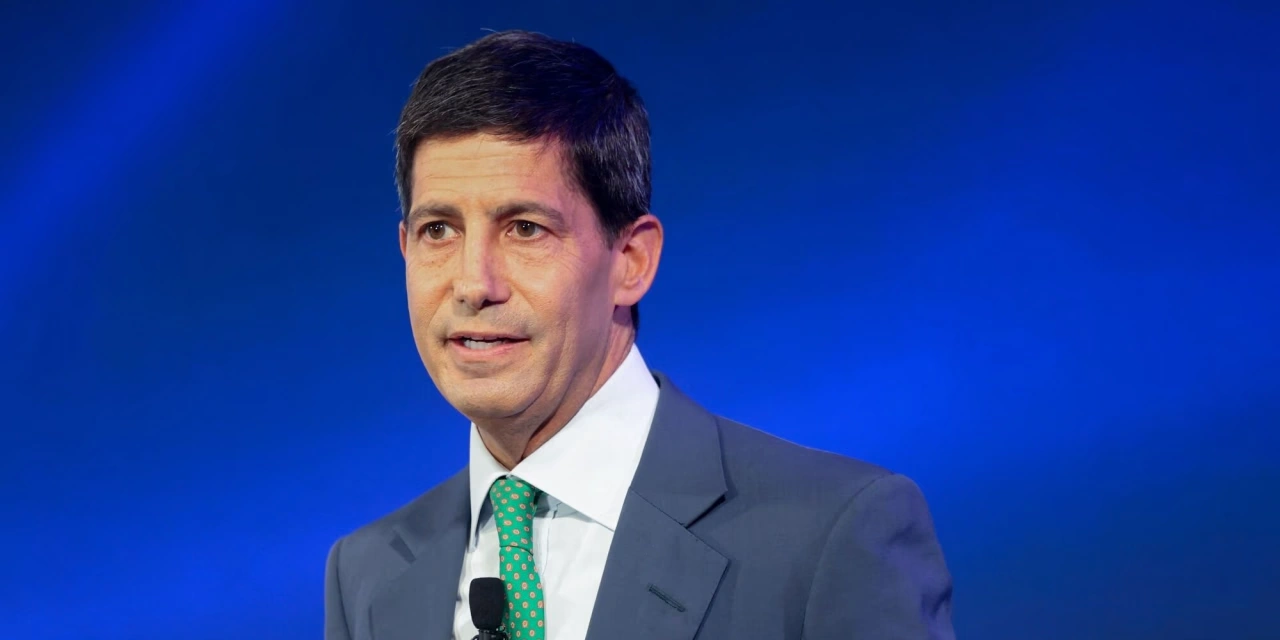
The swearing-in was choreographed for maximum symbolism. On Friday morning, May 22, 2026, Kevin Warsh stood in the East Room of the White House as Supreme Court Justice Clarence Thomas administered the oath that made him the 11th chair of the Federal Reserve in the modern banking era. Not since Alan Greenspan’s ceremony in 1987 had a Fed chair been sworn in at 1600 Pennsylvania Avenue. The setting said everything about what Donald Trump wanted from this appointment. What the bond market said back was rather different.
The Narrative That Broke on the Way to the Podium
For most of 2025 and into early 2026, Wall Street operated on a comfortable consensus: Warsh would replace Jerome Powell, ease financial conditions, and deliver the rate cuts a frustrated White House had been demanding for over a year. Investors debated whether the Fed would trim rates two or four times in 2026. The only real argument was about speed.
That consensus collapsed well before Warsh’s hand left the Bible.
April’s Consumer Price Index came in at 3.8% year over year — a three-year high, up from 3.3% in March and ahead of Wall Street’s forecast of 3.7%. The Producer Price Index for the same month showed wholesale prices rising 6.0% annually. Together, the two readings delivered a message bond markets processed without hesitation: the next move by the Kevin Warsh Federal Reserve might not be a cut at all. It might be a hike.
The Federal Reserve has held the benchmark federal funds rate at 3.5% to 3.75% since late 2025, itself a compromise position forged amid the competing pressures of an Iran war-driven oil shock, sticky services inflation, and a labour market that refused to crack. Oil surged above $115 per barrel at the height of the Middle East conflict, compressing the Fed’s already narrow room to manoeuvre. What had been a manageable inflation overshoot became something harder to dismiss.
1: The New Chair and the Inheritance He Didn’t Expect
Kevin Warsh, 56, arrives at the Marriner Eccles Building with an unusual duality on his résumé. During his confirmation hearing before the Senate Banking Committee on April 21, he positioned himself as a reformer — promising a “reform-oriented Federal Reserve,” tighter communication discipline, and an aggressive reduction of the central bank’s bloated balance sheet. He also argued, as recently as 2025, that advances in artificial intelligence would boost productivity, push down inflation, and create room for rate cuts. That was all before the Iran war changed the inflation arithmetic.
The Senate confirmed Warsh on May 13 in a 54-45 vote — the most divisive confirmation in Federal Reserve history — with Pennsylvania Democrat John Fetterman the only member of his party to cross the aisle. Jerome Powell, who served eight years and endured repeated personal criticism from Trump, will remain on the Fed’s Board of Governors until 2028.
What Warsh inherited was not a compliant committee. At the April FOMC meeting — Powell’s last as chair — four of the 12 voting members dissented against either the rate decision or the policy statement, the highest number of dissents since 1992. That kind of institutional fracture doesn’t resolve simply because someone new sits in the chair. Warsh will preside over his first FOMC meeting in June facing a committee that is, by historical standards, unusually fragmented.
And the data is moving against him fast. Monthly CPI has averaged 0.4% for each of the past six months. According to analysis by Bank of America Global Research and Bloomberg, if that pace continues, headline inflation could hit 5.2% by November’s midterm elections — even a moderation to 0.3% monthly would land at 4.4%, the highest since April 2023. Shelter inflation alone doubled in April. Energy costs, amplified by the Iran conflict, are pushing through supply chains and into consumer prices with a speed that earlier models underestimated.
Warsh said at his confirmation hearing that the Fed needs a different framework for assessing inflation — that the Personal Consumption Expenditures index “offers only a rough take, even when volatile food and energy prices are excluded.” That may be analytically defensible. It does not change the headline numbers that the bond market is reading every Thursday morning.
2: What Markets Are Actually Pricing — and Why It Matters
Will the Federal Reserve raise rates in 2026 under Kevin Warsh?
Based on current fed funds futures data, traders now assign a 57% probability to at least one rate hike by December 2026, according to the CME Group’s FedWatch tool. A December hike alone carries roughly 51% odds; the probability rises to 60% for January 2027 and above 70% for March 2027. Less than four weeks ago, traders assigned virtually no probability to hikes at all — they were debating the pace of cuts.
That repricing has been sharp and broad-based. The benchmark 10-year Treasury yield has climbed to hover around 4.67%. The 30-year yield topped 5.0% — its highest level since 2007. The 2-year yield, most sensitive to near-term Fed expectations, broke above 4% for the first time in 11 months, a signal that the market is pricing the policy rate staying elevated and potentially moving higher.
The picture is more complicated than a simple hawkish/dovish binary. Warsh enters with a genuine philosophical belief that the Fed’s balance sheet — still swollen from successive rounds of quantitative easing — is itself inflationary. His argument, developed in a 2025 op-ed and reiterated during confirmation, is that aggressive balance sheet reduction could allow rate cuts to happen sooner, because tightening financial conditions via asset sales would do some of the work currently done by the funds rate. J.P. Morgan strategists’ base case, as of mid-May, is that the Fed holds rates steady through the end of 2026, with the unemployment rate relatively stable and inflation still elevated.
Yet the FOMC hawks may not wait for Warsh’s balance sheet theory to play out. “The April CPI release underlines the challenge facing Warsh … and the distance the inflation data needs to travel back in favor of disinflation before the FOMC could consider reducing rates further,” Krishna Guha, head of economics and central banking strategy at Evercore ISI, wrote following the April data. “It also gives a little more ammo to the hawkish minority who think the next move is as likely to be up as down.”
That hawkish minority is no longer a fringe. The FOMC minutes from the April meeting, released on May 20, showed a growing number of policymakers warning that the central bank may need to raise rates if inflationary pressures don’t cool. The new chair may find himself chairing a committee more hawkish than he is.
3: The Second-Order Consequences
The implications extend well beyond the immediate question of whether rates rise 25 basis points in December. The repricing already underway carries real economic weight.
The 30-year Treasury yield at 5% has direct consequences for mortgage costs, which remain a pressure point for American households already stretched by five consecutive years of above-target inflation. A housing market that has been essentially frozen — high prices, elevated mortgage rates, minimal transaction volumes — would face further compression if long rates push higher still. Bank of America analysts, in early May, predicted the Fed will hold off on lowering rates until the second half of 2027. That forecast implies more than a year of no relief for variable-rate borrowers.
For corporate balance sheets, the impact is asymmetric. Companies that locked in cheap fixed-rate debt during 2020–2021 are insulated for now. But the refinancing wall looms: trillions of dollars of corporate bonds issued at sub-3% yields will mature over the next 18 months. If the funds rate stays at 3.5% to 3.75% — or rises above it — the rollover will crystallise at materially higher costs. Companies with pricing power and strong balance sheets will absorb this. Those without it won’t.
The political arithmetic matters too. Trump installed Warsh specifically to get lower rates ahead of the 2026 midterms. The irony is sharp: an incoming chair nominally aligned with the White House’s preferences may be driven by the data to do precisely the opposite of what the White House wanted. Monthly inflation at 0.4% is a number that prints in grocery store prices, energy bills, and insurance premiums — the kind of inflation voters feel viscerally and punish at the polls. A Fed that raises rates would slow the economy; a Fed that doesn’t and lets inflation accelerate would arguably hurt Trump’s midterm prospects more directly.
Warsh has already acknowledged a version of this bind. He told the Senate Banking Committee that the Fed “needs a different framework” — an admission, in diplomatic language, that the existing tools may not be well-calibrated to the current shock. Whether that means rate hikes, aggressive balance sheet reduction, or some novel combination is a question the first few FOMC meetings of his tenure will begin to answer.
4: The Case for Patience — and Why Some Analysts Aren’t Panicking
Not everyone agrees the Fed is headed for a rate-hike cycle.
The dissenting argument, made most forcefully by economists at Capital Economics, starts with the observation that much of the current inflation overshoot is energy-driven and therefore transitory in the precise sense the word implies: it will mean-revert when oil prices stabilise. The Iran conflict produced a spike to $115 per barrel; a ceasefire sent oil below $95 within hours. If the geopolitical shock fades, headline CPI could ease significantly by late 2026 without any policy action.
Stephen Brown, deputy chief North America economist at Capital Economics, described Warsh as “a relatively safe pick” for markets compared with other candidates who had been floated — precisely because his hawkish reputation on inflation would prevent a politically motivated easing cycle. That hawkishness, paradoxically, might allow him to hold steady rather than hike: credibility on inflation buys time that a dovish chair would not have.
There is also the growth argument. U.S. GDP has continued expanding at around 2% despite elevated rates, consumer spending has held firm, and S&P 500 corporate earnings have kept growing. A labour market that remains relatively resilient — neither accelerating nor cracking — removes some urgency from both cutting and hiking. Rate hikes require a clearer inflation-acceleration signal than the current data unambiguously provides.
The CME FedWatch probabilities themselves illustrate the uncertainty. Fifty-seven percent odds of a hike by December imply, equally, a 43% chance there is no hike. Markets are genuinely split. That is different from markets confidently pricing in a tightening cycle. Warsh has the institutional flexibility, if the inflation data cooperates even modestly, to hold and claim patience as strategy rather than paralysis. Whether that window stays open depends almost entirely on whether oil prices stabilise and whether April’s CPI reading proves a peak rather than a floor.
The Chair Who Arrived at the Wrong Moment
Warsh’s challenge is not primarily intellectual. He understands the policy trade-offs as well as anyone who has sat in the Eccles Building. His challenge is contextual: he was chosen to ease, installed to ease, and confirmed — narrowly — in a political environment that expected him to ease. The economy has not cooperated with that mandate.
The man who cited Alan Greenspan in his swearing-in remarks now faces a test Greenspan himself would recognise: the gap between what a new Fed chair promises and what the data demands. Greenspan learned in his first year that the economy sets the agenda, not the chair.
Bond markets figured that out on Friday. The rest of Washington is catching up.
Discover more from The Economy
Subscribe to get the latest posts sent to your email.



Key Takeaways
- Rolex’s secondary market rose approximately 7.9% year-over-year as of 2026 (per WatchCharts data) — trailing Patek Philippe (+16.2%) and Tudor (+11.4%) but still outperforming Audemars Piguet (+3.4%).
- Rolex raised U.S. retail prices 4–9% in January 2026 (steel models ~5.6%, gold models ~8.7%), narrowing the historical gap between retail and pre-owned pricing.
- Not every model appreciates: steel sports references (Submariner, GMT-Master II, Daytona) have held value far better than two-tone or widely available dress references like the standard Datejust.
- The Lady-Datejust posted the sharpest 2026 gain among tracked collections — up 22.73%, from roughly $9,269 to $11,376 — driven by demand for smaller, “everyday luxury” watches.
- Gold’s rise past $2,400/oz has directly lifted the investment case for Rolex’s precious-metal references (Day-Date, Sky-Dweller, Yacht-Master).
The Model-by-Model Picture
| Category | 2026 Trend |
|---|---|
| Lady-Datejust | +22.73% (strongest performer among tracked collections) |
| Steel sports models (Submariner, GMT-Master II) | Held value well; corrected from 2022 peak but stabilized above retail |
| Daytona | Corrected from highs above $50,000 to the mid-$30,000s; still among the most sought-after references |
| Two-tone/widely available Datejust | Flat to negative — “holds value” is an overstatement for this category |
| Gold references (Day-Date, Sky-Dweller) | Lifted by gold’s rise above $2,400/oz |
Why the “Rolex Always Appreciates” Myth Is Fading
The pandemic-era boom pushed some references — the Daytona above all — to speculative highs disconnected from historical norms. Since the March 2022 peak, steel sports models have compressed meaningfully, and dealers who bought inventory near the top have in some cases faced 20–40% markdowns on liquidation. The lesson for 2026 buyers: Rolex as a category is not a monolith. Value retention depends heavily on specific reference, condition, and whether the piece comes with box and papers (“full set”).
What’s Actually Driving 2026 Strength
- Retail price increases raise the floor. When a new Submariner retails at $10,050 (up from $9,500), a pre-owned example at $11,000–$12,000 suddenly represents a smaller premium — narrowing the gap without secondary prices actually moving.
- Supply discipline remains Rolex’s core lever. The brand has never confirmed production numbers, and secondary-market premiums remain entirely a function of Rolex’s own manufacturing decisions — a risk factor as much as a support.
- Certified Pre-Owned rollout. Rolex’s now fully rolled-out CPO program has changed how buyers transact in the used market, adding a layer of brand-verified legitimacy that supports pricing.
The Case for Rolex as a Portfolio Diversifier
Financial advisors increasingly frame luxury watches not as a replacement for equities or bonds, but as a tangible, historically low-correlation diversifier — one that carries its own risks (illiquidity, condition-dependent pricing, no yield) but has demonstrated multi-decade resilience for specific references.
Is Rolex a good investment in 2026?
It depends heavily on the specific reference. Steel sports models like the Submariner and Daytona have held or grown in value; two-tone and widely available dress models generally have not. Overall, Rolex’s secondary market rose about 7.9% year-over-year in 2026, trailing Patek Philippe but ahead of Audemars Piguet.
Discover more from The Economy
Subscribe to get the latest posts sent to your email.

Navigating Mortgage and Loan Refinancing in a High-Yield Environment
Global public debt crossing critical thresholds has kept central bank policies volatile, resulting in fluctuating US Treasury yields throughout 2026. For homeowners and commercial property holders burdened by previous high-interest borrowing cycles, finding optimal refinance windows has become a high-stakes financial puzzle. Stalled disinflation and stubborn employment numbers mean rate cuts are incremental, requiring borrowers to act with precision.
Timing your mortgage or commercial loan refinance in this environment requires a deep understanding of yield curve movements and lender risk appetites.
Decoding 2026 Refinance Dynamics
The 10-Year Treasury Yield Benchmark
Mortgage rates continue to track closely with the 10-year US Treasury yield. When macroeconomic anxiety spikes debt issuance, yields rise, tightening consumer borrowing capacity. Savvy borrowers monitor weekly Treasury auctions to lock in rates during brief dip windows.
Hybrid ARMs and Alternative Structures
With fixed rates remaining elevated, 7/1 and 10/1 adjustable-rate mortgages (ARMs) have surged in popularity. These products offer lower initial monthly payments, giving borrowers breathing room until central bank easing cycles fully materialize.
| Loan Product | Current Rate Range | Best For | Key Risk Factor |
| 30-Year Fixed Mortgage | 6.2% – 6.8% | Long-term predictability | Higher initial monthly outlay |
| 7/1 Hybrid ARM | 5.5% – 5.9% | Short-term ownership / flipping | Rate reset risk after year 7 |
| Commercial Refinance | 7.0% – 8.2% | Corporate asset restructuring | Strict DSCR lender covenants |
Actionable Steps for Successful Refinancing
To maximize your chances of securing favorable refinance terms in a volatile market, follow a disciplined preparation strategy.
Boost Your Credit Score Immediately: Lenders in 2026 are applying stringent credit tiering; a 20-point increase can drop your APR by a crucial quarter-point.
Shop Regional Credit Unions: Smaller financial institutions often offer portfolio loans with more flexible underwriting than major national banks.
Calculate the Break-Even Point: Ensure your total closing costs are recouped through monthly savings within 24 months of closing.
“Market Strategist View: Refinancing in 2026 is an exercise in opportunistic timing. Borrowers must maintain immaculate financial profiles ready to strike the moment Treasury yields dip.”
Mastering the complexities of today’s debt environment ensures you can successfully lower your debt service costs and protect your long-term financial stability.
Discover more from The Economy
Subscribe to get the latest posts sent to your email.

The days of pulling generic auto insurance quotes based purely on your zip code and age are officially over. In 2026, insurance comparison engines are powered entirely by generative AI and real-time telematics. These platforms digest thousands of live data points—ranging from your driving smoothness via connected vehicle sensors to real-time traffic congestion patterns—to generate hyper-personalized premiums instantly.
For consumers, this evolution represents both a massive opportunity for savings and a hidden trap for penalty pricing. Understanding how AI algorithms evaluate risk is essential for anyone looking to lower their monthly auto insurance premiums.
How AI Comparison Engines Evaluate Your Risk Profile
Behavioral Telematics and Connected Cars
Modern cars stream performance data directly to insurance aggregators. Generative AI models analyze braking sharpness, acceleration curves, cornering G-forces, and phone distraction metrics. Drivers who maintain smooth, defensive habits are rewarded with dynamic rate cuts of up to 40% compared to traditional rating tiers.
Predictive Traffic and Weather Modeling
AI tools now cross-reference your daily commute route with predictive weather and accident probability models. If your standard parking location or driving corridor has a statistically higher incidence of uninsured motorist claims, your quotes will reflect that hyper-local risk assessment.
| Comparison Factor | Traditional Rating Model | 2026 Generative AI Model | Impact on Premium |
| Mileage & Usage | Annual estimated odometer reading | GPS tracking & live trip duration | High (up to 35% savings) |
| Driving Behavior | MVR driving record & accidents | Real-time braking, speed, & G-force | Critical (determines tier) |
| Vehicle Tech | Make, model, and safety rating | ADAS calibration & repair cost data | Moderate |
Strategies to Lower Your AI-Driven Insurance Quote
To outsmart the algorithm and secure the lowest possible premium in 2026, drivers must proactively manage their digital footprint on insurance platforms.
Opt-In for Telematics Trial Periods: Many insurers offer immediate 15% discounts just for installing their driving app; let it track safe habits for 30 days to lock in permanent savings.
Scrub Unverified Public Records: Ensure your motor vehicle report is free of clerical errors that AI risk models misinterpret as reckless behavior.
Compare AI Aggregators: Use platforms that integrate multi-carrier API feeds rather than single-brand comparison sites to find the best risk-adjusted rate.
“Industry Note: AI-driven pricing rewards transparency and precision. Drivers who actively manage their telematics data consistently out-save those relying on legacy quote calculators.”
Embracing AI comparison tools allows savvy policyholders to customize coverage limits precisely to their driving habits, eliminating wasted premium spend while ensuring robust protection.
Discover more from The Economy
Subscribe to get the latest posts sent to your email.

Q3 2026 Earnings Preview: Can Record Profit Expectations Keep Wall Street’s Rally Alive?

Russia Diesel Deal 2026: Oil Prices and Inflation Risks

Fed Rates 2026: Treasury Yields, Bonds and SGOV Explained

S&P 500 Market Breadth 2026: Weak Rally or Rotation?

The AI Capex Boom: Data Centers Reshaping Growth

Palantir Stock in 2026: Extraordinary AI Growth

Tesla Physical AI 2026: Robotaxis, Optimus and TSLA Risks

NVIDIA’s AI Grip in 2026: Record Revenue Is Only Half the Investment Story

Hormuz Diesel Shortage: Why Crude Oil Recovery Isn’t Enough

Social Security Extra $90 Deposit: Who Qualifies for the October 2026 Medicare Rebate?

Anthropic Bans Sustained Abuse of Claude AI Under New Usage Policy Effective November 12, 2026

Jeff Bezos Three-Day Workweek View: What He Really Said

Celeste Frozen Pizza Discontinued: What Conagra Confirmed

US–China Critical Minerals Competition: Why a Trade Deal Cannot Fix Every Supply Risk

Oil Prices Break $100 in 2026: Middle East Conflict & Energy Markets

Middle East War Economics 2026: Oil Prices & Energy Markets

China Stocks Today: Are Big Economies in Asia Nearing a Market Bottom?

PSX Forecast 2026: KSE-100, IMF Reviews & Geopolitics

Crypto Daily Outlook: Bitcoin, Altcoins, and the Future of Decentralized Finance

Global Pension Systems Ranked: The World’s Best and Worst Retirement Frameworks

World’s Largest Economies: Ranking the Top Global Powers

Elon Musk’s Next Moves: Disrupting the 2026 Global Economy

Pakistan Economy 2026: Inside the SBP’s Balancing Act

GasBuddy Market Insights: How Crude Price Shifts Impact Local Fuel Cost Averages

World Bank & IMF Reports 2026: Why the “3% Growth” Consensus Is Actually a Debate

Global Equity Market Divergence: US Tech vs. European Dividend Stocks vs. Asian Growth

IMF & World Bank Global Economic Outlook: Growth Forecasts Across Europe and Asia

Stock Market Today: Dow Climbs 500 Points as Markets Shake Off Inflation Jitters
-

 Markets & Finance9 months ago
Top 15 Stocks for Investment in 2026 in PSX: Your Complete Guide to Pakistan’s Best Investment Opportunities
-

 Analysis8 months ago
Johor’s Investment Boom: The Hidden Costs Behind Malaysia’s Most Ambitious Economic Surge
-

 Analysis8 months ago
Top 10 Stocks for Investment in PSX for Quick Returns in 2026
-

 Banks9 months ago
Best Investments in Pakistan 2026: Top 10 Low-Price Shares and Long-Term Picks for the PSX
-

 Analysis8 months ago
Brazil’s Rare Earth Race: US, EU, and China Compete for Critical Minerals as Tensions Rise
-

 Investment9 months ago
Top 10 Mutual Fund Managers in Pakistan for Investment in 2026: A Comprehensive Guide for Optimal Returns
-

 Global Economy10 months ago
15 Most Lucrative Sectors for Investment in Pakistan: A 2025 Data-Driven Analysis
-

 Global Economy10 months ago
Pakistan’s Export Goldmine: 10 Game-Changing Markets Where Pakistani Businesses Are Winning Big in 2025