
Uncategorized
Hormuz Diesel Shortage: Why Crude Oil Recovery Isn’t Enough

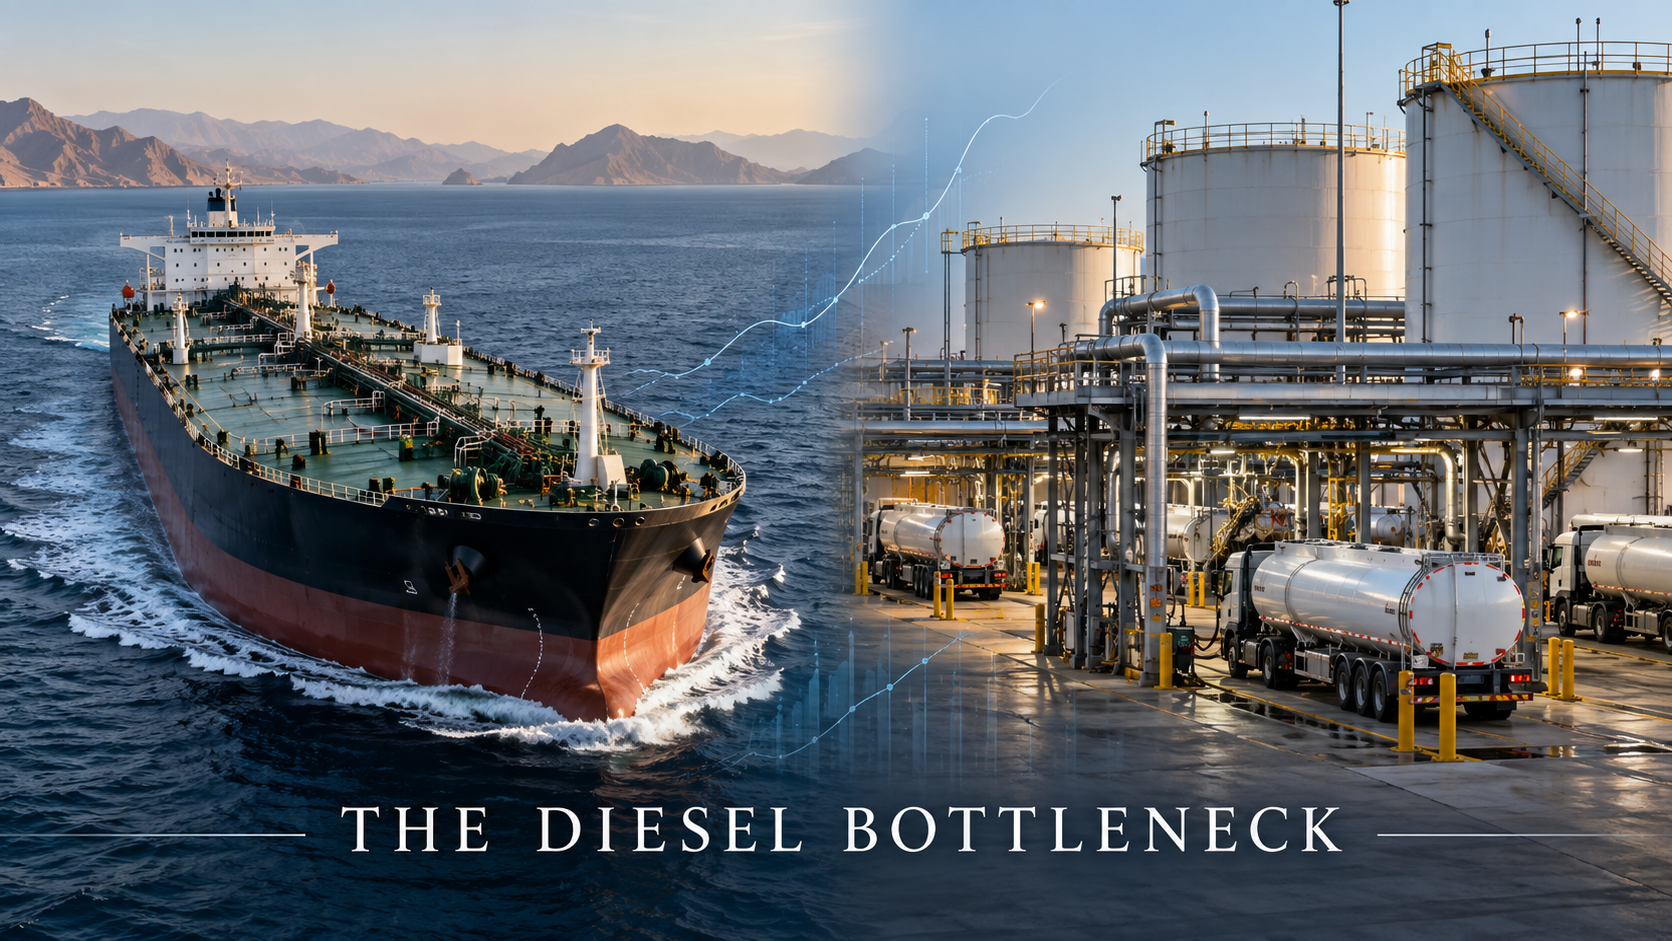
A recovery in crude oil exports from the Gulf does not automatically end a diesel shortage. That apparent contradiction is central to understanding the 2026 Strait of Hormuz energy crisis. Crude is a raw material; diesel is a finished product that must be refined, stored, transported and delivered through a more specific chain of infrastructure. Vessels carrying crude can adapt to a disrupted route while refineries, specialized product tankers or fuel-export terminals remain constrained. Recent Wall Street Journal reporting on the gap between crude and diesel shipments and the U.S. Energy Information Administration’s market analysis show why the difference matters.
Key takeaways:
- Crude oil and diesel are not interchangeable: supplying one does not instantly supply the other.
- Refineries, product tankers, storage and shipping risk can keep diesel scarce even when crude exports rebound.
- A higher diesel cost can affect trucking, agriculture, shipping, construction and food distribution.
- Reliable market analysis tracks crude volumes, refined-product volumes and delivered fuel costs separately.
The missing link between crude oil and diesel
An oil field produces crude. A refinery turns crude into a range of fuels and other materials, including diesel, gasoline, jet fuel and chemical feedstocks. The mix depends on refinery equipment, the kind of crude processed and commercial demand. Export terminals, ships and pipelines then move each finished product to customers.
If a crisis disrupts oil production and tankers, buyers may initially struggle to obtain crude. But if transport arrangements later improve while refineries have been damaged, shut down or constrained, more crude can reach a market without increasing diesel supplies in proportion.
Think of crude as wheat and diesel as bread. Delivering more wheat does not immediately solve a bakery shortage if ovens are broken, labor is unavailable or deliveries of finished loaves are blocked. The analogy is imperfect but captures the distinct production stages.
What the Hormuz data tell us—and what they don’t
The EIA’s energy chokepoint analysis provides a useful historical baseline. Estimated flows of all oil through Hormuz averaged 21.6 million barrels a day in Q4 2025, falling to 4.9 million barrels a day in Q2 2026. The table also separates the commodity types:
| EIA measure | Q4 2025 | Q2 2026 | Meaning |
|---|---|---|---|
| Crude oil and condensate | 15.9 million barrels/day | 3.7 million barrels/day | Raw petroleum and condensate shipments |
| Petroleum products | 5.7 million barrels/day | 1.1 million barrels/day | Refined and other petroleum-product shipments |
| Total oil | 21.6 million barrels/day | 4.9 million barrels/day | Blended oil flow estimate, subject to rounding |
These are quarterly EIA estimates, not October 10 live measurements. The table demonstrates that the crisis affects crude and products differently and that both experienced a steep earlier disruption. It cannot by itself prove how many barrels of diesel were shipped yesterday.
Recent reporting points to a subsequent partial rebound in some crude flows, even while commercial shipping remained under attack. On October 8, Reuters reported a renewed fall in vessel passages and changes in cargo movements. Lloyd’s List Intelligence described expensive workarounds supporting some export recovery.
Therefore, a reader needs to ask not merely whether “oil is flowing,” but which oil, in what form, through which route and at what cost.
Why diesel supply can lag behind crude supply
1. Refining capacity is a separate bottleneck
Crude must pass through refineries to become diesel. A refinery may be physically damaged, operating at reduced capacity, short of utilities or constrained by unavailable equipment. Even when crude arrives, production cannot resume instantly if the refinery is not ready.
The EIA’s July 2026 discussion of market disruption noted that interruptions in Middle East crude and product movements changed global sourcing patterns and helped increase refinery margins elsewhere. That is consistent with a market scrambling to replace missing finished fuel, not simply to find alternative crude.
2. Product tankers and terminals are not identical to crude tankers
Refined products have specific storage, cleanliness and segregation requirements. Moving gasoline, jet fuel and diesel may require different terminal access or cargo handling from very large crude carriers. A network reconfigured around crude exports may not bring the same immediate relief to diesel customers.
3. Trade routes cost more during conflict
Vessel owners may face higher insurance premiums, danger to crews, schedule uncertainty and longer journeys. Those costs can be passed along into delivered fuel prices, even if the underlying crude benchmark has stabilized. A fuel-importing country pays for a delivered product, not merely the price of a barrel posted on an international market terminal.
4. Fuel demand can be difficult to reduce quickly
Trucks, tractors, construction equipment, backup generators and some marine transport cannot instantly change their engines or supply chains when diesel becomes scarce. Short-term demand can therefore be relatively inflexible. Prices may rise while businesses struggle to economize without disrupting essential operations.
5. New supply has to travel a long way
Refineries outside the Gulf can increase exports where spare capacity exists, but additional fuel must still be transported. Longer routes tie up vessels and may require suitable loading and unloading capacity. These delays matter especially during a prolonged regional disruption.
Why pump prices don’t always follow crude oil prices
A pump price combines multiple influences: the crude feedstock, refining costs and margins, transport, storage, taxes, retail operating costs and local competition. At a time of refinery disruption, the refining component can rise independently of crude prices.
For example, if a benchmark crude price eases after a hopeful diplomatic announcement but diesel inventories remain tight, the pump price may decline slowly or not at all. The reverse is also possible: a new refinery supply source or a seasonal shift in demand could ease diesel prices even when crude is volatile.
There is also a timing effect. Retailers may be selling fuel procured at earlier wholesale prices, and product deliveries involve lead times. A single day’s crude-price change should not be mistaken for an immediate prediction about every pump or country.
Why the global economy cares about diesel
Diesel is a central input for moving goods. More expensive freight can raise costs for agriculture, manufacturing, construction and retailers. Food supply chains can face higher fuel bills between farms, warehouses and supermarkets. Logistics firms with fixed customer contracts may experience margin pressure before they can renegotiate rates.
That does not mean every retail price automatically rises by the same percentage as diesel. Final price effects depend on the fuel share of total costs, competition, contracts and how long the shock lasts. Economists should distinguish first-round energy costs from broader inflation pass-through.
For developing economies with heavy reliance on imported fuel, exchange rates and limited fiscal space can compound the challenge. Governments may respond with subsidy changes, strategic stocks or temporary tax measures, each with distributional and budget consequences. Such policies must be sourced country by country rather than assumed.
What would real recovery look like?
A credible recovery dashboard would include several measures:
| Indicator | Why it matters | Misreading to avoid |
|---|---|---|
| Crude exports | Shows flow of feedstock | Does not prove diesel is available |
| Refinery utilization | Shows ability to produce fuels | A refinery may run but produce a changing mix |
| Product export volumes | More direct indicator of diesel/gasoline flows | Must distinguish individual products |
| Product inventories | Shows buffer against temporary shortages | Stocks can lag reported shipments |
| Tanker freight and war-risk insurance | Measures delivery friction | A physically open route can still be costly |
| Diesel wholesale and retail spreads | Shows price pressure along the chain | Taxes and currency also affect local prices |
Tracking all six improves the quality of market explanations. A single Brent-price chart does not establish whether diesel supply has recovered.
Three possible paths ahead
Stabilization: Security improves, more routes become commercially viable, refineries return to normal operations and diesel supply gradually responds. Retail prices could ease, with a lag.
Uneven recovery: Crude volumes recover more quickly than finished fuel shipments. Diesel remains expensive even though some oil-market headlines turn more positive. This is the central risk highlighted by the current crisis.
Renewed escalation: More attacks, terminal damage, port closures or insurance restrictions interrupt both feedstocks and finished products. In that scenario, delivered fuel costs and supply uncertainty could intensify.
These are scenarios, not probability estimates or investment advice. Assigning numerical odds without a transparent model would be misleading.
Frequently asked questions
Why is diesel expensive when crude oil prices fall?
Refinery availability, finished-product inventories, transport and insurance costs can remain strained independently of crude-price movements.
Does the Strait of Hormuz carry diesel?
Yes. Petroleum products as well as crude and gas transit the route, as shown in EIA’s chokepoint analysis.
Can refineries outside the Middle East replace missing diesel?
Some can contribute extra supply when capacity and demand allow, but production, loading, vessels and voyage time limit how quickly shortages can be addressed.
Will a ceasefire immediately lower diesel prices?
Not necessarily. Security improvement may lower risk costs, but refineries, inventories and transport arrangements require time to normalize.
Are gasoline and jet fuel affected in the same way?
They share parts of the refining and shipping chain, but different supply-demand balances can lead to different price outcomes.
Does a lower tanker count mean less diesel for sure?
No. Vessel numbers alone do not tell you the cargo mix, shipment size, load factor or use of alternate routes.
What should transport businesses monitor?
Wholesale diesel prices, reliable supplier availability, inventory conditions, freight and insurance charges, and verified refinery and shipping updates.
Bottom line
The core lesson of the Hormuz crisis is that crude oil supply and finished fuel availability are separate parts of the same system. A headline about recovered barrels can be accurate and still fail to capture the diesel problem. For drivers, freight operators and policymakers, the relevant test is whether usable fuel is reaching the right markets at a sustainable delivered cost.
Discover more from The Economy
Subscribe to get the latest posts sent to your email.
Uncategorized
Oil Falls, Stocks Surge — But Analysts Warn Markets Are Pricing in Too Much Hormuz Optimism
Brent crude has fallen to $78 and gas prices dipped below $4 as the Strait of Hormuz reopens — but analysts warn markets are front-running a fragile peace. Here’s what investors and consumers need to know.
Introduction: Relief Rally or False Dawn?
After nearly four months of the most severe energy supply disruption in modern history, markets are celebrating. Gas prices have dipped below $4 a gallon in the United States. Brent crude has shed more than $17 per barrel in a matter of days. Stock indices are hovering near record highs. The Strait of Hormuz — the narrow waterway through which roughly 20% of the world’s oil flows — has begun welcoming ships again following the US-Iran peace agreement signed by President Trump on June 18, 2026.
But beneath the jubilation, a chorus of experienced analysts is sounding a cautionary note: markets may be pricing in the best-case scenario for a situation that remains deeply fragile.
The Numbers: How Fast Has the Market Moved?
The speed of the market reversal has been striking. According to data from Al Jazeera and Reuters:
- Brent crude stood at $78.24 per barrel as of June 17 — the lowest price since March 3, three days before the war began (Al Jazeera)
- Crude prices had surged more than 50% during the height of the conflict — briefly breaking $120 per barrel
- The current price represents a decline of over $17 per barrel in just four trading sessions
- Gas prices in the US have now fallen below $4 per gallon, down from highs that approached $5 during the spring
For context, prior to the war starting on February 28, 2026, Brent crude was trading at approximately $73–75 per barrel. The current price is only about 7% above pre-war levels — a remarkable compression considering the scale of the supply shock (Al Jazeera).
What Reopened — And What Hasn’t
On June 18, 2026, three Saudi-flagged supertankers became the first major commercial vessels to transit the Strait of Hormuz following the signing of the US-Iran Memorandum of Understanding (Reuters). The passage was met with immediate market relief.
However, the ground reality remains far more complicated than the price action suggests:
- Traffic through the strait remains a fraction of pre-war levels. The MoU requires Iran to end its near-total closure in exchange for the US lifting its blockade of Iranian ports — but this process will take weeks, not days (CNN Business)
- Marine insurance costs remain elevated. Insuring ships transiting a waterway that was at the center of active warfare just days ago remains prohibitively expensive for many operators
- Mines remain a concern. Questions about the removal of naval mines deployed during the conflict have not been fully resolved publicly
- The ceasefire is only 60 days long. The MoU outlines a 60-day negotiation window — after which the strait could potentially close again if talks break down (CNN Business)
- Iranian nuclear and missile disputes remain unresolved. As of June 24, Tehran has denied agreeing to nuclear inspections despite Trump’s public claims, leaving a major fault line in the peace framework
What Analysts Are Saying
The market is “front-running” a best-case outcome, according to multiple strategists:
“The market is front-running the prospective reopening of the Strait of Hormuz and likely pricing in the best-case scenario for the normalisation of flows, which means the potential hiccups from logistics to renewed geopolitical tensions are not being adequately factored in,” said Vandana Hari, founder of Vanda Insights (Al Jazeera).
Adam Turnquist, chief technical strategist at LPL Financial, was equally cautious:
“I do see pretty substantial risk that this doesn’t play out as optimistic as maybe some are pricing into the market. We’re walking a very fine line. The market right now, and especially oil, is assuming a lot of things go right.” (CNN Business)
Meanwhile, Tamas Varga of PVM Oil Associates acknowledged the momentum while noting its contingency:
“The immediate prognosis, it seems, is optimistic and assumes no significant setbacks. Over the last four trading sessions, Brent has fallen by $17 per barrel — a discernible vote of confidence that the worst, at least as far as supply disruptions are concerned, is behind us.” (Al Jazeera)
The Production Recovery Problem
Even if the Strait of Hormuz stays open, the oil market’s recovery faces significant structural headwinds. The IEA estimated the conflict removed approximately 10 million barrels per day of production from global supply at its peak — representing the largest supply disruption in the history of global oil markets (Wikipedia: 2026 Iran War Fuel Crisis).
Restoring that production is not a matter of flipping a switch:
- Oil infrastructure in Iran and across Gulf Cooperation Council states suffered war-related damage
- Qatar’s LNG liquefaction facilities — which declared force majeure during the conflict — will take weeks to restart
- Saudi Arabia and UAE will need time to ramp production back to pre-conflict levels
- Shipping logistics — tanker positioning, crew availability, port readiness — will require weeks of normalization
“Investors need to see traffic through the strait rise meaningfully in the coming weeks and months at a minimum to keep prices subdued. Even then, there are logistical challenges with bringing oil production across the Gulf region back online,” said Turnquist (CNN Business).
The Inflation Wildcard
For consumers and central banks, the oil market trajectory over the next 60 days will be critical. US CPI inflation hit 4.2% in May — a three-year high — driven substantially by energy prices. If the Hormuz reopening normalizes oil supply and brings gas back toward $3.50 or lower, the Fed’s inflation problem eases considerably and rate hike expectations could fade.
But if the peace framework stumbles — whether due to the nuclear inspection dispute, Iranian demands for transit fees, or renewed military tensions — oil prices could spike again rapidly, forcing the Fed’s hand toward a hike and prolonging the cost-of-living squeeze for American households.
The Retail Investor Dimension: Oil as the New Meme Trade
One underappreciated factor in current oil market dynamics is the participation of retail investors at an unprecedented scale. During the height of the crisis, net retail buying of oil ETFs hit a record $211 million in a single day on March 12 (CNBC).
“Oil is now definitely a retail ‘meme theme.’ Retail investors have been piling into the major pure-play oil ETFs ever since the start of the Iran conflict,” said Viraj Patel, global macro strategist at Vanda Research (CNBC).
As prices fall, many of these retail positions are underwater. A disorderly unwinding of these positions — combined with speculative short-selling on peace optimism — could amplify price volatility in both directions.
Key Risk Scenarios for Oil Markets
| Scenario | Brent Crude Outlook | Gas Price Impact |
|---|---|---|
| Full Hormuz normalization, peace holds | Fall to $70–73 | Below $3.50/gallon |
| Partial normalization, nuclear talks stall | Range-bound $75–85 | Stay near $3.80–4.20 |
| New military incident, strait re-closes | Spike to $100–110 | Return to $5.00+ |
| Prolonged logistics bottleneck | $80–90, slow decline | Gradual relief over months |
Frequently Asked Questions (FAQ)
Q: Has the Strait of Hormuz fully reopened?
Not yet. The first supertankers transited the strait on June 18, but traffic remains far below pre-war levels as of June 24, 2026. Full normalization is expected to take weeks or months.
Q: Why are oil prices falling so fast?
Markets are pricing in the best-case scenario for the US-Iran peace agreement — a full reopening of oil flows. However, analysts caution this optimism may be premature.
Q: Will gas prices continue to fall?
If the Hormuz reopening proceeds smoothly and Gulf production recovers, gas prices could fall further — potentially toward $3.50. But if the ceasefire breaks down, prices could reverse sharply.
Q: What is the current Brent crude price?
As of June 17–18, Brent crude stood at approximately $78.24 per barrel, its lowest level since just before the war began on February 28.
Q: What is the risk to the oil price rally?
Key risks include: failure to resolve the nuclear inspection dispute, Iranian demands for Hormuz transit fees, mines in the waterway, elevated shipping insurance costs, and the 60-day ceasefire expiration.
Discover more from The Economy
Subscribe to get the latest posts sent to your email.

What is China’s Ice Silk Road?
China’s “Ice Silk Road”—also known as the Polar Silk Road—is an ambitious extension of its Belt and Road Initiative into the Arctic, formally unveiled in Beijing’s 2018 Arctic Policy White Paper. It envisions a new maritime corridor linking China to Europe via the Northern Sea Route (NSR), capitalizing on melting ice to shorten shipping times and secure energy resources. Far from mere rhetoric, it reflects China’s self-proclaimed status as a “Near-Arctic State” and its drive to become a “Polar Great Power.”
Here are the key geopolitical implications emerging in 2026:
- Strategic bypass: The NSR offers an alternative to the vulnerable Malacca Strait, through which 80% of China’s energy imports flow.
- Deepening Russia ties: Over 90% of China’s Arctic investments target Russian projects, but this partnership strengthens Moscow’s leverage.
- Emerging tensions: Accelerated ice melt raises prospects for resource disputes and militarization, transforming the Arctic from a frozen barrier into a potential frontline.
- Western pushback: Setbacks in Greenland and elsewhere highlight security concerns from the U.S. and allies.
- Opportunities for balancers: Nations like South Korea could exploit subtle divergences between China, Russia, and North Korea to enhance regional stability.
Yet beneath the economic rhetoric lies a more profound shift. China’s Arctic push exploits climate change and opportunistic alliances to challenge Western maritime dominance, creating ripple effects for global security—from U.S. homeland defense to alliances in Asia.
Roots of Ambition: From Xi’s Vision to National Security Doctrine
The Ice Silk Road traces back to 2014, when President Xi Jinping, aboard the icebreaker Xuelong in Tasmania, declared China’s intent to evolve from a “Polar Big Power”—focused on quantitative expansion—to a qualitative “Polar Great Power.” This marked a pivot toward technological independence, governance influence, and maximized benefits.
By 2018, China’s first Arctic White Paper formalized the strategy, asserting rights under UNCLOS for navigation, research, and resource development while proposing to “jointly build” the Ice Silk Road with partners, primarily Russia. The 2021-2025 Five-Year Plan elevated polar regions as “strategic new frontiers,” tying them to maritime power goals.
Recent doctrine escalates this further. A 2025 national security white paper equates maritime interests with territorial sovereignty, implying potential justification for power projection in distant seas—including the Arctic. This evolution signals that Beijing views the far north not just as an economic opportunity, but as integral to core security.
Tangible Progress: Shipping Boom and Energy Stakes
China’s advances are most visible in the NSR’s rapid commercialization. Despite challenges, traffic has surged: in 2025, Chinese operators completed a record 14 container voyages, pushing transit cargo to new highs around 3.2 million tons across roughly 103 voyages.Reuters report on Chinese Arctic freight
Overall NSR activity reflects steep growth, with container volumes rising noticeably as Beijing accumulates expertise through state-owned COSCO and domestic shipbuilding.

Energy dominates investments. China has poured capital into Russian LNG projects like Yamal and Arctic LNG 2, undeterred by sanctions—receiving 22 shipments from sanctioned facilities in 2025 alone.Reuters on sanctioned Russian LNG to China Stakes in Gydan Peninsula developments and progress on onshore pipelines underscore this focus.
Scientific footholds, such as the China-Iceland Arctic Science Observatory, bolster presence, though Western analysts flag dual-use potential for surveillance.
Setbacks Amid Pushback: The Limits of Influence
Success has been uneven. Attempts to develop rare earths in Greenland faltered due to local elections and U.S.-Danish interventions, while airport bids and a proposed Finland-Norway railway collapsed amid security fears. These episodes reveal a geopolitical environment where economic overtures collide with alliance checks.CSIS analysis on Greenland and Arctic security
As ice recedes, non-Arctic actors like China face scrutiny, with coastal states prioritizing sovereign control.
Core Implications: Bypassing Chokepoints and Shifting Balances
The NSR’s strategic value shines in its potential to circumvent the Malacca dilemma—a “single point of failure” for China’s imports. Largely within Russia’s EEZ, it shields traffic from U.S. naval reach, provided Sino-Russian ties hold.Economist on Russia-China Arctic plans
This dependency cuts both ways: Russia gains leverage over route access. Emerging continental shelf claims, like those over the Lomonosov Ridge, foreshadow disputes, while melting enables permanent basing and submarine operations—altering force projection dynamics.Economist interactive on Arctic military threats
For the U.S., the Arctic shifts from natural barrier to vulnerable flank, demanding costly investments in icebreakers and defenses.Economist on U.S. icebreaker gap
Exploratory Risks: New Frontlines and Regional Dynamics
Three hypotheses illuminate 2026 risks.
First, climate change erodes U.S. strategic depth, elevating the Arctic to homeland priority as Russia and China probe nearer Alaska.NYT on Arctic threats NATO’s Arctic majority (excluding Russia) risks fault lines, yet Moscow’s wariness of Chinese encroachment—evident in restricted data sharing—limits full alignment.Carnegie on Sino-Russian Arctic limits
Second, China’s desired Tumen River outlet to the East Sea remains blocked by Russia and North Korea, preserving their ports and leverage. Joint infrastructure reinforces this check.
Third, U.S. “bifurcated” positioning—treating North Korea as a bolt against Chinese expansion—requires peninsular stability, pushing allies toward greater burden-sharing.
2026 Outlook: Stalled Pipelines and Heightened Vigilance
Early 2026 brings mixed signals. Power of Siberia 2 talks persist, with China holding pricing leverage amid alternatives; completion could take years.Carnegie on Russia-China gas deals NSR container traffic booms, but sanctions and ice variability temper euphoria.
Tensions simmer: Norway tightens Svalbard controls against Russian (and Chinese) influence, while Greenland’s resources draw renewed scrutiny.NYT on Svalbard Arctic control
For the West, urgency lies in coordinated deterrence—bolstering icebreaking, alliances, and governance—without provoking escalation. Allies like South Korea could preemptively stabilize by restoring ties with Russia and engaging North Korea, alleviating asymmetries that fuel bloc formation.Brookings on China Arctic ambitions
A Calculated Gambit in a Warming World
China’s Ice Silk Road is no fleeting venture; it’s a sophisticated play harnessing environmental upheaval and pragmatic partnerships to redraw global contours. In 2026, as routes open and stakes rise, the Arctic tests whether cooperation or competition prevails. The West cannot afford complacency—strategic adaptation, not isolation, offers the best counter. This melting frontier demands attention, lest it freeze old alliances into irrelevance.
References
Brookings Institution. (n.d.). China’s Arctic activities and ambitions. https://www.brookings.edu/events/chinas-arctic-activities-and-ambitions/
Carnegie Endowment for International Peace. (2025, February 18). The Arctic is testing the limits of the Sino-Russian partnership. https://carnegieendowment.org/russia-eurasia/politika/2025/02/russia-china-arctic-views?lang=en
Carnegie Endowment for International Peace. (2025, September 22). Why can’t Russia and China agree on the Power of Siberia 2 gas pipeline? https://carnegieendowment.org/russia-eurasia/politika/2025/09/russia-china-gas-deals?lang=en
Center for Strategic and International Studies. (2025). Greenland, rare earths, and Arctic security. https://www.csis.org/analysis/greenland-rare-earths-and-arctic-security
Jun, J. (2025, December 31). China’s ‘Ice Silk Road’ strategy and geopolitical implications. The East Asia Institute.
Reuters. (2025, October 14). Chinese freighter halves EU delivery time on maiden Arctic voyage to UK. https://www.reuters.com/sustainability/climate-energy/chinese-freighter-halves-eu-delivery-time-maiden-arctic-voyage-uk-2025-10-14/
Reuters. (2026, January 2). China receives 22 shipments of LNG from sanctioned Russian projects in 2025. https://www.reuters.com/business/energy/china-receives-22-shipments-lng-sanctioned-russian-projects-2025-2026-01-02/
The Economist. (2025, January 23). The Arctic: Climate change’s great economic opportunity. https://www.economist.com/finance-and-economics/2025/01/23/the-arctic-climate-changes-great-economic-opportunity
The Economist. (2025, October 2). How bad is America’s icebreaker gap with Russia? https://www.economist.com/europe/2025/10/02/how-bad-is-americas-icebreaker-gap-with-russia
The Economist. (2025, November 12). The Arctic will become more connected to the global economy. https://www.economist.com/the-world-ahead/2025/11/12/the-arctic-will-become-more-connected-to-the-global-economy
Discover more from The Economy
Subscribe to get the latest posts sent to your email.

Hormuz Diesel Shortage: Why Crude Oil Recovery Isn’t Enough

Social Security Extra $90 Deposit: Who Qualifies for the October 2026 Medicare Rebate?

Anthropic Bans Sustained Abuse of Claude AI Under New Usage Policy Effective November 12, 2026

Jeff Bezos Three-Day Workweek View: What He Really Said

Celeste Frozen Pizza Discontinued: What Conagra Confirmed

US–China Critical Minerals Competition: Why a Trade Deal Cannot Fix Every Supply Risk

Oil Price Outlook 2026: How Supply Risks Reach Fuel Bills, Inflation and Business Costs

AI in Business 2026: Why Faster Employees Do Not Automatically Mean Higher Profits

Mortgage Rates in 2026: Why They Remain High and How to Compare the True Cost

Gold Price Outlook 2026: The Forces Behind the Forecasts—and What Could Reverse Them

Global Economic Outlook 2026: Growth, Inflation and Risks

Trump–Putin Diesel Deal: Why Zelensky Is Angry and What It Means for Fuel Prices

Anthropic Draws the Line: Why Claude’s New Usage Policy Explicitly Bans ‘Cruel Behavior’ Toward AI

Ynon Kreiz & Mattel’s Digital Transformation: Franchise Strategy and Financial Growth

Oil Prices Break $100 in 2026: Middle East Conflict & Energy Markets

Middle East War Economics 2026: Oil Prices & Energy Markets

China Stocks Today: Are Big Economies in Asia Nearing a Market Bottom?

PSX Forecast 2026: KSE-100, IMF Reviews & Geopolitics

Crypto Daily Outlook: Bitcoin, Altcoins, and the Future of Decentralized Finance

Global Pension Systems Ranked: The World’s Best and Worst Retirement Frameworks

Enterprise AI Platforms Disrupting B2B SaaS in 2026: Full Analysis

World’s Largest Economies: Ranking the Top Global Powers

Elon Musk’s Next Moves: Disrupting the 2026 Global Economy

Pakistan Economy 2026: Inside the SBP’s Balancing Act

GasBuddy Market Insights: How Crude Price Shifts Impact Local Fuel Cost Averages

World Bank & IMF Reports 2026: Why the “3% Growth” Consensus Is Actually a Debate

Global Equity Market Divergence: US Tech vs. European Dividend Stocks vs. Asian Growth

Stock Market Today: Dow Climbs 500 Points as Markets Shake Off Inflation Jitters
-

 Markets & Finance9 months ago
Top 15 Stocks for Investment in 2026 in PSX: Your Complete Guide to Pakistan’s Best Investment Opportunities
-

 Analysis8 months ago
Johor’s Investment Boom: The Hidden Costs Behind Malaysia’s Most Ambitious Economic Surge
-

 Analysis8 months ago
Top 10 Stocks for Investment in PSX for Quick Returns in 2026
-

 Banks9 months ago
Best Investments in Pakistan 2026: Top 10 Low-Price Shares and Long-Term Picks for the PSX
-

 Analysis8 months ago
Brazil’s Rare Earth Race: US, EU, and China Compete for Critical Minerals as Tensions Rise
-

 Investment9 months ago
Top 10 Mutual Fund Managers in Pakistan for Investment in 2026: A Comprehensive Guide for Optimal Returns
-

 Global Economy10 months ago
15 Most Lucrative Sectors for Investment in Pakistan: A 2025 Data-Driven Analysis
-

 Global Economy10 months ago
Pakistan’s Export Goldmine: 10 Game-Changing Markets Where Pakistani Businesses Are Winning Big in 2025