
Analysis
Broadcom Market Value Loss: Revenue Forecast Disappoints


The technology sector’s AI-driven euphoria met a sobering structural reality check on Thursday as a sudden Broadcom market value loss wiped out more than $300 billion in market capitalization within hours of the opening bell. A softer-than-anticipated full-year revenue outlook blindsided institutional asset managers who had previously priced the silicon heavyweight for flawless execution. Chief Executive Hock Tan delivered the disappointing forecast during a late-evening earnings call, revealing that surging demand for custom artificial intelligence processors can no longer fully shield the enterprise from a persistent, deep drag in traditional corporate networking and broadband infrastructure. The resulting selloff marks one of the sharpest single-day valuation declines in semiconductor history, shaking investor confidence across the entire hardware ecosystem.
This abrupt market re-pricing takes place against a fragile macroeconomic backdrop where corporate technology spend faces intense institutional scrutiny. For eighteen months, mega-cap technology stocks rode a wave of generational optimism, lifting Broadcom into the exclusive club of trillion-dollar corporations. Yet, central banks’ higher-for-longer interest rate regimes have begun squeezing enterprise hardware refresh cycles. Data compiled by the Federal Reserve Bank of St. Louis indicates that industrial production for electronics and advanced communications components slowed by 3.2% over the last fiscal quarter. This macro drag means legacy sectors like telecommunications and storage networks are actively contracting.
Wall Street’s aggressive valuation models incorrectly assumed artificial intelligence infrastructure could completely break free from these broader economic gravity loops. The latest regulatory disclosures within Securities and Exchange Commission filings show that while AI infrastructure investments remain highly concentrated among four or five hyperscale cloud providers, the rest of the corporate economy is pulling back on capital deployment. The broader chip sector is finding that raw AI growth cannot instantly offset a structural downcycle across thousands of traditional enterprise buyers.
The Mechanics Behind the Broadcom Market Value Loss
The unprecedented Broadcom market value loss reflects deep structural anxiety over the company’s forward guidance, which fell short of institutional consensus models by nearly $800 million. While the company adjusted its annualized artificial intelligence revenue targets upward to $12 billion, the broader revenue forecast for its traditional semiconductor segments dropped significantly. Institutional desks immediately adjusted their portfolios, triggering a high-volume exit that pushed the stock down by 14.5% in early trading. As reported by Bloomberg Financial Markets, this single-session collapse wiped out gains accumulated over four months of aggressive institutional bidding, highlighting how thin the margin for error has become for premium-priced semiconductor equities.
The mechanics of the disappointment lie in the non-AI segments, which still account for more than 40% of Broadcom’s aggregate semiconductor revenue. Sales in the broadband unit plummeted by 39% year-over-year, while the enterprise networking division saw a 12% drop outside of cloud-scale custom switching infrastructure. According to analysis published by the Financial Times Markets Desk, corporate buyers are actively sweating existing hardware assets rather than purchasing next-generation silicon. This shift left Broadcom with elevated channel inventories that will take at least two quarters of reduced utilization to fully clear.
Segment Revenue Disparity
| Broadcom Operating Division | Year-over-Year Performance | Primary Demand Driver |
| Custom AI Processors (ASICs) | +240% Growth | Hyperscale Cloud Infrastructure |
| Enterprise Networking Fabric | +12% Growth | Data Center Switching Switching (Tomahawk 5) |
| Legacy Enterprise Hardware | -12% Decline | Corporate Server Farms / Campus Upgrades |
| Broadband Infrastructure | -39% Decline | Telecommunications Capital Freezes |
| Wireless RF Modules | Flat (0% change) | Consumer Smartphone Upgrade Cycles |
Chief Executive Hock Tan confirmed during the call that traditional telecommunications customers have frozen major capital projects. For instance, prominent carriers in North America and Western Europe reduced their broadband component orders by a combined 28% over the past six months. This structural freeze directly undermined the revenue stability that conservative pension funds relied upon when buying Broadcom as a defensive technology play.
The friction extends to Broadcom’s wireless division, which designs complex radio-frequency front-end modules for premium smartphones. In the current cyclical slowdown, consumer upgrade cycles have stretched out to an average of 38 months in major consumer markets. This consumer inertia has slowed shipment volumes for high-end devices, directly impacting the wireless component segment which saw flat revenue performance. While Broadcom maintains a multi-year supply agreement with major consumer hardware brands, the lack of volume growth has left the division unable to cushion the massive blow dealt by the broadband collapse.
The company’s software division also faced intense market scrutiny. The integration of VMware, acquired for $69 billion, has progressed through a controversial transition to subscription-only licensing models. While Tan defended the strategy, stating that annualized run-rate revenues reached $4.8 billion in the software segment, the pace of legacy customer churn was higher than internal forecasts anticipated. Institutional analysts from Reuters Technology Sector Reporting noted that small and mid-sized enterprises are actively migrating away from VMware to open-source alternatives, compounding the operational revenue drag.
Market Dynamics and the AI Chip Revenue Slowdown
The market’s violent reaction exposes a profound structural misunderstanding of the modern semiconductor supply chain. Investors treated Broadcom as a pure-play artificial intelligence proxy, grouping it with companies that design graphics processing units. Still, Broadcom’s operating model is fundamentally distinct. It relies on custom application-specific integrated circuits, known as ASICs, designed in partnership with custom cloud giants like Alphabet and Meta.
Is the AI chip market slowing down?
No, the AI chip market isn’t slowing down, but its growth is consolidating among fewer hyperscale buyers. Broadcom’s recent market corrections stem from a steep 39% decline in its traditional broadband and legacy enterprise networking segments, which overwhelmed its otherwise strong $12 billion custom AI processor revenue stream.
What follows, however, is a deeper valuation challenge. Custom silicon projects carry completely different margin profiles than standard merchant chips. When a hyperscaler contracts Broadcom to co-design an AI accelerator, the development cycles stretch over 18 to 24 months. The capital outlay is front-loaded, and the gross margins are structurally lower than those commanded by proprietary, off-the-shelf networking hardware. This operational reality was laid bare on September 4, when financial metrics showed a gross margin compression of 110 basis points in the semiconductor solution segment.
The operational dynamic becomes clearer when evaluating the engineering resource allocation required for custom ASICs. Unlike standard merchant products that can be sold to hundreds of different customers with minimal modification, custom processors demand dedicated teams of physical design engineers working exclusively for a single hyperscale client. This concentration of engineering talent creates an organizational bottleneck, limiting Broadcom’s capacity to scale its customer base beyond its existing tier-one cloud partnerships. If a single major cloud provider decides to alter its chip architecture or insource its design capabilities, Broadcom faces immediate, unhedged revenue concentration risks that are difficult to mitigate.
The picture is more complicated when examining the physical layers of data center architecture. Vertical scaling inside hyperscale systems means that while AI clusters require massive amounts of customized switching fabric, such as Broadcom’s Tomahawk 5 chips, these deployments require far fewer traditional routing nodes. The industry is witnessing an internal cannibalization of corporate capital expenditures. A dollar spent by a cloud vendor on an AI cluster is frequently a dollar stolen from standard corporate server farms. This systemic shift means Broadcom’s legacy merchant silicon lines are experiencing an accelerating rate of obsolescence that custom AI silicon sales cannot immediately replace. Institutional funds are realizing that the absolute addressable market for these custom processors is bounded by a tiny group of ultra-wealthy cloud operators, limiting the infinite scalability previously priced into the equity.
Cross-Industry Contagion and Hardware Rebalancing
The reverberations of Broadcom’s market shift extend far beyond its headquarters in San Jose, California. As the premier supplier of backplane infrastructure, the company acts as a leading economic bellwether for global technology supply chains. The immediate downstream consequence will likely manifest as a broader tactical repricing across the entire hardware ecosystem. Equipment suppliers, assembly partners, and silicon foundries must now recalibrate their production schedules to accommodate this deceleration in standard corporate hardware sales.
Data compiled by the Organization for Economic Co-operation and Development suggests that global corporate IT infrastructure spending will remain flat through the final quarters of the year. This reality will force enterprise networking vendors to engage in aggressive price competition to clear accumulated warehouse inventory. For corporate buyers and CIOs, this structural imbalance offers an unexpected negotiating advantage, as hardware costs for standard enterprise storage and routing platforms are projected to decline by up to 15% over the next nine months.
Still, for the broader equity markets, the development signals an ending to the indiscriminate technology rally. Index funds and exchange-traded funds heavily weighted toward advanced semiconductors are experiencing significant capital outflows. This capital migration suggests that institutional asset managers are rotating out of high-multiple hardware growth stories into cash-generative value sectors or enterprise software platforms.
Tier-two cloud service providers and regional data center operators are experiencing a distinct operational squeeze. Lacking the massive balance sheets of their trillion-dollar competitors, these secondary players cannot afford to build out massive AI networks while simultaneously maintaining their core enterprise hosting environments. As a result, they are deferring upgrades to their standard networking fabrics, directly impacting Broadcom’s high-margin merchant chip sales. This systemic freeze in tier-two demand creates an extended valley in the order book, forcing component distributors to write down inventory values and adjust forward orders.
For national policymakers focused on technological sovereignty, Broadcom’s financial friction provides a cautionary data point. Governments in Washington, Brussels, and Tokyo have poured hundreds of billions of dollars into domestic chip manufacturing initiatives. If the demand for semiconductor products remains bifurcated—booming in hyper-specific AI clusters but deeply depressed across standard industrial, automotive, and telecommunications applications—newly constructed fabrication facilities risk opening into an environment characterized by systemic overcapacity. The risk of underutilized chip factories could complicate public-private subsidy structures, forcing state planners to re-evaluate the timing of secondary funding rounds for domestic silicon infrastructure.
The Case for Long-Term Structural Realignment
A compelling counter-thesis exists among long-horizon value investors who view this market correction as an overreaction to transient cyclical adjustments. This perspective holds that evaluating Broadcom based on near-term legacy hardware declines fundamentally misreads the long-term value capture of the VMware transition and the inevitability of hybrid cloud architectures. The bearish outlook assumes that traditional enterprise networking spend is permanently lost, whereas history suggests it is merely deferred during periods of macroeconomic rebalancing.
According to a comprehensive macro sector analysis published by the Bank for International Settlements, corporate capital expenditure cuts during periods of high borrowing costs typically reverse within 12 to 18 months as corporate balance sheets adjust to the prevailing interest rate environment. When these enterprise refresh cycles eventually resume, Broadcom’s dominant market share in merchant switching silicon remains virtually unchallenged. The company’s proprietary intellectual property portfolio creates an incredibly high barrier to entry that prevents competitors from easily encroaching on its core territory.
What follows, however, is an argument that the VMware software strategy is operating exactly as designed. By shifting the acquired customer base toward high-margin, multi-year subscription bundles, Broadcom is building a predictable, recurring cash flow engine that will insulate the parent company from future semiconductor cycles. Analysts at the International Monetary Fund have noted that high-margin enterprise software investments often provide crucial stability to multinational technology groups during periods of volatile hardware demand. From this perspective, the current drop in valuation represents an ideal accumulation window for institutional capital looking to secure a premier technology asset at a significant discount.
The market’s punitive response to Broadcom’s financial outlook highlights the central tension defining the modern technology sector: the painful friction between speculative future narratives and immediate financial realities. Artificial intelligence is undeniably transforming the structural architecture of global computing, but it cannot instantly rewrite the foundational laws of corporate cash flow or eliminate the cyclical patterns that govern industrial hardware markets.
Broadcom remains a remarkably profitable enterprise with an unparalleled moat across both physical silicon and enterprise software layers. Still, its current market re-rating serves as a stark reminder that even the most sophisticated technological moats can be breached when short-term expectations decouple from macro realities. The challenge moving forward will be managing an enterprise that must fund tomorrow’s hyper-growth infrastructure using the proceeds of yesterday’s maturing cash cows. The era of blind capital allocation to any corporate balance sheet mentioning an AI strategy has officially drawn to a close, replaced by a cold, spreadsheet-driven calculation of real-world returns.
Discover more from The Economy
Subscribe to get the latest posts sent to your email.


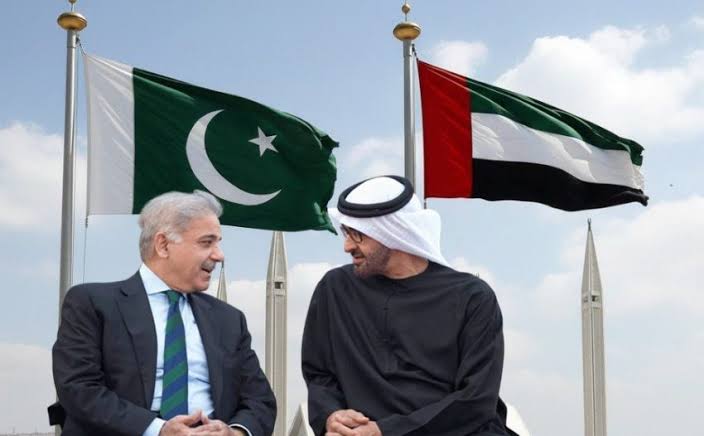
What happened: In early 2026, the United Arab Emirates declined to roll over a $3 billion loan to Pakistan — the first such refusal in seven years. The repayment equalled roughly 18% of Pakistan’s foreign currency reserves, arriving as Islamabad also faced a $1.3 billion bond payment and was waiting on the next IMF tranche.
Why it matters: It’s the clearest sign yet that Gulf sovereign patience with Pakistan’s balance-of-payments cycle is thinning, even as Gulf states simultaneously court China, Saudi Arabia, and each other for capital in a tightening regional liquidity environment.
The Story Nobody’s Connecting
Most coverage of Pakistan’s 2026 external account stress treats the UAE’s loan decision as an isolated liquidity event — a “routine financial transaction,” in the words of Pakistan’s own Ministry of Foreign Affairs. That framing misses the bigger pattern. The same weeks that Abu Dhabi called in its $3 billion, unusual delays began appearing in bank transfers from Saudi Arabia to the UAE itself — friction between the Gulf’s two largest economies, at a moment when both are also managing their own post-war oil price adjustment. (Pakistan & Gulf Economist)
Put those two data points together and a different story emerges: this isn’t just about Pakistan’s creditworthiness. It’s about Gulf capital becoming more selective, more transactional, and less willing to extend informal grace periods across the board — with Pakistan simply the most exposed borrower in the queue.
The Numbers Behind the Pressure
Pakistan’s State Bank held $16.4 billion in reserves as of late March 2026 — enough to cover roughly three months of imports, a threshold economists generally treat as a comfort floor, not a cushion. (Mettis Global News) The UAE’s declined rollover landed at the same time as a looming $1.3 billion international bond payment and dependence on the next $1.2 billion IMF disbursement — a convergence of obligations that left the State Bank with limited room to maneuver beyond import restrictions, rate hikes, or fresh commercial borrowing.
The backdrop matters too. The rupee had been trading in a comparatively narrow 278–282 band before the escalation of the Iran conflict pushed global oil prices higher, squeezing Pakistan’s import bill precisely when its Gulf safety net began to wobble. The KSE-100 benchmark, meanwhile, had already shed around 15% amid the broader pressure. (Mettis Global News)
This is not Pakistan’s first Gulf-dependency cycle. The IMF’s own record shows a now-familiar pattern: staff-level agreements reached in Dubai, UAE pledges of multibillion-dollar investment arriving alongside IMF tranches, and Gulf bridge financing used to stave off sovereign default in periods when reserves cover shrinks toward zero. (Business Standard) What’s different in 2026 is that the bridge itself is showing cracks.
Islamabad’s Official Line vs. the Structural Reality
Pakistan’s government has leaned into a “stability to sustainable growth” narrative around its FY2026–27 federal budget, with the finance minister framing the transition as export-driven rather than reserve-dependent. Business groups have broadly welcomed the budget, and the current account posted a $459 million surplus in May 2026, an improvement attributed to strong remittance inflows. (Business Recorder) The Monetary Policy Committee has held rates steady rather than reaching for emergency tightening, which is itself a signal that the central bank does not yet see the UAE episode as a systemic trigger.
But a current account surplus built substantially on remittances is different from one built on export competitiveness or durable FDI. Pakistan’s trade structure still leans heavily on a narrow set of partners: China supplies over a quarter of its imports and a meaningful share of its exports, the UAE is both a top export destination and its second-largest import source, and Gulf states collectively remain the primary channel for both remittances and emergency liquidity. (Wikipedia — Economy of Pakistan) That concentration is precisely what makes a single Gulf lender’s changed appetite so consequential.
Why the Oil Backdrop Compounds the Risk
None of this is happening in a vacuum. The IMF’s own July 2026 commentary noted that global oil markets “absorbed the war shock” from the Iran conflict, but cautioned that buffers — spare production capacity, strategic reserves, shipping insurance capacity — are running low. (IMF Blog) For an oil-importing, reserve-constrained economy like Pakistan, a second energy price shock without deeper buffers would land directly on the same reserves the UAE loan was meant to protect.
What to Watch Next
- Whether Saudi Arabia steps in as an alternative bridge lender, or whether the Riyadh–Abu Dhabi transfer friction signals a broader Gulf liquidity tightening that limits everyone’s appetite to backstop Pakistan.
- The pace and size of the next IMF tranche, and whether Fund conditionality shifts to demand deeper reserve buffers given the UAE precedent.
- Whether China increases its role as lender of last resort, deepening Pakistan’s dependency in exactly the direction Gulf financing was historically meant to offset.
Discover more from The Economy
Subscribe to get the latest posts sent to your email.
Introduction
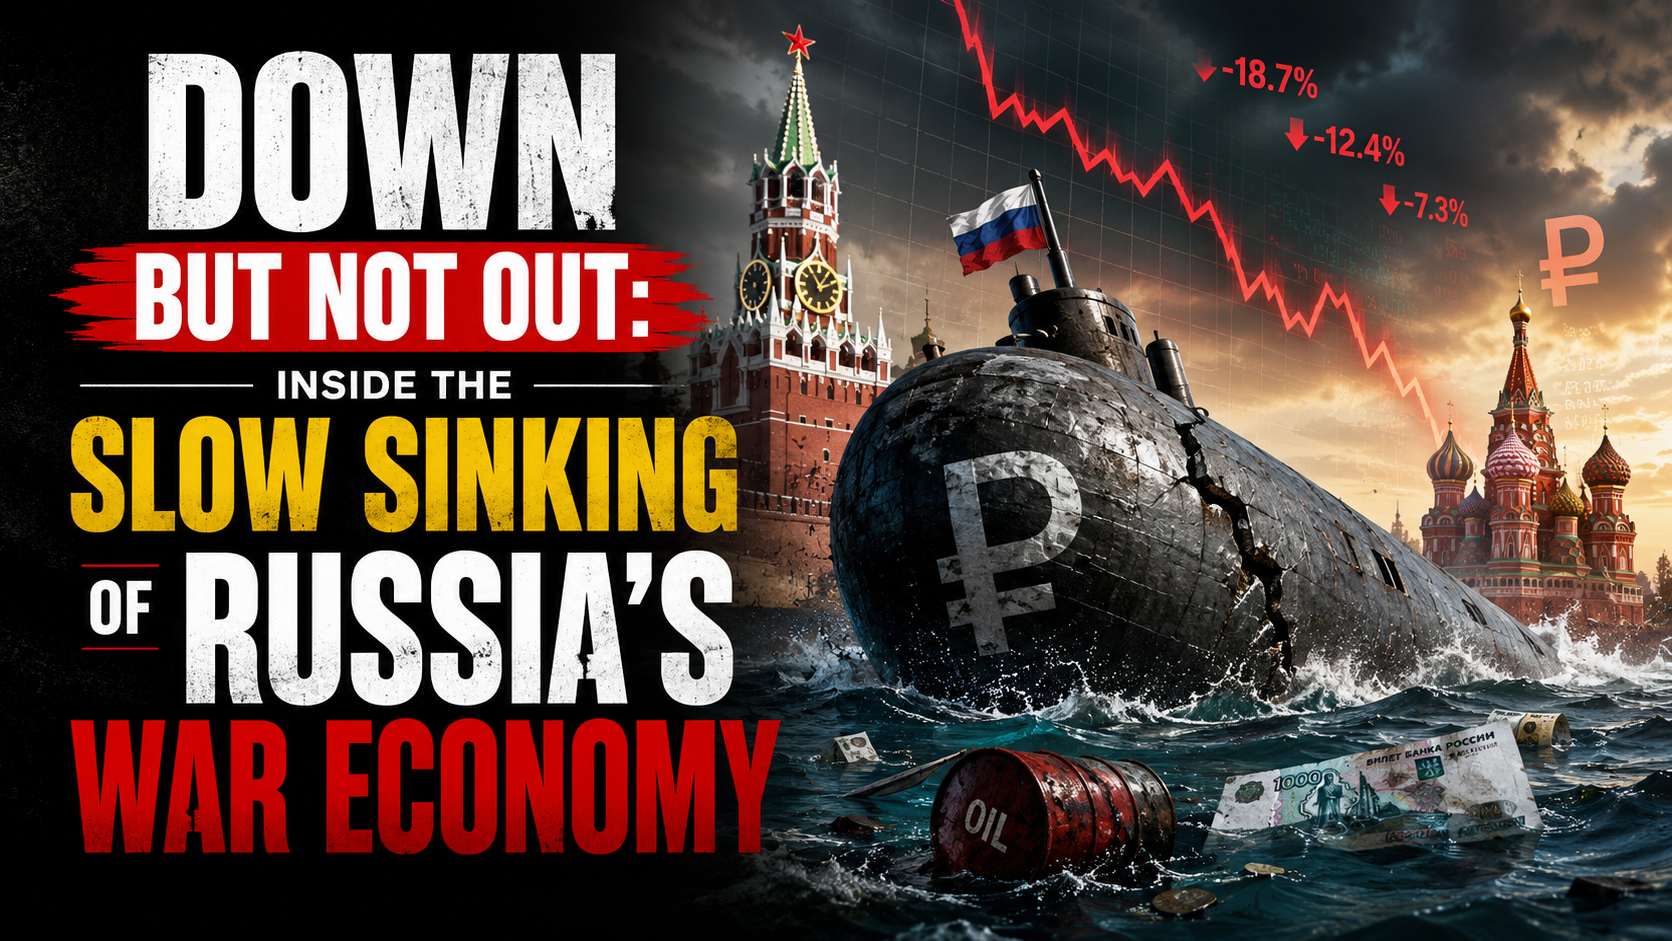
The European Council formally extended its economic sanctions against Russia for another full year on 25 June 2026, keeping restrictive measures in place until 31 July 2027 (Council of the EU). More than four years into the war, the headline story of Russia’s economy has shifted from whether sanctions would work to a more nuanced question: how much longer can the Kremlin keep financing the war before the accumulated strain becomes impossible to hide behind favorable official statistics.
The Sanctions Architecture, Renewed Again
The EU’s economic measures against Russia, first introduced in 2014 and dramatically expanded after the February 2022 full-scale invasion, now span trade, finance, energy and dual-use technology restrictions, alongside asset freezes and travel bans on a broad range of individuals and entities (Council of the EU). Since February 2022, the EU has adopted 20 separate sanctions packages, and the European Council has explicitly stated it remains determined to keep weakening Russia’s war economy by further reducing its energy revenues, curbing shadow-fleet oil shipping operations and constraining its banking system (Council of the EU). Separately, on 3 July 2026 the EU sanctioned six individuals connected to the poisoning and death of opposition figure Alexei Navalny, underscoring that the sanctions regime continues to expand on human-rights grounds as well as economic ones (Council of the EU Sanctions Timeline).
The Headline Numbers Beijing-Style Optimism Can No Longer Explain Away
Russia’s GDP is now put at roughly $2.51 trillion, the world’s eleventh-largest economy — comparable in size to South Korea despite Russia’s vastly larger landmass and resource base — with 2026 growth projected at just 1.0% and inflation running at 5.2% (Statistics of the World). More pessimistic estimates put full-year 2026 growth even lower, at around 0.4%, which would be worse than 2025’s already-weak 1% expansion and would mark a sharp deceleration from the 4.1% growth Russia posted in 2023 as it forged new trading relationships to route around initial sanctions (Forbes).
Oil and gas revenues — historically around half of Russia’s state income — have fallen to roughly a quarter, a deliberate outcome of Western sanctions strategy that targets how much Russia earns from exports rather than blocking those exports outright (Stockholm School of Economics/SITE). Russia’s oil and gas budget revenues reportedly halved in January 2026 alone, with crude prices falling below $73 a barrel before the Middle East conflict briefly reversed the trend, sending Brent surging more than 55% to near $120 a barrel at its peak (Forbes).
The Middle East War: A Temporary Lifeline With Long-Term Costs
The spike in oil prices tied to the Iran conflict, combined with a period of eased US sanctions enforcement on Russian oil under President Trump, offered Moscow unexpected fiscal breathing room in mid-2026 (Forbes). But that same conflict has undermined Russia’s longer-term energy diversification ambitions in the region: two Russian-backed power plant projects in Iran have been put on hold, along with oil and gas exploration work and plans to build new transit routes linking Russia to India via Iran (Forbes).
The Gap Between Official Statistics and Underlying Reality
Perhaps the most important analytical point from recent research is not about any single data point but about the reliability of Russian statistics themselves. Torbjörn Becker of the Stockholm Institute of Transition Economics has argued the real test of sanctions is not whether they end the war overnight, but how much they erode the Kremlin’s capacity to finance it — and by that measure, the evidence points to deeper strain than headline GDP figures suggest (Stockholm School of Economics/SITE). Becker notes that Russia’s economy grew only modestly in 2022 despite oil prices rising sharply that year — a gap between expected and actual performance that implies a considerably larger hidden economic hit than the official contraction figures showed (Stockholm School of Economics/SITE). Compounding the problem, Russian authorities have stopped publishing several key statistics since 2022, making independent assessment of inflation, consumption and real economic conditions increasingly difficult — leading Becker to conclude that “statistics have become part of the narrative” rather than a neutral measure of economic reality (Stockholm School of Economics/SITE).
The Military-Civilian Economic Split
A recurring theme across recent analysis is the growing bifurcation between Russia’s overheating military-industrial sector and a stagnating civilian economy. This imbalance has pushed interest rates higher and forced the liquidation of a striking 71% of Russia’s gold reserves to help fund continued war spending (Forbes). Russia’s total fossil fuel export revenue is estimated at roughly €734 million per day, underscoring just how central hydrocarbon income remains to the entire war financing model even as that revenue stream shrinks (Forbes).
The Counter-Narrative: Wages Still Rising
It would be inaccurate to describe Russia’s economy as in freefall. CSIS research notes that Russian salaries rose 17.8% in nominal terms and 8.7% in real terms in 2024 compared to 2023, with disposable incomes up 6.1% in 2023 and 7.3% in 2024 — growth rates not seen in Russia in almost two decades (CSIS). Government budget projections still expect real salaries to rise, albeit at a decelerating pace: 7% in 2025, 5.7% in 2026 and 4.1% in 2027 — a marked slowdown from the 2024 peak but still roughly double the pre-invasion decade average (CSIS). This wage growth, driven substantially by wartime labor shortages and military-adjacent spending, is precisely the kind of headline-stabilizing data point that has allowed Putin to argue publicly that sanctions have failed to cripple his economy (Fortune) — even as think tanks describe the broader trajectory as pushing Russia toward what one report calls an “economic, political, and military abyss” (Fortune).
What Comes Next
Renewed legislative pressure in Washington — including the Sanctioning Russia Act introduced with strong bipartisan support — signals appetite in the US for tightening the screws further, even as the loss of a key congressional champion for that effort has complicated the political path forward (TIME). Whether the EU’s renewed sanctions regime, continued oil price pressure, and constrained reserves ultimately force a shift in Kremlin calculus toward negotiation remains the central open question for 2027.
Key Takeaways
- The EU has extended Russia sanctions for a further year, through 31 July 2027, continuing a regime built from 20 separate packages since 2022.
- Russia’s 2026 GDP growth is forecast between 0.4% and 1.0%, a sharp deceleration from 2023’s 4.1% post-shock rebound.
- Oil and gas revenue’s share of Russian state income has fallen from roughly half to about a quarter as Western sanctions target export earnings specifically.
- Russia has liquidated a large share of its gold reserves to sustain war financing amid a widening split between an overheating military sector and a stagnating civilian economy.
- Official Russian statistics likely understate the true economic strain, according to independent economists who cite a widening gap between reported and expected performance.
Sources: Council of the EU, Council of the EU Sanctions Timeline, Stockholm School of Economics/SITE, Forbes, Statistics of the World, CSIS, Fortune, TIME
Discover more from The Economy
Subscribe to get the latest posts sent to your email.
Analysis
Dubai’s Millionaire Magnet: How the UAE Turned Middle East Turmoil Into a Capital Safe-Haven Boom

Introduction
While much of the commentary on the 2026 Middle East conflict has focused on oil tankers and the Strait of Hormuz, a quieter and arguably more consequential story has been unfolding in Dubai and Abu Dhabi: capital is flowing in, not out. The UAE attracted roughly 9,800 net new millionaires in 2025 — the highest net millionaire inflow of any country globally, according to Henley & Partners — and 2026 data suggests the pattern is holding even as regional tensions have periodically spiked (Tap Fiscal). For a global content audience trying to understand why a country geographically adjacent to an active conflict zone is functioning as a safe haven rather than a risk zone, the answer lies in three decades of deliberate institutional design.
The Headline Numbers
Dubai’s economy grew 2.4% in the first quarter of 2026 alone, with GDP reaching AED 232 billion, according to figures reported via the official WAM news agency (Gateway Group UAE Weekly Business News). The UAE Central Bank’s own outlook projects national economic growth of 5.6% for 2026, outpacing the broader GCC average, with the hydrocarbon sector expected to grow 7.3% on higher oil production even as non-oil sectors — financial services, manufacturing, trade, tourism and transport — continue to carry the bulk of long-term momentum (Xinhua). Non-oil activity now accounts for roughly 75% of GDP, a diversification level that insulates the economy from oil-price shocks far more than headlines about the region typically convey (Tap Fiscal).
Why S&P and the Central Bank Both Say the UAE Can Absorb the Shock
A dedicated S&P Global Ratings assessment concluded the UAE’s banking sector has shown strong resilience and financial soundness through the recent period of regional volatility, and the agency expects solid loan growth to continue into 2027, supported by ample system liquidity amid expected monetary easing (Gulf News). S&P separately reaffirmed the UAE’s sovereign credit rating at AA/A-1+ with a stable outlook, citing strong fiscal buffers and one of the world’s largest sovereign wealth portfolios (Xinhua).
The scale of that buffer is difficult to overstate. S&P estimates the UAE’s consolidated net asset position will reach roughly 184% of GDP in 2026, with government liquid assets calculated at approximately 210% of GDP (Gulf News). That firepower sits across a small number of globally diversified institutions — the Abu Dhabi Investment Authority, Mubadala Investment Company, ADQ, the Investment Corporation of Dubai, and the Emirates Investment Authority — which generate income well beyond the oil sector and give the state fiscal flexibility that few conflict-adjacent economies possess (Gulf News).
The UAE Central Bank’s own Q1 2026 review points to the same conclusion from the market side: the Dubai Financial Market’s share price index rose 22.9% year-on-year in the fourth quarter of 2025, the Abu Dhabi Securities Market General Index gained 6.6%, and credit default swap spreads for both Abu Dhabi and Dubai narrowed further — a signal of sustained investor confidence rather than flight (Central Bank of the UAE Quarterly Economic Review).
The Short-Term Noise Was Real — But It Didn’t Stick
None of this means the conflict has been costless. In the early days of escalation, some expatriates left the UAE, private jet charter prices to exit Dubai briefly spiked to as much as $250,000, and hotel occupancy dipped alongside disrupted aviation routes (Tap Fiscal). But the institutional and long-term investor data tell a different story than the panic-driven headlines: the Dubai International Financial Centre has resumed normal operations and remains home to nearly 9,000 active firms spanning wealth management, banking and capital markets (Tap Fiscal). A UAE government minister framed the resilience explicitly, describing the economy as structurally sound and built over decades to adapt to crisis rather than be destabilized by it (Tap Fiscal).
What’s Driving the Millionaire Inflow Specifically
High-net-worth migration to the UAE is not a new phenomenon, but 2025’s record net inflow suggests the safe-haven thesis is strengthening rather than fading. The pattern is consistent with what analysts describe as a flight to stable, low-tax jurisdictions with strong rule of law during periods of global uncertainty (Tap Fiscal) — a category the UAE has spent two decades positioning itself to fit, through free zones, golden visa programs, and a deliberately diversified, sovereign-wealth-anchored economy that does not rise or fall with a single sector or a single regional headline.
Risks Worth Watching
- Banking system exposure to regional escalation: while S&P’s baseline case is resilience, further escalation involving direct disruption to Gulf shipping lanes or energy infrastructure would test the “limited and short-term” impact assumption analysts currently hold (Xinhua).
- Real estate cooling: separate reporting on new vehicle and property registrations suggests parts of the UAE’s consumer economy are cooling from exceptional prior-year growth rates, even if not contracting (Arabian Business).
- Global AI valuation correction spillover: as with other major financial centers, UAE sovereign funds carry meaningful exposure to global equity markets, including AI-related names that regulators elsewhere have flagged as a concentration risk.
Key Takeaways
- The UAE recorded the world’s highest net millionaire inflow in 2025 and Dubai’s economy grew 2.4% in Q1 2026 despite regional conflict.
- Sovereign wealth institutions (ADIA, Mubadala, ADQ, ICD) give the UAE a net asset position near 184% of GDP, its core buffer against geopolitical shocks.
- S&P has reaffirmed a stable AA/A-1+ sovereign rating, citing fiscal buffers and banking sector resilience.
- Early-conflict disruption (jet charter spikes, occupancy dips) proved short-lived; DIFC activity and equity indices have both strengthened.
- Non-oil GDP diversification, now at roughly 75%, is the structural reason the UAE decouples from pure oil-price and conflict-headline risk.
Sources: S&P/Gulf News UAE Resilience Analysis, Xinhua/UAE Central Bank, Tap Fiscal UAE Economic Outlook 2026, Central Bank of the UAE Quarterly Economic Review, March 2026, Gateway Group UAE Weekly Business News, Arabian Business
Discover more from The Economy
Subscribe to get the latest posts sent to your email.

Gulf Capital Retreat From Pakistan 2026: UAE Loan Freeze & What It Means

Pakistan’s Most Reliable Export Is Its People: Remittances Hit $41.6 Billion, Overtaking Total Exports

Indonesia’s Confidence Problem: Record Investment, a Sinking Rupiah, and a Widening Credibility Gap

Down But Not Out: Inside the Slow Sinking of Russia’s War Economy

China’s Growth Slips to a Four-Year Low: Why Beijing Still Won’t Pull the Stimulus Trigger

The Johor-Singapore Corridor: How Malaysia Became Southeast Asia’s AI Infrastructure Powerhouse

Canada’s Economy ‘On Pause’: Inside the CUSMA Deadline That Passed Without a Deal

Dubai’s Millionaire Magnet: How the UAE Turned Middle East Turmoil Into a Capital Safe-Haven Boom

Britain’s Sixth Prime Minister in a Decade: What Starmer’s Exit Means for Gilts, Sterling and Your Portfolio

Anthropic Offers Up to $600,000 Salary for Critical IPO Role as AI Giant Prepares for Wall Street Debut

EU Readies Crisis Team for Potential China Rare Earths Stand-Off as Supply Chain Risks Mount

Singapore Weighs Hedge Fund Tax Cuts to Counter Hong Kong’s Growing Financial Challenge

Facebook and Instagram Experience Global Outage

Inside the $1 Billion Tap-to-Pay Fraud Rings Targeting Banks and Retailers

Carry Trade Unwind 2026: How the Yen’s Snapback Triggered a Global Margin Call

AI Bubble Warning 2026: Why BIS, IMF and Bank of England Fear a Market Crash

BRICS De‑Dollarization Strategy Takes Shape with $15 Billion Local‑Currency Push

Male Labor Force Participation Rate 2026: Why Men Are Leaving & Economic Impact

Russia Bans Diesel Exports 2026: Global Fuel Market Impact Explained

The AI Super Bubble Is Ready to Burst

Strait of Hormuz Blockade 2026: Oil Prices Surge 9% as US-Iran Conflict Reignites

IMF Cuts Pakistan Growth Forecast, Raises Inflation to 8.4%

Private Credit Warning: Most BDCs Turn Unprofitable in 2026, Reuters Finds
Gulf Capital Retreat From Pakistan 2026: UAE Loan Freeze & What It Means

Bitcoin $150k Milestone Achieved as US Sovereign Crypto Pivot Looms

India Economic Rise 2026: How the Subcontinent Toppled Japan

Strait of Hormuz 2026: Why Markets Still Don’t Trust It’s Open

China Housing Market Turnaround: White‑List Model Stabilises Prices
-

 Markets & Finance7 months ago
Top 15 Stocks for Investment in 2026 in PSX: Your Complete Guide to Pakistan’s Best Investment Opportunities
-

 Analysis5 months ago
Johor’s Investment Boom: The Hidden Costs Behind Malaysia’s Most Ambitious Economic Surge
-

 Analysis5 months ago
Top 10 Stocks for Investment in PSX for Quick Returns in 2026
-

 Analysis6 months ago
Brazil’s Rare Earth Race: US, EU, and China Compete for Critical Minerals as Tensions Rise
-

 Banks6 months ago
Best Investments in Pakistan 2026: Top 10 Low-Price Shares and Long-Term Picks for the PSX
-

 Investment7 months ago
Top 10 Mutual Fund Managers in Pakistan for Investment in 2026: A Comprehensive Guide for Optimal Returns
-

 Global Economy7 months ago
15 Most Lucrative Sectors for Investment in Pakistan: A 2025 Data-Driven Analysis
-

 Global Economy7 months ago
Pakistan’s Export Goldmine: 10 Game-Changing Markets Where Pakistani Businesses Are Winning Big in 2025