
Analysis
UK Labour Productivity: Are We Finally Seeing a Rebound?

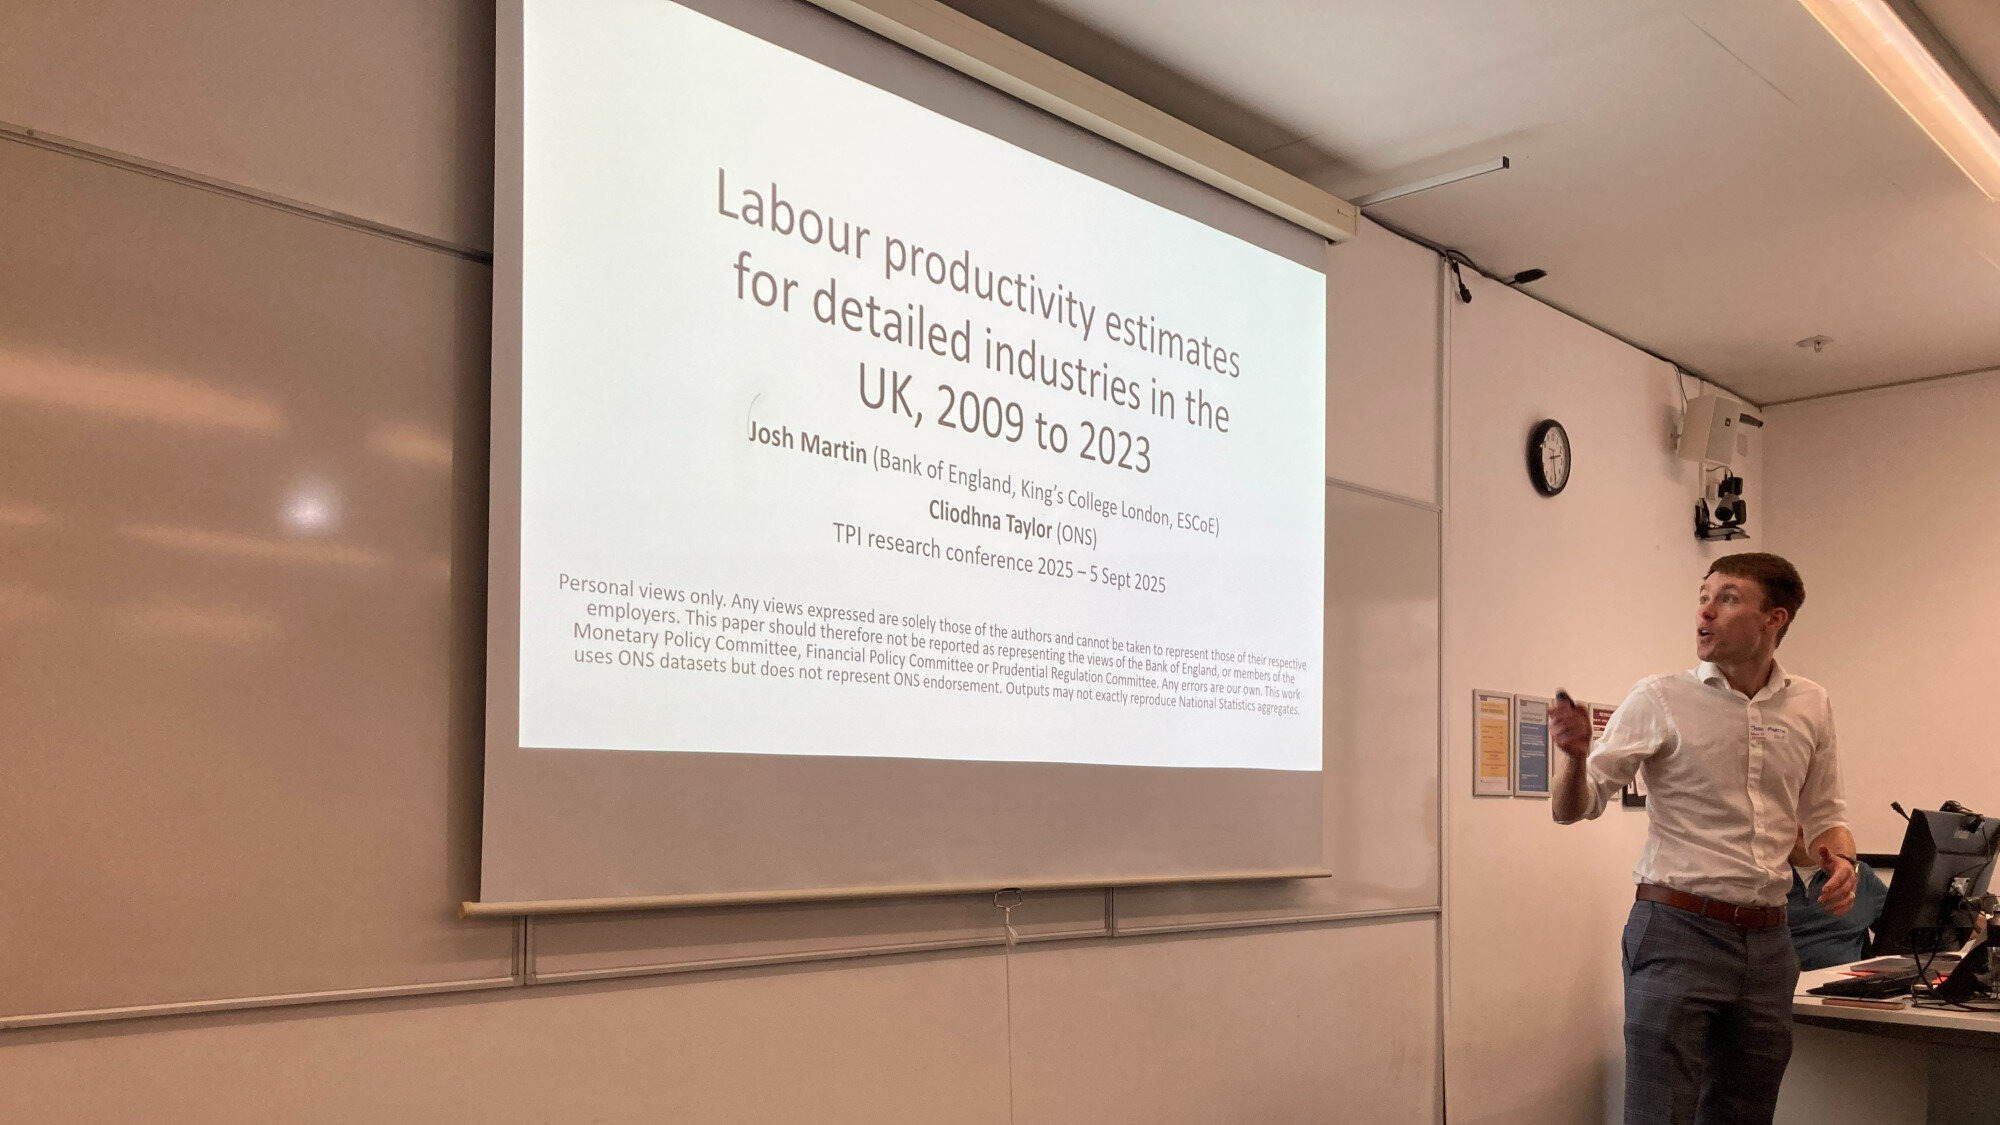
For fifteen years, the defining feature of the British economy has been its sluggishness. Since the financial crash of 2008, the sheer inability to extract more economic value from every hour worked has baffled successive Chancellors, thwarted real wage growth, and starved the Treasury of critical tax receipts. It became the dismal science’s favourite domestic mystery. Yet, a quiet shift is beginning to register on the macroeconomic dashboard. After years of false dawns, UK labour productivity is finally displaying faint but distinct signs of life. The question is whether this is a genuine structural shift or simply a temporary statistical illusion masking deeper economic decay.
To understand the magnitude of this potential turning point, one must look at the depths of the stagnation. Before 2008, British output per hour grew at a reliable rate of roughly two percent each year. Then, it simply stopped. If the pre-crisis trend had continued, the average British worker would be producing nearly a third more today than they currently do. Instead, the country fell drastically behind its international peers. French and American workers routinely produce in four days what takes a British worker five.
This gap has had brutal consequences for living standards. However, the Office for National Statistics reported a surprising uptick in output per hour worked over the most recent consecutive quarters. It is the first time since the brief, chaotic volatility of the pandemic era that we have seen sustained positive momentum. Still, the baseline is incredibly low. The British economy is finally creeping forward, but it is starting a lap behind its closest competitors.
The Core Development
The recent data regarding UK labour productivity cannot be dismissed as a mere rounding error. In the final quarters leading into this year, output per hour worked rose by 0.8 percent, a figure that sounds marginal but represents a seismic shift in the context of recent British economic history. This growth is largely being driven by the services sector. Specifically, professional, scientific, and technical activities have begun to integrate automation and capital upgrades at a much faster rate than the stubbornly sluggish manufacturing base.
Bank of England Governor Andrew Bailey noted recently that corporate behaviour is finally shifting. Faced with an incredibly tight labour market and the highest borrowing costs in a generation, British firms are being forced to invest in efficiency rather than simply hiring cheap labour to solve capacity problems. For years, the abundance of low-wage European labour allowed businesses to expand without investing in software, robotics, or machinery. Brexit, whatever its broader macroeconomic frictions, effectively ended that specific growth model.
Firms are now replacing absent workers with better technology. We are seeing a belated wave of capital deepening. The Bank of England’s most recent monetary policy estimates suggest that business investment, long the Achilles heel of the UK economy, has recovered to its pre-pandemic trajectory. When workers have better tools, they produce more value. It is a fundamental law of economics that the UK seemed to have forgotten.
Moreover, the reallocation of capital away from failing companies—kept alive by a decade of zero-percent interest rates—towards more dynamic firms is finally yielding results. Insolvencies have risen sharply since 2023. That causes short-term economic pain. Yet, the capital and labour freed from those failing enterprises are flowing into higher-margin, highly productive sectors. It is the exact kind of Schumpeterian creative destruction that the British economy has desperately needed to clear the dead wood and spark genuine growth.
Decoding the UK productivity puzzle
To gauge whether this momentum will last, we have to ask why it disappeared in the first place.
What is the UK productivity puzzle? The UK productivity puzzle refers to the prolonged stagnation of output per hour worked following the 2008 financial crisis. While historical British productivity grew by roughly two percent annually, the post-2008 era saw this growth flatline, severely trailing G7 peers and suppressing domestic real wage expansion.
The puzzle was never just one problem; it was a confluence of structural failures. Cambridge economist Diane Coyle has long argued that measurement errors in the digital economy obscure true output, but even adjusting for intangible assets, the British shortfall is glaring. The UK suffers from chronic underinvestment, terrible regional inequality, and planning laws that make building laboratories, railways, or data centres aggressively difficult.
That said, the current rebound suggests some of these historical drags are easing. The transition to hybrid work, initially feared to be a drag on efficiency, has allowed professional services to slash overhead costs while maintaining output. Furthermore, the sheer shock of recent energy price spikes forced industrial firms to become radically more energy-efficient. Necessity remains the mother of capital expenditure.
A deeper look at the latest structural analysis from the Resolution Foundation reveals a highly unequal recovery. The gains are heavily concentrated in London and the South East. The “long tail” of underperforming British companies—the thousands of small and medium-sized enterprises that lag far behind their German or French counterparts in adopting basic management software—remains largely unchanged. The UK essentially operates with a vanguard of globally competitive firms dragging a vast, inefficient hinterland behind them. If the government cannot find a mechanism to force technology adoption down into the mid-market, this productivity rebound will hit a hard ceiling.
Implications and Second-Order Effects
If this productivity rebound solidifies, the downstream effects on the British economy will be profound. For the Treasury, it is the ultimate silver bullet. Productivity growth is the only sustainable way to increase tax revenues without raising tax rates. Even a 0.5 percent annual improvement in the trend rate of productivity growth would wipe tens of billions off the national debt over a decade. It provides the exact fiscal headroom that recent Chancellors have desperately lacked when trying to fund an ageing National Health Service.
For the average citizen, it translates directly to real wage growth. In a low-productivity environment, any increase in wages is inherently inflationary. Firms simply pass the cost of higher salaries onto consumers. But when workers produce more per hour, companies can afford to pay them more without raising prices. It breaks the dreaded wage-price spiral that has defined British monetary policy over the last three years.
Financial markets are already beginning to price in this structural improvement. Sterling has shown recent resilience against the dollar, and foreign direct investment is tentatively returning to British infrastructure. A recent analysis by the Organisation for Economic Co-operation and Development (OECD) highlighted that the UK is uniquely positioned to benefit from the deployment of artificial intelligence in the services sector. Given its heavy reliance on finance, legal, and consulting industries, Britain has a structural advantage if it can deploy AI tools rapidly.
However, policymakers must not mistake a cyclical bump for a permanent victory. Achieving a high-wage, high-productivity economy requires relentless policy discipline. The government will need to commit to long-term infrastructure projects, reform the archaic Town and Country Planning Act of 1990, and dramatically improve technical education. Without these foundational changes, the current £15 billion uptick in output will simply be a brief detour on a long road of managed decline.
The Illusion of Progress
Not everyone is convinced that the British economic engine has genuinely restarted. Skeptics argue that the recent data is heavily distorted by the aftermath of the pandemic and the subsequent inflation shock.
The dissenting view is rooted in the mechanics of labour hoarding. During the tight labour markets of 2022 and 2023, firms held onto staff even as demand cooled. They were terrified they would not be able to re-hire them when the economy recovered. This artificially depressed output per hour. What we are seeing now, critics argue, is simply the unwinding of that phenomenon. Firms are quietly shedding excess staff, meaning the same amount of work is being done by fewer people. That mathematically boosts productivity on a spreadsheet. Yet, it is a one-off accounting adjustment, not a structural leap in technological capability.
The Financial Times’ macroeconomic team recently highlighted the persistently low levels of public investment. You cannot build a high-productivity private sector on top of crumbling public infrastructure. With the NHS struggling to clear waiting lists, a significant portion of the working-age population remains economically inactive due to long-term sickness. Nearly 2.8 million Britons are currently out of the workforce for health reasons.
“We are mistaking a dead cat bounce for a sustained economic lift-off,” notes Torsten Bell, an economic policy expert. “Until we solve the chronic lack of domestic capital investment and the health-related shrinkage of our labour force, any productivity figures in the green are just statistical noise.”
The Verdict
The debate over British economic output is ultimately a debate about the country’s future place in the world. The UK is standing at a precarious inflection point. The recent data provides a tantalising glimpse of what a higher-functioning British economy could look like: one where capital is deployed efficiently, wages rise in real terms, and living standards actually improve.
Yet, one quarter of positive data does not erase fifteen years of stagnation. The structural rot—chronic underinvestment, a fragmented skills pipeline, and massive regional disparities—has not been magically cured by a few months of positive service sector returns. What we have been granted is a window of opportunity. The tentative rebound in output per hour proves that the British economy is not inherently doomed to low growth. It can adapt, and it can innovate. But turning this statistical blip into a generational economic renaissance will require a level of political courage and corporate ambition that has been entirely absent for the last decade. A nation cannot shrink its way to prosperity.
Discover more from The Economy
Subscribe to get the latest posts sent to your email.



Key Takeaways
- Rolex’s secondary market rose approximately 7.9% year-over-year as of 2026 (per WatchCharts data) — trailing Patek Philippe (+16.2%) and Tudor (+11.4%) but still outperforming Audemars Piguet (+3.4%).
- Rolex raised U.S. retail prices 4–9% in January 2026 (steel models ~5.6%, gold models ~8.7%), narrowing the historical gap between retail and pre-owned pricing.
- Not every model appreciates: steel sports references (Submariner, GMT-Master II, Daytona) have held value far better than two-tone or widely available dress references like the standard Datejust.
- The Lady-Datejust posted the sharpest 2026 gain among tracked collections — up 22.73%, from roughly $9,269 to $11,376 — driven by demand for smaller, “everyday luxury” watches.
- Gold’s rise past $2,400/oz has directly lifted the investment case for Rolex’s precious-metal references (Day-Date, Sky-Dweller, Yacht-Master).
The Model-by-Model Picture
| Category | 2026 Trend |
|---|---|
| Lady-Datejust | +22.73% (strongest performer among tracked collections) |
| Steel sports models (Submariner, GMT-Master II) | Held value well; corrected from 2022 peak but stabilized above retail |
| Daytona | Corrected from highs above $50,000 to the mid-$30,000s; still among the most sought-after references |
| Two-tone/widely available Datejust | Flat to negative — “holds value” is an overstatement for this category |
| Gold references (Day-Date, Sky-Dweller) | Lifted by gold’s rise above $2,400/oz |
Why the “Rolex Always Appreciates” Myth Is Fading
The pandemic-era boom pushed some references — the Daytona above all — to speculative highs disconnected from historical norms. Since the March 2022 peak, steel sports models have compressed meaningfully, and dealers who bought inventory near the top have in some cases faced 20–40% markdowns on liquidation. The lesson for 2026 buyers: Rolex as a category is not a monolith. Value retention depends heavily on specific reference, condition, and whether the piece comes with box and papers (“full set”).
What’s Actually Driving 2026 Strength
- Retail price increases raise the floor. When a new Submariner retails at $10,050 (up from $9,500), a pre-owned example at $11,000–$12,000 suddenly represents a smaller premium — narrowing the gap without secondary prices actually moving.
- Supply discipline remains Rolex’s core lever. The brand has never confirmed production numbers, and secondary-market premiums remain entirely a function of Rolex’s own manufacturing decisions — a risk factor as much as a support.
- Certified Pre-Owned rollout. Rolex’s now fully rolled-out CPO program has changed how buyers transact in the used market, adding a layer of brand-verified legitimacy that supports pricing.
The Case for Rolex as a Portfolio Diversifier
Financial advisors increasingly frame luxury watches not as a replacement for equities or bonds, but as a tangible, historically low-correlation diversifier — one that carries its own risks (illiquidity, condition-dependent pricing, no yield) but has demonstrated multi-decade resilience for specific references.
Is Rolex a good investment in 2026?
It depends heavily on the specific reference. Steel sports models like the Submariner and Daytona have held or grown in value; two-tone and widely available dress models generally have not. Overall, Rolex’s secondary market rose about 7.9% year-over-year in 2026, trailing Patek Philippe but ahead of Audemars Piguet.
Discover more from The Economy
Subscribe to get the latest posts sent to your email.

Navigating Mortgage and Loan Refinancing in a High-Yield Environment
Global public debt crossing critical thresholds has kept central bank policies volatile, resulting in fluctuating US Treasury yields throughout 2026. For homeowners and commercial property holders burdened by previous high-interest borrowing cycles, finding optimal refinance windows has become a high-stakes financial puzzle. Stalled disinflation and stubborn employment numbers mean rate cuts are incremental, requiring borrowers to act with precision.
Timing your mortgage or commercial loan refinance in this environment requires a deep understanding of yield curve movements and lender risk appetites.
Decoding 2026 Refinance Dynamics
The 10-Year Treasury Yield Benchmark
Mortgage rates continue to track closely with the 10-year US Treasury yield. When macroeconomic anxiety spikes debt issuance, yields rise, tightening consumer borrowing capacity. Savvy borrowers monitor weekly Treasury auctions to lock in rates during brief dip windows.
Hybrid ARMs and Alternative Structures
With fixed rates remaining elevated, 7/1 and 10/1 adjustable-rate mortgages (ARMs) have surged in popularity. These products offer lower initial monthly payments, giving borrowers breathing room until central bank easing cycles fully materialize.
| Loan Product | Current Rate Range | Best For | Key Risk Factor |
| 30-Year Fixed Mortgage | 6.2% – 6.8% | Long-term predictability | Higher initial monthly outlay |
| 7/1 Hybrid ARM | 5.5% – 5.9% | Short-term ownership / flipping | Rate reset risk after year 7 |
| Commercial Refinance | 7.0% – 8.2% | Corporate asset restructuring | Strict DSCR lender covenants |
Actionable Steps for Successful Refinancing
To maximize your chances of securing favorable refinance terms in a volatile market, follow a disciplined preparation strategy.
Boost Your Credit Score Immediately: Lenders in 2026 are applying stringent credit tiering; a 20-point increase can drop your APR by a crucial quarter-point.
Shop Regional Credit Unions: Smaller financial institutions often offer portfolio loans with more flexible underwriting than major national banks.
Calculate the Break-Even Point: Ensure your total closing costs are recouped through monthly savings within 24 months of closing.
“Market Strategist View: Refinancing in 2026 is an exercise in opportunistic timing. Borrowers must maintain immaculate financial profiles ready to strike the moment Treasury yields dip.”
Mastering the complexities of today’s debt environment ensures you can successfully lower your debt service costs and protect your long-term financial stability.
Discover more from The Economy
Subscribe to get the latest posts sent to your email.

The days of pulling generic auto insurance quotes based purely on your zip code and age are officially over. In 2026, insurance comparison engines are powered entirely by generative AI and real-time telematics. These platforms digest thousands of live data points—ranging from your driving smoothness via connected vehicle sensors to real-time traffic congestion patterns—to generate hyper-personalized premiums instantly.
For consumers, this evolution represents both a massive opportunity for savings and a hidden trap for penalty pricing. Understanding how AI algorithms evaluate risk is essential for anyone looking to lower their monthly auto insurance premiums.
How AI Comparison Engines Evaluate Your Risk Profile
Behavioral Telematics and Connected Cars
Modern cars stream performance data directly to insurance aggregators. Generative AI models analyze braking sharpness, acceleration curves, cornering G-forces, and phone distraction metrics. Drivers who maintain smooth, defensive habits are rewarded with dynamic rate cuts of up to 40% compared to traditional rating tiers.
Predictive Traffic and Weather Modeling
AI tools now cross-reference your daily commute route with predictive weather and accident probability models. If your standard parking location or driving corridor has a statistically higher incidence of uninsured motorist claims, your quotes will reflect that hyper-local risk assessment.
| Comparison Factor | Traditional Rating Model | 2026 Generative AI Model | Impact on Premium |
| Mileage & Usage | Annual estimated odometer reading | GPS tracking & live trip duration | High (up to 35% savings) |
| Driving Behavior | MVR driving record & accidents | Real-time braking, speed, & G-force | Critical (determines tier) |
| Vehicle Tech | Make, model, and safety rating | ADAS calibration & repair cost data | Moderate |
Strategies to Lower Your AI-Driven Insurance Quote
To outsmart the algorithm and secure the lowest possible premium in 2026, drivers must proactively manage their digital footprint on insurance platforms.
Opt-In for Telematics Trial Periods: Many insurers offer immediate 15% discounts just for installing their driving app; let it track safe habits for 30 days to lock in permanent savings.
Scrub Unverified Public Records: Ensure your motor vehicle report is free of clerical errors that AI risk models misinterpret as reckless behavior.
Compare AI Aggregators: Use platforms that integrate multi-carrier API feeds rather than single-brand comparison sites to find the best risk-adjusted rate.
“Industry Note: AI-driven pricing rewards transparency and precision. Drivers who actively manage their telematics data consistently out-save those relying on legacy quote calculators.”
Embracing AI comparison tools allows savvy policyholders to customize coverage limits precisely to their driving habits, eliminating wasted premium spend while ensuring robust protection.
Discover more from The Economy
Subscribe to get the latest posts sent to your email.

Neocloud Economics in 2026: GPU Debt, Utilization and Power

What Is a Neocloud? How AI GPU Clouds Work and Compare

Lula Re-elected in 2026: What Changes for the Dollar, Brazilian Stocks, and Interest Rates?

Lula Wins Brazil’s 2026 Election: Five Economic Tests for 2027

SSI November 2026 Payment: Why Benefits Arrive October 30

Russia Sanctions Waiver: What Asian Oil Buyers Gain

Asia Markets Weekly: How Oil, US Yields and the Fed Reach Tokyo, Kuala Lumpur and Karachi

Gold Near $4,000: Buy, Hold or Wait? A Pakistan Tola Price Guide

US 10-Year Treasury Yield Near 5%: The Hidden Cost for Pakistani Investors

Fed Meeting on October 28: Hike or Hold—and Why Pakistan Investors Should Care

Can Pakistan Turn US–Iran Mediation Into an Economic Dividend?

Oil Above $100: How Higher Crude Prices Reach Pakistan’s Rupee, Petrol and Imports

SBP Interest Rate at 11.5%: What Will Decide Pakistan’s Next Policy Move?

The Global South: Debt, Climate Finance and Investment in 2026

Crude Oil & Petroleum Market Analysis: OPEC+ Decisions and Price Forecasts

Top US Convenience Store Chains: Store Counts, EV Charging, and Sales Trends

Algorithmic Dogfights: Why the U.S. and China Must Establish Rules of Engagement for Autonomous Air Power

Who Is Shivon Zilis? The Neuralink Executive at the Center of the Musk–OpenAI Trial

Social Security Extra $90 Deposit: Who Qualifies for the October 2026 Medicare Rebate?

Corporate America Faces a New Debt Test as US Borrowing Costs Surge

Global Economic Outlook 2026: 7 Forces Reshaping Markets, Trade and Business

Gold Price Outlook 2026: The Forces Behind the Forecasts—and What Could Reverse Them

Gold Falls 3.7% as Yields Surge: Is Gold Still a Safe Haven in 2026?

MAS Allocates S$1.45 Billion to Five Asset Managers in Third EQDP Batch: Total Deployment Reaches S$5.4 Billion

Stock Market Today: Dow, S&P 500, and Nasdaq Retreat as Treasury Yields

Anthropic Bans Sustained Abuse of Claude AI Under New Usage Policy Effective November 12, 2026

Stock Market Crash in 2026? Warning Signs, Scenarios and a Calm Investor Checklist

Geopolitics and Your Portfolio: How International Affairs Move Global Markets
-

 Markets & Finance10 months ago
Top 15 Stocks for Investment in 2026 in PSX: Your Complete Guide to Pakistan’s Best Investment Opportunities
-

 Analysis8 months ago
Johor’s Investment Boom: The Hidden Costs Behind Malaysia’s Most Ambitious Economic Surge
-

 Analysis8 months ago
Top 10 Stocks for Investment in PSX for Quick Returns in 2026
-

 Banks9 months ago
Best Investments in Pakistan 2026: Top 10 Low-Price Shares and Long-Term Picks for the PSX
-

 Analysis9 months ago
Brazil’s Rare Earth Race: US, EU, and China Compete for Critical Minerals as Tensions Rise
-

 Investment10 months ago
Top 10 Mutual Fund Managers in Pakistan for Investment in 2026: A Comprehensive Guide for Optimal Returns
-

 Global Economy10 months ago
15 Most Lucrative Sectors for Investment in Pakistan: A 2025 Data-Driven Analysis
-

 Global Economy10 months ago
Pakistan’s Export Goldmine: 10 Game-Changing Markets Where Pakistani Businesses Are Winning Big in 2025