
Analysis
SpaceX, OpenAI & Anthropic IPOs: Wall Street’s $200B AI Test

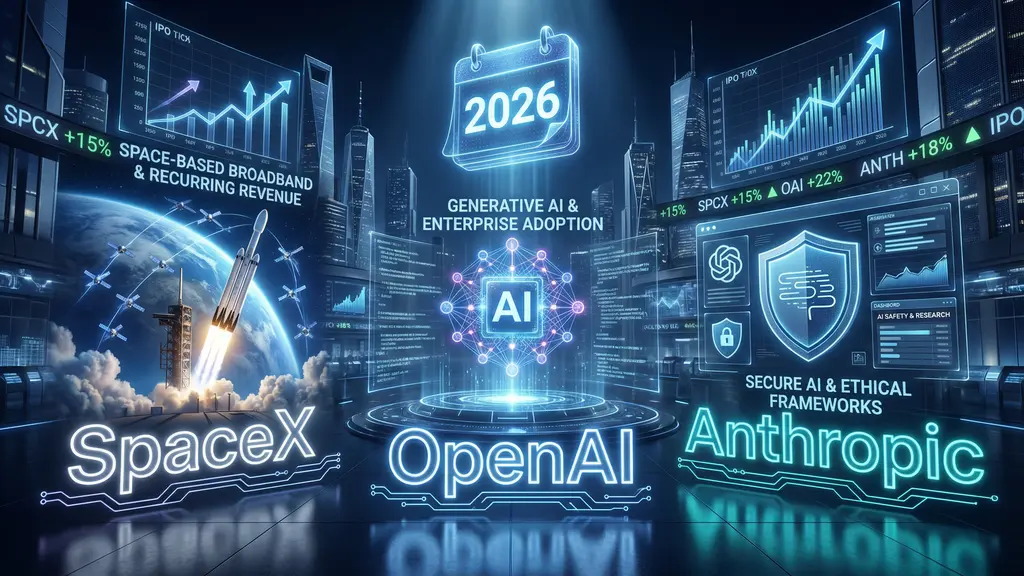
Three companies that defined the private-market boom are converging on public markets at the same moment, carrying combined valuation targets that dwarf anything Wall Street has processed before. Whether that’s a catalyst or a crowding-out event depends entirely on your faith in AI’s ability to monetise at scale.
On June 12, if the roadshow holds, Elon Musk’s SpaceX will begin trading on the Nasdaq under the ticker SPCX at a valuation the company’s own S-1 filing implies could exceed $1.75 trillion — making it, at listing, the third-largest public company in the United States, behind only Apple and Nvidia, despite an accumulated deficit of $41.3 billion and a net loss of $4.94 billion in 2025 alone. That would be the largest initial public offering in history. By a substantial margin. Then comes Anthropic, eyeing an October debut that could price it at or above $900 billion. Then, perhaps, OpenAI — still deliberating, still burning cash at $14 billion a year, still the most widely recognised consumer AI brand on the planet.
The sequence, compressed into a single calendar year, represents something the US capital markets have never encountered: a near-simultaneous rush by the three most valuable private technology companies in the world, each carrying the weight of an entire investment cycle, each demanding that public investors accept loss-making balance sheets in exchange for a front-row seat to the AI revolution.
A Pipeline Without Modern Precedent
To understand the scale of what’s approaching, consider the baseline. According to new Crunchbase data, investors poured approximately $300 billion into roughly 6,000 startups globally in Q1 2026 alone — the biggest quarter for venture capital on record — with roughly 80% of that capital flowing into AI-linked companies. The pipeline feeding Wall Street is, in other words, still swelling.
Yet the IPO exit window has remained selectively narrow. Global listings totalled $171.8 billion across 1,293 deals in 2025, a 39% rise in proceeds year-over-year, but the era of the frictionless mega-debut remains a memory of 2021. The early months of 2026 were, in the words of Crunchbase research lead Gené Teare, “much slower than was expected.” Based on mid-point valuation estimates, the combined fundraising from SpaceX, OpenAI, and Anthropic could approach $200 billion — more capital than all US listings raised collectively between 2022 and 2025. That is not a pipeline. It’s a flood.
At a Glance — The Three Deals
SpaceX (SPCX): June 12 Nasdaq listing, $1.75T target valuation, $75B raise, 21-bank syndicate led by Goldman Sachs. S-1 filed publicly May 20.
Anthropic: October 2026 target, ~$900B valuation, ~$60B raise. Goldman Sachs and JPMorgan in early lead-bank discussions. No S-1 filed.
OpenAI: Late Q4 2026 or 2027 window. $852B post-money valuation from March 2026 round. CFO Sarah Friar has flagged organisational readiness as the binding constraint.
SpaceX, OpenAI and Anthropic IPOs: The What and the Why
The SpaceX, OpenAI and Anthropic IPO wave didn’t arrive suddenly. It was built over four years of private fundraising that kept these companies out of public hands precisely because they could. Now, each faces a different version of the same pressure: the cost of building frontier AI infrastructure has become too large to finance from private capital alone.
SpaceX moved first. The company confidentially filed its S-1 with the SEC on April 1, 2026, under the internal codename Project Apex, assembling a 21-bank syndicate with Morgan Stanley, Goldman Sachs, JPMorgan, Bank of America, and Citi in lead roles. The public S-1 landed May 20. The filing disclosed $18.67 billion in consolidated 2025 revenue following the February 2026 all-stock acquisition of xAI, which valued the combined entity at $1.25 trillion before the IPO rerating began. Adjusted EBITDA came in at $6.58 billion, but the GAAP picture is less comfortable: an operating loss of $2.59 billion and a net loss of $4.94 billion.
The filing’s headline number — that $1.75 trillion target valuation — implies a price-to-sales ratio in the range of 94 times 2025 revenue. For context, that is higher than Tesla’s multiple at its 2010 IPO, and higher than nearly every other publicly-traded company today. If SpaceX prices at the top of its reported range, it would join Apple and Nvidia in the $2 trillion club on day one.
Still, the bull case isn’t without grounding. Starlink, the company’s satellite broadband operation, generated Starlink’s $11.4 billion in revenue in 2025 — 61% of consolidated sales — growing at 49.8% year-over-year against a 63% EBITDA margin. That’s a broadband business with a $28.5 trillion total addressable market, per the S-1’s own sizing (excluding China and Russia). The xAI segment is the drag: it posted a $2.47 billion operating loss in Q1 2026 alone, and the Grok chatbot faces regulatory investigations across eight agencies connected to nonconsensual synthetic imagery. Retail investors have been allocated 30% of the offering — roughly $22.5 billion at the reported raise target — three times the standard for a deal of this size. Musk won’t sell a single share.
Three Floats, Three Distinct Propositions — and One Structural Question
Strip away the headline valuations and the three companies offer public market investors fundamentally different risk-return profiles, despite sharing a single narrative.
SpaceX is, at its core, a cash-generative satellite business stapled to a money-losing AI division and a launch operation that reinvests nearly everything it earns. The Starlink segment is real, profitable, and growing fast. The xAI bet — that an AI-driven data centre and chatbot business can scale to justify the combined $1.75 trillion price tag — is less provable. The dual-class share structure gives Musk 85.1% of combined voting power through Class B shares carrying ten votes apiece. His performance grant of approximately 1.3 billion shares vests on conditions that include building a Mars colony of one million people. That is not, strictly speaking, a standard clause in a prospectus.
“Once you go public, companies can no longer cherry pick what pieces of information they want to disclose.”
— Minmo Gahng, Professor of Finance, Cornell University
Anthropic’s annualised revenue model occupies the most investor-friendly corner of the three. Its annualised revenue run rate expanded from $9 billion at the end of 2025 to over $30 billion by April 2026, with approximately 80% of that revenue derived from enterprise customers — the stickiest, most contractual segment of the AI demand stack. Amazon and Google between them have committed more than $70 billion in equity and cloud infrastructure, giving Anthropic a structural cost advantage that OpenAI’s $14 billion projected loss and more diversified investor base can’t easily replicate. CNBC reported this week that Anthropic is set to hit $10.9 billion in quarterly revenue in Q2 2026, and the company expects to break even by 2028 — roughly two years ahead of OpenAI’s own guidance.
Will OpenAI IPO in 2026? The answer, as of May 2026, is probably not on the terms Sam Altman originally envisaged. OpenAI’s CFO Sarah Friar has privately told industry insiders that conditions for a listing won’t be met before the end of the year; the organisational and process work isn’t finished. The company closed a $122 billion funding round in March at an $852 billion post-money valuation — the largest private financing in Silicon Valley history — but it’s projected to lose $14 billion in 2026 and doesn’t expect profitability until 2029 or 2030. HSBC analysts estimate OpenAI may require more than $207 billion in additional funding by 2030. The most likely listing window is late 2026 or early 2027, contingent on the S-1 process and the resolution of ongoing litigation with Elon Musk.
What the AI IPO Wave Means for Markets, Investors, and the Broader Tech Ecosystem
The market-absorption question is the one that serious investors keep returning to. Can Wall Street digest $200 billion in new AI-linked equity issuance in a single year without distorting the valuations of every other technology company already trading?
The evidence on crowding-out effects is mixed. The more immediate risk is sequencing. SpaceX’s June listing arrives at a moment when the Nasdaq is already processing the aftermath of the “SaaSpocalypse” — a wave of pulled or delayed smaller-tech offerings that dampened early 2026 enthusiasm — and when the chipmaker Cerberus (CBRS) has just demonstrated both the ferocity of AI demand (its stock rose 68% on debut) and its fragility (it dropped 10% the following session). SpaceX enters that environment as the definitional mega-cap, which means passive index funds will be forced to acquire shares regardless of governance concerns if, as reported, Nasdaq index providers prepare for rapid post-IPO inclusion. That mechanical demand could insulate the stock price from early sell-off pressure, but it also concentrates governance risk in the hands of precisely the investors least able to act on it.
For the broader AI ecosystem, the listings carry a second-order implication that goes beyond the IPO proceeds themselves. Minmo Gahng, a professor of finance at Cornell University, has noted that while these companies have booming revenue, they’re not likely to be profitable in the near future because they’re spending so much on hardware. Public market discipline — quarterly reporting, SEC disclosures, institutional shareholder scrutiny — will force each company to defend its cost structure in ways private investors never required. That is structurally healthy for an industry whose capital deployment has largely escaped independent audit. It may, however, also slow the hiring cycles and compute buildouts that have sustained the current pace of model advancement.
The long cycle has one other notable winner: early-stage venture capital. The gains that have accrued inside these three companies — over two decades of compounding in SpaceX’s case — will now crystallise for a relatively small number of private investors and VC firms. The public markets will absorb the next decade of dilution.
The Case Against the Frenzy
It would be journalistically convenient to frame these three listings as the inevitable triumphant public moment of the AI generation. The countercase is worth stating clearly, because it’s more than the usual IPO-cycle caution.
Start with the valuations. At $1.75 trillion, SpaceX carries a price-to-sales multiple exceeding 80 times, a figure that has already prompted warnings of valuation bubble signals from analysts tracking the deal. The last time US markets absorbed an IPO at this scale of ambition-to-earnings divergence was during the dot-com era. That cycle produced genuine value — Amazon and Google are testament to that — but it also produced spectacular wreckage for investors who arrived at the party after the sophisticated money.
The picture is more complicated than pure bubble rhetoric, though. These aren’t pre-revenue visions. SpaceX had $18.67 billion in consolidated revenue in 2025. Anthropic is on track for annualised revenue above $40 billion by mid-2026. OpenAI’s ChatGPT serves 900 million weekly active users. The revenue curves are real. The question is whether the capital requirements to maintain competitive position in frontier AI — SpaceX’s planned $20.7 billion annual capital expenditure puts it in the same bracket as Meta, Alphabet, and Microsoft — are compatible with the profitability trajectories these valuations imply.
Jay Ritter, an economist at the University of Florida who has studied IPO markets for decades, drew an instructive parallel when Netscape went public in 1995 — barely a year old — and Wall Street went, in his words, “bonkers.” That kicked off the dot-com boom. SpaceX is 24 years old, OpenAI is ten, and Anthropic is five. All three have mature operations. The difference is that the gains have already accrued to private investors. Public buyers are arriving at a more expensive party.
There is also the governance question, which few mainstream commentators have pressed hard enough. Musk’s 85.1% voting control post-listing effectively means that the $75 billion in public equity being raised buys no meaningful oversight. Institutional investors who have spent a decade demanding better governance structures at portfolio companies will be asked to accept a prospectus in which the CEO’s compensation vests on Mars colonisation milestones. The controlled-company exemptions SpaceX intends to claim remove most of the standard investor-protection provisions. Whether that’s a deal-breaker or just a feature of investing in a Musk-controlled entity is a question each institution will have to answer for itself.
The deeper tension at the centre of all three offerings isn’t about valuations or governance structures or even profitability timelines. It’s about what public markets are actually being asked to price. These aren’t companies with a product, a market, and a cash flow model that analysts can comfortably triangulate. They’re bets on the proposition that artificial intelligence will be, over the next decade, the most consequential and value-accreting technology transition in economic history — and that SpaceX, OpenAI, and Anthropic, rather than some combination of incumbents and as-yet-unfounded challengers, will capture the majority of that value.
That’s not a crazy bet. It may be the right one. But it’s a bet that belongs on a venture term sheet, not in the index fund that quietly holds your pension.
The roadshow starts in two weeks. Bring your own conviction.
Discover more from The Economy
Subscribe to get the latest posts sent to your email.



Navigating Mortgage and Loan Refinancing in a High-Yield Environment
Global public debt crossing critical thresholds has kept central bank policies volatile, resulting in fluctuating US Treasury yields throughout 2026. For homeowners and commercial property holders burdened by previous high-interest borrowing cycles, finding optimal refinance windows has become a high-stakes financial puzzle. Stalled disinflation and stubborn employment numbers mean rate cuts are incremental, requiring borrowers to act with precision.
Timing your mortgage or commercial loan refinance in this environment requires a deep understanding of yield curve movements and lender risk appetites.
Decoding 2026 Refinance Dynamics
The 10-Year Treasury Yield Benchmark
Mortgage rates continue to track closely with the 10-year US Treasury yield. When macroeconomic anxiety spikes debt issuance, yields rise, tightening consumer borrowing capacity. Savvy borrowers monitor weekly Treasury auctions to lock in rates during brief dip windows.
Hybrid ARMs and Alternative Structures
With fixed rates remaining elevated, 7/1 and 10/1 adjustable-rate mortgages (ARMs) have surged in popularity. These products offer lower initial monthly payments, giving borrowers breathing room until central bank easing cycles fully materialize.
| Loan Product | Current Rate Range | Best For | Key Risk Factor |
| 30-Year Fixed Mortgage | 6.2% – 6.8% | Long-term predictability | Higher initial monthly outlay |
| 7/1 Hybrid ARM | 5.5% – 5.9% | Short-term ownership / flipping | Rate reset risk after year 7 |
| Commercial Refinance | 7.0% – 8.2% | Corporate asset restructuring | Strict DSCR lender covenants |
Actionable Steps for Successful Refinancing
To maximize your chances of securing favorable refinance terms in a volatile market, follow a disciplined preparation strategy.
Boost Your Credit Score Immediately: Lenders in 2026 are applying stringent credit tiering; a 20-point increase can drop your APR by a crucial quarter-point.
Shop Regional Credit Unions: Smaller financial institutions often offer portfolio loans with more flexible underwriting than major national banks.
Calculate the Break-Even Point: Ensure your total closing costs are recouped through monthly savings within 24 months of closing.
“Market Strategist View: Refinancing in 2026 is an exercise in opportunistic timing. Borrowers must maintain immaculate financial profiles ready to strike the moment Treasury yields dip.”
Mastering the complexities of today’s debt environment ensures you can successfully lower your debt service costs and protect your long-term financial stability.
Discover more from The Economy
Subscribe to get the latest posts sent to your email.

The days of pulling generic auto insurance quotes based purely on your zip code and age are officially over. In 2026, insurance comparison engines are powered entirely by generative AI and real-time telematics. These platforms digest thousands of live data points—ranging from your driving smoothness via connected vehicle sensors to real-time traffic congestion patterns—to generate hyper-personalized premiums instantly.
For consumers, this evolution represents both a massive opportunity for savings and a hidden trap for penalty pricing. Understanding how AI algorithms evaluate risk is essential for anyone looking to lower their monthly auto insurance premiums.
How AI Comparison Engines Evaluate Your Risk Profile
Behavioral Telematics and Connected Cars
Modern cars stream performance data directly to insurance aggregators. Generative AI models analyze braking sharpness, acceleration curves, cornering G-forces, and phone distraction metrics. Drivers who maintain smooth, defensive habits are rewarded with dynamic rate cuts of up to 40% compared to traditional rating tiers.
Predictive Traffic and Weather Modeling
AI tools now cross-reference your daily commute route with predictive weather and accident probability models. If your standard parking location or driving corridor has a statistically higher incidence of uninsured motorist claims, your quotes will reflect that hyper-local risk assessment.
| Comparison Factor | Traditional Rating Model | 2026 Generative AI Model | Impact on Premium |
| Mileage & Usage | Annual estimated odometer reading | GPS tracking & live trip duration | High (up to 35% savings) |
| Driving Behavior | MVR driving record & accidents | Real-time braking, speed, & G-force | Critical (determines tier) |
| Vehicle Tech | Make, model, and safety rating | ADAS calibration & repair cost data | Moderate |
Strategies to Lower Your AI-Driven Insurance Quote
To outsmart the algorithm and secure the lowest possible premium in 2026, drivers must proactively manage their digital footprint on insurance platforms.
Opt-In for Telematics Trial Periods: Many insurers offer immediate 15% discounts just for installing their driving app; let it track safe habits for 30 days to lock in permanent savings.
Scrub Unverified Public Records: Ensure your motor vehicle report is free of clerical errors that AI risk models misinterpret as reckless behavior.
Compare AI Aggregators: Use platforms that integrate multi-carrier API feeds rather than single-brand comparison sites to find the best risk-adjusted rate.
“Industry Note: AI-driven pricing rewards transparency and precision. Drivers who actively manage their telematics data consistently out-save those relying on legacy quote calculators.”
Embracing AI comparison tools allows savvy policyholders to customize coverage limits precisely to their driving habits, eliminating wasted premium spend while ensuring robust protection.
Discover more from The Economy
Subscribe to get the latest posts sent to your email.

Despite decades of bans and strict handling mandates, asbestos remains a silent killer across legacy manufacturing plants, shipyards, and modern green-energy infrastructure retrofits. In 2026, regulatory changes by the EPA and tightened occupational health standards have triggered a fresh wave of mesothelioma litigation. Manufacturers attempting to fast-track industrial transitions are encountering catastrophic oversight, exposing workers to legacy toxins and opening corporate parent companies to unprecedented liability.
Navigating a mesothelioma claim in 2026 requires understanding how modern industrial supply chains intersect with historical exposure. Trusts established decades ago are being audited under stricter transparency laws, altering payout ratios and accelerating fast-track settlements for terminally ill plaintiffs.
Modern Industrial Exposure Hotspots
Green Retrofitting and Renewable Energy Infrastructure
A primary source of 2026 asbestos exposure occurs during the decommissioning and retrofitting of older industrial facilities for renewable energy production. Workers insulating electrical grids, modernizing HVAC systems, or upgrading manufacturing floors frequently disturb encapsulated asbestos materials that were improperly documented or ignored during facility audits.
Automotive and Aerospace Supply Chains
With advanced manufacturing booming, workers handling specialized friction materials, gaskets, and heat shields face ongoing risks. Supply chain tracing has become more sophisticated, allowing legal teams to pinpoint exact corporate entities responsible for raw material distribution across multinational borders.
| Industry Sector | Primary Exposure Risk | Legal Venue / Trust | Avg. Claim Value Range |
| Green Energy Retrofit | Disturbed insulation, pipe lagging | Federal Tort / Manufacturer Trust | $1.2M – $3.5M |
| Shipbuilding & Marine | Boiler insulation, structural seals | Asbestos Bankruptcy Trusts | $800K – $2.4M |
| Automotive Manufacturing | Brake components, high-heat gaskets | Third-Party Product Liability | $600K – $1.8M |
Securing Maximum Compensation: Steps for Plaintiffs
Time is of the essence in mesothelioma cases. Plaintiffs and their families must act decisively to secure financial recovery before statutes of limitations expire.
Retain Specialized Counsel: Work exclusively with national mesothelioma law firms possessing deep historical databases of asbestos-containing products.
Audit Employment History: Document every job site, supervisor name, and equipment brand encountered throughout your career.
Expedite Medical Filings: Secure a formal pathological diagnosis quickly to qualify for expedited trust fund distribution and priority trial settings.
“Expert Insight: Modern asbestos litigation is no longer just about historical tracking; it is about holding modern corporations accountable for failing to conduct rigorous environmental safety audits before initiating industrial retrofits.”
By combining meticulous work history reconstruction with aggressive multi-trust filings, victims can secure substantial financial relief to cover specialized immunotherapy and family support.
Discover more from The Economy
Subscribe to get the latest posts sent to your email.

Crypto Daily Outlook: Bitcoin, Altcoins, and the Future of Decentralized Finance

Anthony Scaramucci’s Crypto Prediction: Why MicroStrategy’s Move Is Bitcoin’s “iPhone Moment”

Best Dividend Stocks 2026: European & Asian Blue Chips

World Bank & IMF Reports 2026: Why the “3% Growth” Consensus Is Actually a Debate

Elon Musk’s Boring Company Hits $23B Valuation After UAE-Led $3 Billion Series D

Middle East War Economics 2026: Oil Prices & Energy Markets

PSX Forecast 2026: KSE-100, IMF Reviews & Geopolitics

Asian Markets Outlook 2026: China, Japan & Singapore Stocks

Global Economy 2026: IMF Growth, Inflation & Private Credit

Current Account Deficit (CAD) : Causes and Impact

Balance of Payments (BOP)

The Falkland Islands Dispute: Sovereign Wealth, Offshore Drilling, and Market Impacts

Gross Domestic Product (GDP): Nominal vs. Real

What is Inflation and the Consumer Price Index (CPI)?

State Farm’s $5B Dividend 2026: Who Qualifies & Payout Dates

US-China Relations in Q3 2026: Trade Tariffs and Supply Chain Risks

Gold’s Wild 2026: From a Record $5,600 Peak to a 24% Crash and Back Toward $4,500

Oil Surges as Strait of Hormuz Traffic Collapses Again

The Rocket That Won’t Quit: Inside SpaceX’s Falcon 9 Launch Machine

Bank of England Set to Hold Rates Through Year-End, Reuters Poll Shows

SpaceX Starship Flight 14: First Orbital Attempt & Starlink V3 Launch Explained

The 2026 Crypto Regulatory Shift: What It Means for Institutional Investors

AI Chip Stocks 2026: The Best Semiconductor Investments Beyond Marvell

Retail Earnings Week: What Home Depot, Target & Walmart Reveal

AI-Powered Training: The Next Multi-Billion Dollar Ecosystem in Fitness

Top 30 Stocks for Investment in PSX for Massive ROI in 2026

Russia’s Black Sea Oil Exports Fall for a Fifth Straight Week

Tween Back-to-School Trends 2026: What’s Driving the $85B Season
-

 Markets & Finance8 months ago
Top 15 Stocks for Investment in 2026 in PSX: Your Complete Guide to Pakistan’s Best Investment Opportunities
-

 Analysis7 months ago
Johor’s Investment Boom: The Hidden Costs Behind Malaysia’s Most Ambitious Economic Surge
-

 Analysis7 months ago
Top 10 Stocks for Investment in PSX for Quick Returns in 2026
-

 Analysis7 months ago
Brazil’s Rare Earth Race: US, EU, and China Compete for Critical Minerals as Tensions Rise
-

 Banks8 months ago
Best Investments in Pakistan 2026: Top 10 Low-Price Shares and Long-Term Picks for the PSX
-

 Investment8 months ago
Top 10 Mutual Fund Managers in Pakistan for Investment in 2026: A Comprehensive Guide for Optimal Returns
-

 Global Economy9 months ago
15 Most Lucrative Sectors for Investment in Pakistan: A 2025 Data-Driven Analysis
-

 Global Economy9 months ago
Pakistan’s Export Goldmine: 10 Game-Changing Markets Where Pakistani Businesses Are Winning Big in 2025