
Analysis
When the World Burns: Will the IMF Blink on Pakistan’s Fuel Subsidies Amid the Strait of Hormuz Crisis?

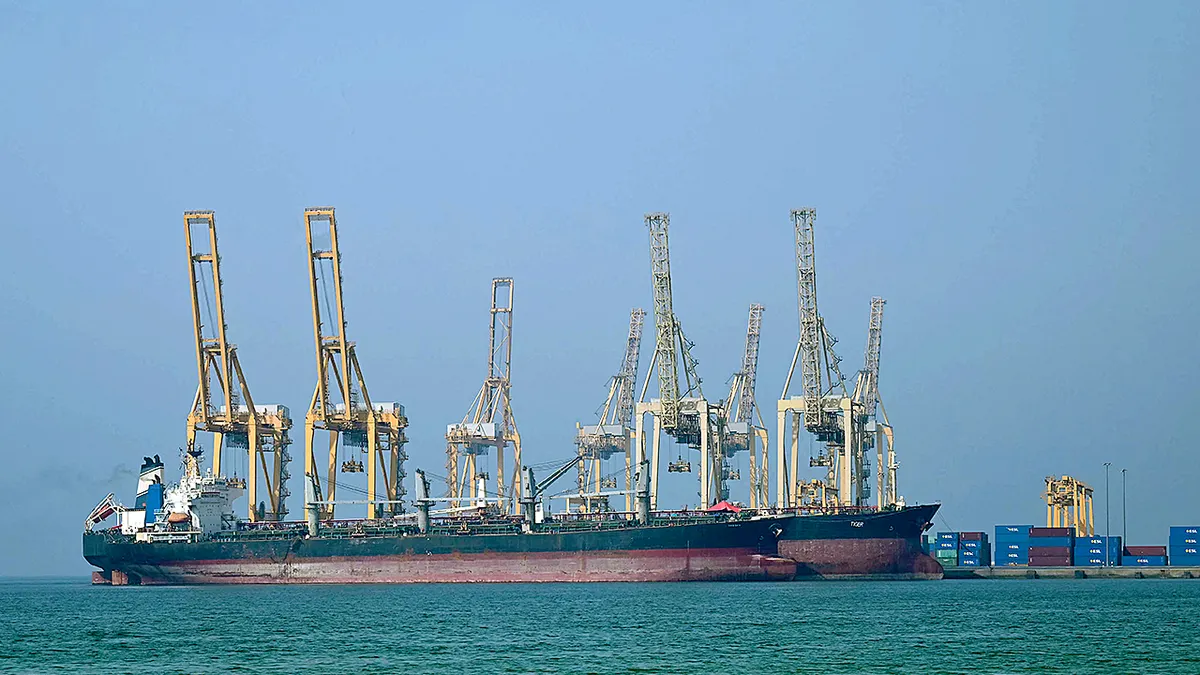
The war in the Middle East has rewritten the rules of global energy markets. For Pakistan, the question is whether Washington’s premier lender will rewrite the rules of fiscal discipline—and whether doing so would actually help.
The morning commute in Karachi tells you everything macroeconomic models cannot. On Shahrah-e-Faisal, rickshaw drivers pause to do the math in their heads—fuel costs up, fares contested, margins evaporating. At the city’s truck terminals, hauliers who move food from Sindh’s agricultural belt to urban markets are quietly adding surcharges that will ripple through every vegetable market from Lyari to Gulshan. The war in the Middle East, detonated by the February 28, 2026 joint US-Israeli air campaign against Iran and Iran’s subsequent closure of the Strait of Hormuz, has not remained a distant geopolitical abstraction. It has arrived at the petrol pump, in the grocery bill, and now—most consequentially—inside the negotiating rooms where Pakistan and the International Monetary Fund are working through the terms of the country’s $7 billion Extended Fund Facility.
The question gaining urgency among Islamabad’s policymakers, economists, and the public alike is a deceptively simple one: given an energy shock of unprecedented historical scale, will the IMF relax its strict conditions on fuel subsidies for Pakistan? The honest answer, grounded in both economics and political reality, is: modestly, carefully, and only at the margins. And that is almost certainly the right call—even if it makes for uncomfortable politics in a country where energy prices are already a flashpoint.
An Energy Shock With No Historical Precedent
To understand why Islamabad is under such enormous pressure, one must first grasp the scale of what has happened to global oil markets since late February. The closure of the Strait of Hormuz—through which roughly 27% of the world’s seaborne oil trade and 20% of global LNG volumes transited before the conflict—represents, in the words of the International Energy Agency’s Executive Director, “the greatest threat to global energy security in history.” This is not rhetorical escalation. It is arithmetic.
Crude and oil product flows through the Strait plunged from around 20 million barrels per day before the war to just over 2 million by mid-March. Gulf countries, with storage filling rapidly and exports stranded, have cut total output by more than 14 million barrels per day. Brent crude, which traded at $71.32 per barrel on February 27, 2026, surged more than 55%, briefly touching nearly $120 a barrel at its peak—a pace of appreciation that March 2026 will record as one of the largest single-month oil price jumps in market history. As of late April, with the Strait’s status oscillating between partial reopening and fresh episodes of Iranian interdiction, Brent remains anchored in the $80–$92 range with no durable resolution in sight, and commodity analysts warn that sustained supply chain bottlenecks could keep markets tight regardless of any ceasefire.
For energy-importing developing nations, the IMF itself frames this precisely. In a landmark March 30 blog signed by eight of the Fund’s regional directors—including Western Hemisphere Director Rodrigo Valdés—the authors warn that “all roads lead to higher prices and slower growth,” with energy-importing economies in Asia and Africa facing the effect of a “large, sudden tax on income.” Pakistan, almost entirely dependent on imported crude and LNG, sits squarely in the crosshairs.
Pakistan’s Fiscal Tightrope: The Numbers Behind the Negotiations
Against this backdrop, Pakistan’s position is structurally precarious. The country carries a fiscal deficit projected at approximately 3.2% of GDP for FY26 and FY27, with government revenues expected to remain roughly stable at 15.8% of GDP—a ratio that leaves vanishingly little room for unbudgeted expenditure shocks. Public debt remains elevated. Foreign exchange reserves, though recovering relative to the 2022–23 crisis lows, are still fragile enough that the IMF has explicitly stated that exchange rate flexibility should remain the primary shock absorber against Middle East spillovers—a polite way of saying Islamabad cannot afford to defend the rupee while simultaneously subsidizing petrol.
The political impulse to do exactly that has nonetheless proven irresistible. Prime Minister Shehbaz Sharif’s government has, over recent months, reintroduced fuel subsidies—cutting petrol prices by Rs80 per litre at one point—and held the Petroleum Development Levy (PDL) on diesel at effectively zero, against a budgeted target of Rs80 per litre. Fuel subsidies had risen to Rs125 billion by April 3, 2026, with the government committing to a Rs152 billion cap and scrambling to find fiscal offsets through cuts to the development budget and Rs27 billion in savings from reduced government fuel allowances.
The IMF, for its part, is not unmoved by the humanitarian dimension—but it remains unyielding on the fiscal logic. Mission Chief Iva Petrova stated explicitly at the conclusion of the March third-review discussions that “energy price subsidies should be avoided due to their high fiscal cost and distortionary effects,” and that “sustainability is maintained through timely tariff adjustments that ensure cost recovery.” The staff-level agreement for the third review, reached on March 27 and scheduled for Executive Board approval on May 8 to unlock approximately $1.2 billion in disbursements, was reached against a backdrop of ongoing negotiations over fuel pricing parameters that are expected to shape the upcoming federal budget.
The IMF’s April 2026 Fiscal Monitor, meanwhile, advised Pakistan to gradually phase out fuel subsidies, address contingent liabilities, and expand its tax base to ensure medium-term fiscal sustainability. The Fund warned that sustained fiscal consolidation would require structural reforms, including broadening the tax base and reducing reliance on subsidies, and that Pakistan’s primary surplus—estimated at 2.5% of GDP for FY26—is projected to decline to just 0.1% by FY31 without further reform action. These numbers tell a story of structural fragility that no amount of war-emergency rhetoric can paper over.
The Case Against Broad Subsidies: Why the IMF Is Right to Hold Firm
Fuel subsidies are, from an economist’s perspective, almost perfectly designed instruments for achieving the wrong outcomes. They are regressive—higher-income households, who own more vehicles and consume more fuel per capita, capture a disproportionate share of the benefit. They distort price signals, discouraging conservation and investment in alternatives precisely when the supply shock argues for both. They are fiscally corrosive: Pakistan’s government revenues running at 15.8% of GDP cannot sustainably absorb an open-ended commitment to international oil prices while simultaneously funding the security, education, and health expenditures a 240 million-person nation requires.
There is, moreover, a cautionary precedent from a strikingly similar juncture. When Russia’s 2022 invasion of Ukraine triggered global commodity price surges, a number of emerging markets—from Egypt to Sri Lanka to Pakistan itself—responded with broad-based fuel subsidies. In every case, the fiscal cost proved larger than anticipated, the inflationary feedback loop proved faster than modelled, and the political economy of subsidy removal proved dramatically more costly after a period of entrenchment than it would have been with targeted relief from the outset. Sri Lanka’s fiscal collapse, in particular, demonstrated how subsidy-driven balance-of-payments deterioration can accelerate from a manageable deficit challenge to a full-scale reserve crisis with frightening speed. Pakistan, in 2022, required emergency IMF intervention partly because of this dynamic. Repeating the experiment with a weaker fiscal position and a larger external shock would be economically reckless.
The IMF Fiscal Monitor’s warning that “revenue growth has likely peaked” carries particular weight in this context. If Pakistan’s tax-to-GDP ratio, already among the lowest in South Asia at roughly 10-11%, cannot be meaningfully raised in coming years, then subsidy expenditures crowd out the very social investments—health, education, early childhood development—that translate economic growth into human development. The war emergency does not suspend this structural logic; it intensifies it.
What the IMF Should Do—and What Islamabad Should Ask For
The argument that broad fuel subsidies are counterproductive does not imply that the IMF should ignore the human reality on Karachi’s streets. There is a meaningful distinction, however, between comprehensive price suppression—which primarily benefits the non-poor—and targeted, temporary relief for vulnerable households. And here, encouragingly, both the IMF and Pakistan’s government have identified the right mechanism, even if the sequencing and scale remain contested.
The Benazir Income Support Programme (BISP) is among the better-designed cash transfer systems in South Asia. As part of the new programme conditions, the IMF has already asked Pakistan to increase BISP quarterly payments by 35%—raising stipends from Rs14,500 to Rs19,500 starting January 2027—a meaningful improvement, though one that may not fully offset middle-income household burden. Islamabad should push, firmly and with economic evidence, for a faster and more generous BISP uplift. This is the correct instrument for a war-emergency response: fiscally bounded, targeted to those who actually need relief, and capable of being wound down as the oil shock dissipates without creating the entrenched price distortions that fuel subsidies inevitably generate.
The IMF, for its part, should show flexibility in how fiscal targets are achieved during an external shock of this magnitude, even while holding firm on whether they are achieved. There is genuine economic justification for allowing some degree of automatic stabiliser functioning—accepting a temporary deficit overshoot if revenues fall short due to slower growth, rather than demanding pro-cyclical fiscal tightening in the middle of an energy crisis. The Fund’s own Fiscal Monitor acknowledges that the Middle East conflict “could lead to higher energy prices, tighter financial conditions and increased inflationary pressures” that strain government finances. Acknowledging this in the programme design—with explicit clauses for temporary deviation if oil prices remain above a defined threshold—would be a sophisticated policy response. It would also be consistent with IMF practice during the COVID emergency waivers of 2020–2021.
Concrete policy recommendations for Islamabad:
- Accelerate BISP expansion now, rather than after January 2027; propose a dedicated emergency supplementary tranche for the war-shock period, financed by the fiscal savings already generated from development budget rationalisation.
- Maintain petroleum levy on petrol at the Rs100/litre level and work with provinces to restore the diesel levy to the Rs55/litre target on a time-bound schedule, insulating revenue flows from the war’s uncertainty.
- Negotiate an oil price contingency clause within the EFF framework: if Brent remains above $95 per barrel for more than 60 consecutive days, a pre-agreed, temporary widening of the deficit target—funded by provincial surplus sharing rather than central bank financing—takes effect automatically.
- Fast-track tariff rationalisation in the power sector to reduce circular debt accumulation; the energy sector’s fiscal drag is structurally more damaging than the current fuel subsidy debate.
- Resist the political pressure to freeze petrol prices indefinitely. Each month of price freeze embeds a larger future adjustment, and experience shows that deferred adjustment is always more painful—economically and politically—than managed, incremental change.
The Geopolitical Dimension: Leverage, Moral Hazard, and the Long Game
There is an argument, sometimes advanced in Islamabad’s policy circles, that Pakistan’s geopolitical weight—its nuclear status, its strategic location, its diplomatic role in US-Iran mediation talks (with US Vice President JD Vance and Steve Witkoff reportedly transiting Islamabad for negotiation rounds)—gives it leverage to extract more lenient IMF terms. This argument deserves neither complete dismissal nor uncritical acceptance.
It is true that the Fund operates in a political economy, and that strategically significant states have historically received more patient treatment than smaller, less geopolitically consequential debtors. It is equally true, however, that moral hazard is a serious constraint on IMF flexibility. If Pakistan secures significant subsidy-related waivers on the basis of war-emergency argumentation, it establishes a precedent—for itself in future programme negotiations, and for other emerging markets observing the dynamic—that external shocks are sufficient to suspend fiscal conditionality. The long-run cost of that precedent almost certainly exceeds the short-run benefit of a relaxed petroleum levy target.
The IMF’s own research—including the March 30 blog by Rodrigo Valdés and colleagues—is explicit that the war shock is asymmetric: it hurts energy importers more than exporters, and poorer countries more than richer ones. But the Fund’s recommended response to this asymmetry is not price suppression—it is enhanced social protection, exchange rate flexibility, and where available, additional concessional financing. Pakistan has access to the Resilience and Sustainability Facility, which is precisely designed for climate and external shock resilience. Islamabad should explore whether the RSF’s parameters can be stretched to address a conflict-driven energy emergency, a creative use of existing instruments that might yield more than a pitched battle over petroleum levy targets.
The Forward Path: Resilience Requires Reform, Not Relief
The immediate crisis will pass—eventually. Commodity analysts already note that any durable reopening of the Strait of Hormuz would likely trigger an immediate $10–$20 per barrel drop in crude prices, with Brent likely settling in the $80–$90 range even with lingering supply chain disruption. Pakistan’s current account pressures should ease materially when that happens. The question that will define Pakistan’s medium-term economic trajectory, however, is what structural architecture remains in place when the storm breaks.
The IMF’s next-programme thinking—already forming as the current EFF winds down—targets a 2% primary surplus, broader taxation of agriculture, exporters, IT, real estate and retail, and the definitive phase-out of fuel subsidies. These are not punitive demands. They are the minimum structural conditions for a country with Pakistan’s demographic profile and development aspirations to maintain any semblance of fiscal sovereignty. A government that can shelter its poorest citizens through well-targeted transfers, collect taxes from all productive sectors of its economy, and price energy at cost-reflective levels is a government that does not need to go cap-in-hand to Washington every two years. That is, ultimately, what genuine economic independence looks like.
The war in the Middle East is a tragedy measured in lives, livelihoods, and the slow-motion unravelling of a regional order that—whatever its imperfections—sustained the energy infrastructure on which billions of people depend. For Pakistan, it is also a test: of the political maturity to distinguish between legitimate emergency relief and structural dependence; of the administrative capacity to deliver targeted cash transfers faster than political pressure demands across-the-board price freezes; and of the diplomatic skill to negotiate flexibility within a programme framework without triggering a breakdown that would cost far more than the subsidy revenue being contested.
The rickshaw driver on Shahrah-e-Faisal deserves protection from an energy price shock he had no hand in causing. He deserves it through a direct transfer to his pocket—not through a subsidy that flows, at perhaps five times the fiscal cost, to the executive at Clifton who fills up his Fortuner. Getting that distinction right, under pressure, in the middle of a war, is the task before Pakistan’s policymakers and their IMF interlocutors alike. It will not be easy. But it is the only path that ends somewhere better than another crisis.
Discover more from The Economy
Subscribe to get the latest posts sent to your email.



Key Takeaways
- Rolex’s secondary market rose approximately 7.9% year-over-year as of 2026 (per WatchCharts data) — trailing Patek Philippe (+16.2%) and Tudor (+11.4%) but still outperforming Audemars Piguet (+3.4%).
- Rolex raised U.S. retail prices 4–9% in January 2026 (steel models ~5.6%, gold models ~8.7%), narrowing the historical gap between retail and pre-owned pricing.
- Not every model appreciates: steel sports references (Submariner, GMT-Master II, Daytona) have held value far better than two-tone or widely available dress references like the standard Datejust.
- The Lady-Datejust posted the sharpest 2026 gain among tracked collections — up 22.73%, from roughly $9,269 to $11,376 — driven by demand for smaller, “everyday luxury” watches.
- Gold’s rise past $2,400/oz has directly lifted the investment case for Rolex’s precious-metal references (Day-Date, Sky-Dweller, Yacht-Master).
The Model-by-Model Picture
| Category | 2026 Trend |
|---|---|
| Lady-Datejust | +22.73% (strongest performer among tracked collections) |
| Steel sports models (Submariner, GMT-Master II) | Held value well; corrected from 2022 peak but stabilized above retail |
| Daytona | Corrected from highs above $50,000 to the mid-$30,000s; still among the most sought-after references |
| Two-tone/widely available Datejust | Flat to negative — “holds value” is an overstatement for this category |
| Gold references (Day-Date, Sky-Dweller) | Lifted by gold’s rise above $2,400/oz |
Why the “Rolex Always Appreciates” Myth Is Fading
The pandemic-era boom pushed some references — the Daytona above all — to speculative highs disconnected from historical norms. Since the March 2022 peak, steel sports models have compressed meaningfully, and dealers who bought inventory near the top have in some cases faced 20–40% markdowns on liquidation. The lesson for 2026 buyers: Rolex as a category is not a monolith. Value retention depends heavily on specific reference, condition, and whether the piece comes with box and papers (“full set”).
What’s Actually Driving 2026 Strength
- Retail price increases raise the floor. When a new Submariner retails at $10,050 (up from $9,500), a pre-owned example at $11,000–$12,000 suddenly represents a smaller premium — narrowing the gap without secondary prices actually moving.
- Supply discipline remains Rolex’s core lever. The brand has never confirmed production numbers, and secondary-market premiums remain entirely a function of Rolex’s own manufacturing decisions — a risk factor as much as a support.
- Certified Pre-Owned rollout. Rolex’s now fully rolled-out CPO program has changed how buyers transact in the used market, adding a layer of brand-verified legitimacy that supports pricing.
The Case for Rolex as a Portfolio Diversifier
Financial advisors increasingly frame luxury watches not as a replacement for equities or bonds, but as a tangible, historically low-correlation diversifier — one that carries its own risks (illiquidity, condition-dependent pricing, no yield) but has demonstrated multi-decade resilience for specific references.
Is Rolex a good investment in 2026?
It depends heavily on the specific reference. Steel sports models like the Submariner and Daytona have held or grown in value; two-tone and widely available dress models generally have not. Overall, Rolex’s secondary market rose about 7.9% year-over-year in 2026, trailing Patek Philippe but ahead of Audemars Piguet.
Discover more from The Economy
Subscribe to get the latest posts sent to your email.

Navigating Mortgage and Loan Refinancing in a High-Yield Environment
Global public debt crossing critical thresholds has kept central bank policies volatile, resulting in fluctuating US Treasury yields throughout 2026. For homeowners and commercial property holders burdened by previous high-interest borrowing cycles, finding optimal refinance windows has become a high-stakes financial puzzle. Stalled disinflation and stubborn employment numbers mean rate cuts are incremental, requiring borrowers to act with precision.
Timing your mortgage or commercial loan refinance in this environment requires a deep understanding of yield curve movements and lender risk appetites.
Decoding 2026 Refinance Dynamics
The 10-Year Treasury Yield Benchmark
Mortgage rates continue to track closely with the 10-year US Treasury yield. When macroeconomic anxiety spikes debt issuance, yields rise, tightening consumer borrowing capacity. Savvy borrowers monitor weekly Treasury auctions to lock in rates during brief dip windows.
Hybrid ARMs and Alternative Structures
With fixed rates remaining elevated, 7/1 and 10/1 adjustable-rate mortgages (ARMs) have surged in popularity. These products offer lower initial monthly payments, giving borrowers breathing room until central bank easing cycles fully materialize.
| Loan Product | Current Rate Range | Best For | Key Risk Factor |
| 30-Year Fixed Mortgage | 6.2% – 6.8% | Long-term predictability | Higher initial monthly outlay |
| 7/1 Hybrid ARM | 5.5% – 5.9% | Short-term ownership / flipping | Rate reset risk after year 7 |
| Commercial Refinance | 7.0% – 8.2% | Corporate asset restructuring | Strict DSCR lender covenants |
Actionable Steps for Successful Refinancing
To maximize your chances of securing favorable refinance terms in a volatile market, follow a disciplined preparation strategy.
Boost Your Credit Score Immediately: Lenders in 2026 are applying stringent credit tiering; a 20-point increase can drop your APR by a crucial quarter-point.
Shop Regional Credit Unions: Smaller financial institutions often offer portfolio loans with more flexible underwriting than major national banks.
Calculate the Break-Even Point: Ensure your total closing costs are recouped through monthly savings within 24 months of closing.
“Market Strategist View: Refinancing in 2026 is an exercise in opportunistic timing. Borrowers must maintain immaculate financial profiles ready to strike the moment Treasury yields dip.”
Mastering the complexities of today’s debt environment ensures you can successfully lower your debt service costs and protect your long-term financial stability.
Discover more from The Economy
Subscribe to get the latest posts sent to your email.

The days of pulling generic auto insurance quotes based purely on your zip code and age are officially over. In 2026, insurance comparison engines are powered entirely by generative AI and real-time telematics. These platforms digest thousands of live data points—ranging from your driving smoothness via connected vehicle sensors to real-time traffic congestion patterns—to generate hyper-personalized premiums instantly.
For consumers, this evolution represents both a massive opportunity for savings and a hidden trap for penalty pricing. Understanding how AI algorithms evaluate risk is essential for anyone looking to lower their monthly auto insurance premiums.
How AI Comparison Engines Evaluate Your Risk Profile
Behavioral Telematics and Connected Cars
Modern cars stream performance data directly to insurance aggregators. Generative AI models analyze braking sharpness, acceleration curves, cornering G-forces, and phone distraction metrics. Drivers who maintain smooth, defensive habits are rewarded with dynamic rate cuts of up to 40% compared to traditional rating tiers.
Predictive Traffic and Weather Modeling
AI tools now cross-reference your daily commute route with predictive weather and accident probability models. If your standard parking location or driving corridor has a statistically higher incidence of uninsured motorist claims, your quotes will reflect that hyper-local risk assessment.
| Comparison Factor | Traditional Rating Model | 2026 Generative AI Model | Impact on Premium |
| Mileage & Usage | Annual estimated odometer reading | GPS tracking & live trip duration | High (up to 35% savings) |
| Driving Behavior | MVR driving record & accidents | Real-time braking, speed, & G-force | Critical (determines tier) |
| Vehicle Tech | Make, model, and safety rating | ADAS calibration & repair cost data | Moderate |
Strategies to Lower Your AI-Driven Insurance Quote
To outsmart the algorithm and secure the lowest possible premium in 2026, drivers must proactively manage their digital footprint on insurance platforms.
Opt-In for Telematics Trial Periods: Many insurers offer immediate 15% discounts just for installing their driving app; let it track safe habits for 30 days to lock in permanent savings.
Scrub Unverified Public Records: Ensure your motor vehicle report is free of clerical errors that AI risk models misinterpret as reckless behavior.
Compare AI Aggregators: Use platforms that integrate multi-carrier API feeds rather than single-brand comparison sites to find the best risk-adjusted rate.
“Industry Note: AI-driven pricing rewards transparency and precision. Drivers who actively manage their telematics data consistently out-save those relying on legacy quote calculators.”
Embracing AI comparison tools allows savvy policyholders to customize coverage limits precisely to their driving habits, eliminating wasted premium spend while ensuring robust protection.
Discover more from The Economy
Subscribe to get the latest posts sent to your email.

Money News: How to Protect Your Portfolio From Global Inflation

World Bank Projections: Emerging vs. Big Economies of Asia

IMF Reports 2026: What the Latest Data Means for the Global Economy

Singapore Stocks Outlook: A Safe Haven in the Asian Market?

China Stocks vs. Japan Stocks: Where Should You Invest in Late 2026?

VIX Index Explained: How to Trade Wall Street’s Fear Gauge Today

Commercial vs Residential Real Estate: Which Wins in 2026?

Presidential Stock Market Performance: How Trump’s Second Term Compares to History

2026 Real Estate Market News: Are We Heading for a Correction?

Bitcoin Price Forecast 2026–2027: Will the 4-Year Cycle Hold?

Fidelity Crypto vs. Traditional Brokerages: A Guide for Modern Investors

The 2026 Global Smartphone Market: AI Integration and Competitor Analysis

SpaceX IPO: How Aerospace Is Reshaping Tech Startup News

Fidelity Investments Review: Maximizing Returns in a Volatile Stock Market

US-China Relations in Q3 2026: Trade Tariffs and Supply Chain Risks

Top 30 Stocks for Investment in PSX for Massive ROI in 2026

SpaceX Starship Flight 14: First Orbital Attempt & Starlink V3 Launch Explained

The 2026 Crypto Regulatory Shift: What It Means for Institutional Investors

AI Chip Stocks 2026: The Best Semiconductor Investments Beyond Marvell

Tween Back-to-School Trends 2026: What’s Driving the $85B Season

AI-Powered Training: The Next Multi-Billion Dollar Ecosystem in Fitness

Oil Prices Break $100 in 2026: Middle East Conflict & Energy Markets

10-Year Treasury Yield Hits 4.80%: What It Means for Rates & Portfolios

Fidelity Investments Review 2026: SPAXX Yields & Zero-Fee Funds

BRICS+ Cross-Border Payments 2026: Interoperability Explained

Shein Clothes Quality & Safety in 2026: What Lab Tests Show

MRVL Earnings 2026: Why Marvell Sank Despite Beating Estimates

China’s US$10.8 Billion Trade Shortcut: Why the Pinglu Canal Matters
-

 Markets & Finance9 months ago
Top 15 Stocks for Investment in 2026 in PSX: Your Complete Guide to Pakistan’s Best Investment Opportunities
-

 Analysis7 months ago
Johor’s Investment Boom: The Hidden Costs Behind Malaysia’s Most Ambitious Economic Surge
-

 Analysis7 months ago
Top 10 Stocks for Investment in PSX for Quick Returns in 2026
-

 Analysis8 months ago
Brazil’s Rare Earth Race: US, EU, and China Compete for Critical Minerals as Tensions Rise
-

 Banks8 months ago
Best Investments in Pakistan 2026: Top 10 Low-Price Shares and Long-Term Picks for the PSX
-

 Investment8 months ago
Top 10 Mutual Fund Managers in Pakistan for Investment in 2026: A Comprehensive Guide for Optimal Returns
-

 Global Economy9 months ago
15 Most Lucrative Sectors for Investment in Pakistan: A 2025 Data-Driven Analysis
-

 Global Economy9 months ago
Pakistan’s Export Goldmine: 10 Game-Changing Markets Where Pakistani Businesses Are Winning Big in 2025