
Investment
Fidelity Investments Review: Maximizing Returns in a Volatile Stock Market

Fidelity is one of the largest retail brokerages in the United States. It competes on low costs, broad product choice and research tools.
Volatile markets raise the stakes. Fees, diversification and behavior all affect what you keep. This review looks at where Fidelity helps and where it falls short.
Low barriers: Fidelity has $0 account minimums, $0 commissions on online US stocks and ETFs, and fractional shares from $1.
Watch the fees: A $49.95 fee applies to non-Fidelity mutual funds.
Crypto is separate: Trading requires a distinct account and carries a 1% fee.
Best for: Long-term investors, retirement savers and beginners.
Returns depend on you: Costs and diversification are controllable. Market direction is not.
| Feature | Details |
| Account minimum | $0 |
| Stock and ETF commissions | $0 online |
| Fractional shares | From $1 |
| Account types | Brokerage, Roth IRA, Traditional IRA, cash management |
| Crypto | Separate account; 1% fee |
| Non-Fidelity mutual funds | $49.95 transaction fee |
Fees can change. Confirm the current schedule on Fidelity’s website before you fund an account.
There are no maintenance fees on standard retail accounts, and trading costs are minimal for most investors. The account opening process was verified as straightforward in September 2026.
Index Funds With Very Low Fees
Fidelity is known for low-cost index funds, including its “ZERO” funds. Cutting expenses is one of the most reliable ways to protect long-term returns.
The platform provides research reports, screeners and learning content. That helps both beginners and experienced investors.
Fidelity supports IRAs and workplace plans. If you already have a 401(k) there, keeping everything in one place simplifies planning.
Learning curve. The full site can feel dense if you only want a simple app.
Crypto costs. A 1% fee is high compared with dedicated exchanges.
Mutual fund fees. Buying non-Fidelity funds can cost $49.95 per trade.
Limited coin choice. The crypto menu is small.
How to Protect Returns in a Volatile Market
Volatility is normal. Behavior during it matters more than any platform. These practices help.
Diversify. Combine stocks, bonds and cash instead of relying on one theme or stock. Recent mega-cap listings and AI-linked shares have moved sharply, so concentrated positions can swing hard.
Keep costs low. Even a 1% annual fee can consume a large share of long-term gains.
Automate contributions. Regular investing removes the urge to time the market.
Rebalance yearly. Selling some winners and buying laggards restores your target mix.
Hold cash for near-term needs. Money needed within a few years should not sit in stocks.
Use tax-advantaged accounts first. IRAs and 401(k)s shield growth from current taxes.
| Goal | Common Approach |
| Long-term growth | Broad US and international index funds |
| Stability | Bond funds and cash reserves |
| Speculation | A small, capped slice for crypto or single stocks |
This is an illustration, not a recommendation. The right mix depends on your age, goals and risk tolerance.
Good fit: Beginners, buy-and-hold investors and anyone building retirement savings.
Weaker fit: Active crypto traders and investors who want the most advanced trading tools.
What This Means for the Global Market in 2027
Reviews often stop at a feature list. Here is what to watch.
Fee pressure will continue. Competition among brokerages should keep pushing costs toward zero. Compare all-in costs, not headlines.
Digital assets will move into the mainstream. Expect more crypto products inside traditional platforms. Fees may fall as competition grows.
Personalization and AI tools. Brokerages are adding automated guidance. Judge these tools by fees and transparency.
Rates and inflation drive returns. Interest rate direction affects both bond and stock valuations.
Global diversification matters. With market leadership rotating, spreading investments across regions may reduce concentration risk.
Is Fidelity a good broker for beginners?
Yes. Fidelity has no account minimums, $0 online stock and ETF commissions and fractional shares from $1.
Does Fidelity charge account fees?
Standard retail accounts have no maintenance fee. Some transactions, such as non-Fidelity mutual funds, carry a $49.95 fee.
Can you buy crypto on Fidelity?
Yes, through a separate crypto account with a 1% trading fee. You can also hold spot crypto funds in a regular account.
How can I protect my portfolio in a volatile market?
Diversify, keep costs low and invest regularly. Avoid reacting to short-term swings.
Discover more from The Economy
Subscribe to get the latest posts sent to your email.


Key Takeaways
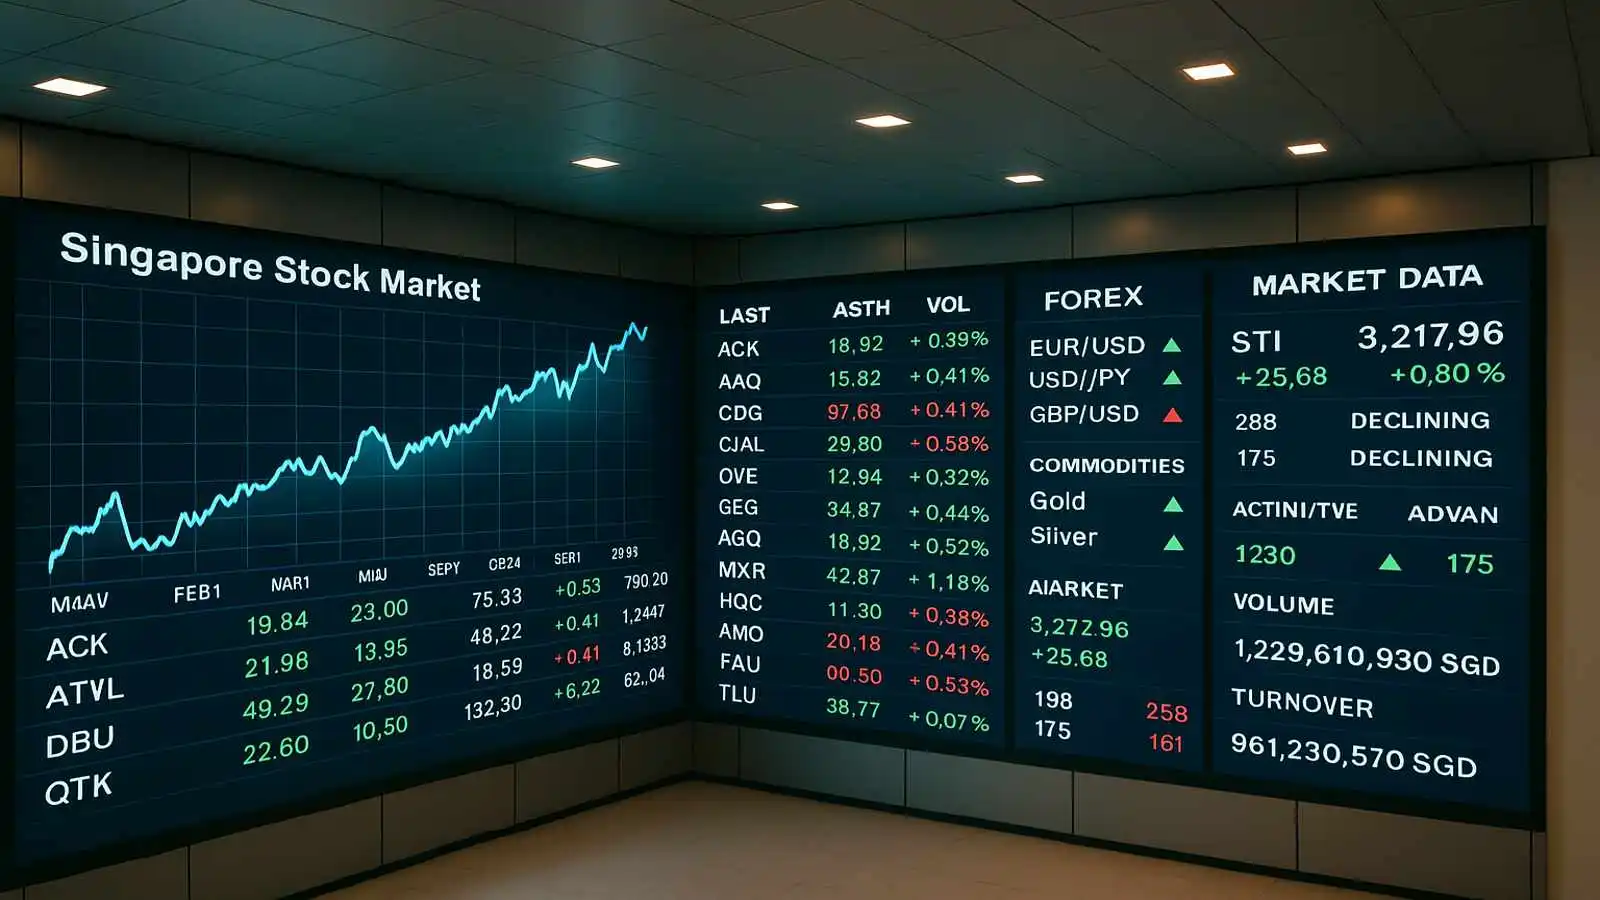
- The Straits Times Index (STI) has set repeated all-time highs through 2026 — from around 4,900 in January to a record 5,801.96 on September 4, 2026, a roughly 35% year-over-year gain.
- Banking heavyweights DBS, OCBC, and UOB have powered most of the rally, with DBS posting record Q2 2026 net profit of S$3.08 billion (up 9% year-over-year) on total income that crossed S$6 billion for the first time in a single quarter.
- SGX’s FY2026 results (July 2025–June 2026) show securities turnover up 35% year-over-year to S$455.7 billion, with retail investors net buyers of Singapore equities for five consecutive months.
- Analysts increasingly describe Singapore equities’ rally as driven by genuine “safe-haven” demand — investors rotating into the market specifically for its perceived stability amid regional and geopolitical uncertainty, not just cheap valuations.
- The risk flagged by several local commentators: a record-high market concentrated heavily in one sector (banks) raises the cost of over-allocating to what’s already led the run.
The STI’s 2026 Climb, Month by Month
| Date | STI Level | Context |
|---|---|---|
| Jan 30, 2026 | 4,934 (record) | Broad economic optimism, 4.8% 2025 GDP growth |
| Apr 9, 2026 | 5,000 (crossed) | First time above the 5,000 mark |
| May 22, 2026 | 5,068.15 | Banking and industrial stocks lead |
| Jun 25, 2026 | 5,218.96 | SGX FY2026 turnover surge |
| Jul 8, 2026 | 5,339.59 (intraday) | Institutional inflows accelerate |
| Jul 15, 2026 | 5,559.72 (record close) | Continued rally |
| Sep 4, 2026 | 5,801.96 (record close) | ~35% gain over trailing year |
Why Singapore Keeps Attracting “Safe Haven” Flows
Unlike a pure valuation story, Singapore’s 2026 rally has been repeatedly described by market commentators as safe-haven driven — investors specifically seeking Singapore’s institutional stability, currency credibility, and banking-sector strength during a year marked by Middle East conflict, tariff shocks, and volatile crypto and U.S. equity markets. The Monetary Authority of Singapore’s S$6.5 billion expansion of its Equity Development Programme (EQDP) has also directly funneled institutional capital into local equities.
The Bank Trio Driving the Rally
- DBS Group — Singapore’s largest bank, with a footprint across 19 markets. Q2 2026 total income crossed S$6 billion for the first time in a single quarter; net profit hit a record S$3.08 billion, up 9% year-over-year, even as net interest income slipped slightly.
- OCBC and UOB — Both have repeatedly led single-session STI gains alongside DBS, reinforcing the narrative that Singapore’s rally is fundamentally a banking-sector story with industrials and REITs participating at the margins.
The Case for Caution at Record Highs
Local commentary has been notably measured rather than euphoric: markets sit at all-time highs roughly a third of the time historically, and forward returns after a new high haven’t been meaningfully worse than at other times. The more practical risk flagged: a sharp rally can quietly shift a portfolio’s asset allocation (e.g., from a 70/30 equity/bond split to 80/20) without any active decision — a case for periodic rebalancing rather than either chasing or avoiding the rally outright.
Why are Singapore stocks considered a safe haven in 2026?
The Straits Times Index has hit repeated record highs in 2026 (reaching 5,801.96 by September), driven largely by record bank earnings from DBS, OCBC, and UOB. Analysts attribute much of the rally to genuine safe-haven demand from investors seeking institutional stability amid global geopolitical and market volatility, rather than valuation alone.
Discover more from The Economy
Subscribe to get the latest posts sent to your email.
Key Takeaways
- The U.S. government holds an approximately 10% passive equity stake in Intel, acquired around $20.47/share in August 2025 as part of a finalized CHIPS Act arrangement — a stake now up tens of billions of dollars on paper.
- Intel shares are reportedly up over 160% year-to-date in 2026, driven by pricing changes, AI partnerships, and manufacturing progress.
- Wall Street’s median 12-month price target sits near $110, though the full analyst range spans roughly $75–$200 — an unusually wide dispersion reflecting genuine disagreement about the foundry bet.
- Intel’s 18A manufacturing node is now in high-volume production, with Panther Lake as the first shipping product and external customers reportedly engaging Intel Foundry for next-generation nodes.
- Intel plans to raise PC CPU prices roughly 10% starting in early October 2026 — a margin-protection move rather than a volume play.
Why the Government Is a Shareholder
Following disruptions to the domestic chip supply chain and the 2022 CHIPS Act, Washington took the unusual step of converting some of Intel’s federal support into direct equity — around a 10% stake — with conditions that Intel keep its foundry business intact for at least five years. The rationale: a viable, U.S.-based advanced-logic manufacturer is treated as a national security asset, not just a commercial one, given how concentrated advanced chip manufacturing has become in Taiwan.
That backing functions as a floor under the stock in a way few other semiconductor names have — Intel effectively carries “national champion” status, with preferential access to defense and classified workloads as part of the arrangement.
The Foundry Turnaround, By the Numbers
| Metric | Status (2026) |
|---|---|
| 18A node | In high-volume production; Panther Lake shipping |
| U.S. government stake | ~10%, acquired ~$20.47/share |
| YTD stock performance | Reportedly +160%+ |
| Analyst price target range | $75–$200 (median ~$110) |
| Planned CPU price increase | ~10%, effective early October 2026 |
Intel’s Foundry division has posted multi-billion-dollar operating losses in recent years as external customer revenue continues to lag internal demand — the central risk in the bull case.
The Bull Case
- Intel is targeting roughly 20% of the world’s most advanced logic manufacturing capacity by late 2026, positioning it as the only credible U.S.-based alternative to Taiwan-concentrated advanced-node production.
- Government backing (CHIPS Act equity, SoftBank investment, NVIDIA partnership signals) de-risks the multi-year capital intensity of the foundry buildout.
- Rising global chip demand — the World Semiconductor Trade Statistics organization has projected sharp growth in overall chip sales, with memory pricing acting as a particular tailwind — supports the broader sector even if Intel-specific execution lags.
The Bear Case
- Foundry losses remain large, and external customer revenue — the metric that would validate the “TSMC-style” foundry model — still lags well behind internal Intel demand.
- Heavy, sustained capital expenditure (north of $20 billion annually) pressures free cash flow regardless of top-line improvement.
- The wide analyst target dispersion ($75–$200) itself signals that Wall Street has not reached consensus on whether the turnaround is durable or a government-subsidized reprieve.
Is Intel stock a buy in 2026?
Analyst opinion is split: Intel’s median 12-month price target is roughly $110, but targets range from $75 to $200, reflecting disagreement over whether its government-backed foundry turnaround (18A node, external customer wins) offsets continued foundry losses and heavy capital spending.
Discover more from The Economy
Subscribe to get the latest posts sent to your email.

Key Takeaways
- The benchmark 10-year US Treasury yield briefly touched 5.014% on Monday, September 14, 2026 — its first move above the psychologically important 5% threshold since October 2023, and only its second time above that level since the 2007-2008 financial crisis.
- The move came just two days before the Federal Reserve’s September policy meeting, with markets now pricing roughly a 90% probability of a rate hike rather than a cut, according to CME Group’s FedWatch tool.
- The catalyst combines several forces at once: Brent crude topping $109/barrel, a hotter-than-expected August CPI report, swelling government and corporate borrowing needs, and a possible unwinding of the Japanese yen carry trade as Japanese rates climb.
- The 30-year Treasury yield reached 5.386%, directly affecting mortgage pricing, while 10-year yields in the UK and Australia have also climbed above 5% — signaling this is a global, not purely American, bond-market phenomenon.
- Veteran market strategist Ed Yardeni notes that neither the yield spike nor the global bond selloff has “broken” the stock market’s bull run so far, crediting continued strength in corporate earnings.
For the first time in nearly three years, the interest rate that anchors global borrowing costs — the US 10-year Treasury yield — has crossed the symbolically important 5% threshold. The move, which arrived just 48 hours before the Federal Reserve’s September policy decision, is rippling through mortgage markets, equity valuations, and central bank calculations from Washington to Tokyo. Here’s what actually happened, why, and what it means for anyone watching the stock market today.
What Happened
The 10-year Treasury yield climbed as high as 5.014% intraday on Monday, September 14, 2026, before paring the move back to around 4.94–4.99% by afternoon trading. It marked the first time the yield had crossed 5% during a trading session since October 23, 2023, and — as several outlets noted — only the second time it has traded this high since July 2007, just before the global financial crisis. A close above 5.02% would represent the highest level since that pre-crisis period.
The move wasn’t isolated to the 10-year note. The 2-year Treasury yield, which is more directly sensitive to near-term Fed policy, climbed to 4.679%, surpassing its previous July 2024 high. The 30-year yield — the benchmark most directly tied to fixed mortgage rates — touched 5.386% before paring some of its gains.
Why Yields Are Spiking: Four Forces Converging
1. Oil-driven inflation fears. Brent crude climbed to a session high past $109 a barrel as fighting between the US and Iran escalated, directly feeding into bond investors’ inflation expectations. Rising energy costs erode the fixed returns bondholders receive, pushing yields higher to compensate.
2. A hotter-than-expected inflation print. Friday’s August CPI report showed inflation running hotter than markets had anticipated. Goldman Sachs’ chief economist David Mericle wrote that while the report didn’t change the bank’s underlying inflation view, it pushed market pricing of a Fed rate hike this week to nearly 90% — a striking reversal from earlier-year expectations of continued rate cuts.
3. Swelling government and corporate borrowing. The yield spike is also being driven by basic supply-and-demand dynamics in the bond market: both the federal government and major corporations are issuing substantial new debt to fund spending, adding to the overall supply of bonds competing for investor capital.
4. A potential yen carry-trade unwind. Yardeni Research has floated a more technical explanation with global implications: as Japanese interest rates rise and the yen strengthens (partly on Japan’s own defense-spending and monetary-policy shifts), the long-popular “carry trade” — in which investors borrow cheaply in yen and invest in higher-yielding assets elsewhere — becomes less attractive. Unwinding those positions could be contributing to selling pressure across global bond markets, not just US Treasuries.
Global Context: This Isn’t Just an American Story
The yield surge isn’t confined to the US. Ten-year yields in both Australia and the UK have also climbed above 5%, reinforcing that this is a broader global bond-market repricing rather than a US-specific event. Yardeni’s assessment captures the moment’s tension well: a global yield spike of this magnitude “would normally be enough to break a global bull market in stocks. Neither has so far” — crediting resilient corporate earnings for equities’ relative calm despite the bond turmoil.
Rate Decision Timing: Why This Matters So Much Right Now
The timing amplifies the significance considerably. The yield spike landed just two days ahead of the Federal Reserve’s September policy meeting, transforming what might otherwise be a notable but contained bond-market move into a live variable in the Fed’s own deliberations. According to CME Group’s FedWatch tool, the probability of a rate hike this week has climbed above 90%, while Polymarket bettors have priced the same outcome at around 80%. Some market watchers are also monitoring rising tension between President Trump and Fed Chair Kevin Warsh as a wildcard factor in how the central bank navigates the decision.
Yield Snapshot
| Maturity | Peak Yield (Sept 14, 2026) | Significance |
|---|---|---|
| 2-year Treasury | 4.679% | Highest since July 2024; most Fed-sensitive |
| 10-year Treasury | 5.014% | First above 5% since October 2023 |
| 20-year Treasury | 5.426% | Sensitive to geopolitical risk |
| 30-year Treasury | 5.386% | Benchmark for mortgage rates |
Why This Matters: Mortgages, Portfolios, and the Fed’s Next Move
For everyday borrowers, the 30-year yield’s climb toward 5.4% translates fairly directly into higher fixed mortgage rates, making home purchases and refinancing meaningfully more expensive than earlier in 2026. For equity investors, the key question is whether corporate earnings can continue outrunning the drag from higher borrowing costs — the dynamic Yardeni credits for the stock market’s calm so far. And for the Fed, Wednesday’s decision now carries outsized weight: a hike would validate the bond market’s current pricing, while a hold could trigger further yield volatility if investors interpret it as the central bank falling behind an inflation trend that oil prices and geopolitical tension are actively worsening.
Frequently Asked Questions
Why did the 10-year Treasury yield cross 5% in September 2026?
The move was driven by a combination of surging oil prices tied to the escalating US-Iran conflict, a hotter-than-expected August CPI report, heavy government and corporate bond issuance, and a possible unwinding of the yen carry trade as Japanese rates rise.
How does a 5% Treasury yield affect mortgage rates?
The 30-year Treasury yield, which climbed to 5.386% alongside the 10-year’s move, is the most direct benchmark for 30-year fixed mortgage rates, meaning this yield spike is likely pushing mortgage borrowing costs higher for US homebuyers.
Will the Federal Reserve raise interest rates this week?
As of the yield spike, markets were pricing roughly a 90% probability of a rate hike at the Fed’s September meeting, according to CME Group’s FedWatch tool — a sharp reversal from earlier expectations of rate cuts.
Discover more from The Economy
Subscribe to get the latest posts sent to your email.

The 2026 Global Smartphone Market: AI Integration and Competitor Analysis

SpaceX IPO: How Aerospace Is Reshaping Tech Startup News

Fidelity Investments Review: Maximizing Returns in a Volatile Stock Market

How Crypto Transformed the Trump Fortune: A $1.4 Billion Financial Breakdown

Global Pension Systems Ranked: The World’s Best and Worst Retirement Frameworks

Global Supply Chain Vulnerabilities: From Eurasian Trade Corridors to Food Consumer Recalls

Why 5% U.S. Treasury Yields Signal a Global Market Regime Shift.

Federal Reserve Defies White House Pressure: Inside Trump’s Demand for Sub-1% Interest Rates After Historic 2026 Rate Hike

How Rising Interest Rates Impact Gig Economy Apps: DoorDash, Uber, and Urban Services

GasBuddy Market Insights: How Crude Price Shifts Impact Local Fuel Cost Averages

DoorDash Driver Payouts, Fee Structures, and Market Competition Analysis

OPINION:Breaking the 3.5% Growth Trap: How Pakistan Can Build a High-Productivity Export Economy

Global Equity Market Divergence: US Tech vs. European Dividend Stocks vs. Asian Growth

Asian Markets Analysis: Navigating Volatility in China, Japan, and Singapore Stocks

State Farm’s $5B Dividend 2026: Who Qualifies & Payout Dates

US-China Relations in Q3 2026: Trade Tariffs and Supply Chain Risks

SpaceX Starship Flight 14: First Orbital Attempt & Starlink V3 Launch Explained

Top 30 Stocks for Investment in PSX for Massive ROI in 2026

The 2026 Crypto Regulatory Shift: What It Means for Institutional Investors

AI Chip Stocks 2026: The Best Semiconductor Investments Beyond Marvell

AI-Powered Training: The Next Multi-Billion Dollar Ecosystem in Fitness

Tween Back-to-School Trends 2026: What’s Driving the $85B Season

Oil Prices Break $100 in 2026: Middle East Conflict & Energy Markets

10-Year Treasury Yield Hits 4.80%: What It Means for Rates & Portfolios

Fidelity Investments Review 2026: SPAXX Yields & Zero-Fee Funds

Shein Clothes Quality & Safety in 2026: What Lab Tests Show

MRVL Earnings 2026: Why Marvell Sank Despite Beating Estimates

China’s US$10.8 Billion Trade Shortcut: Why the Pinglu Canal Matters
-

 Markets & Finance9 months ago
Top 15 Stocks for Investment in 2026 in PSX: Your Complete Guide to Pakistan’s Best Investment Opportunities
-

 Analysis7 months ago
Johor’s Investment Boom: The Hidden Costs Behind Malaysia’s Most Ambitious Economic Surge
-

 Analysis7 months ago
Top 10 Stocks for Investment in PSX for Quick Returns in 2026
-

 Analysis7 months ago
Brazil’s Rare Earth Race: US, EU, and China Compete for Critical Minerals as Tensions Rise
-

 Banks8 months ago
Best Investments in Pakistan 2026: Top 10 Low-Price Shares and Long-Term Picks for the PSX
-

 Investment8 months ago
Top 10 Mutual Fund Managers in Pakistan for Investment in 2026: A Comprehensive Guide for Optimal Returns
-

 Global Economy9 months ago
15 Most Lucrative Sectors for Investment in Pakistan: A 2025 Data-Driven Analysis
-

 Global Economy9 months ago
Pakistan’s Export Goldmine: 10 Game-Changing Markets Where Pakistani Businesses Are Winning Big in 2025