
Markets & Finance
Presidential Stock Market Performance: How Trump’s Second Term Compares to History

Executive Summary: Since the November 5, 2024, presidential election, the U.S. stock market has navigated trade policy shifts, fluctuating tariff structures, and shifting interest rate expectations. Despite a sharp ~20% drawdown in early 2025, the S&P 500 generated a total return of 36.0% through September 2026, according to performance tracking from U.S. Bank Wealth Management.
While headline figures show strong market resilience, understanding how this performance ranks against modern predecessors—including Joe Biden, Barack Obama, Bill Clinton, and Ronald Reagan—requires examining underlying corporate earnings, market breadth, and Federal Reserve policy dynamics.
Historical Benchmark: S&P 500 Returns Across Modern Administrations
To accurately compare presidential stock market records, performance must be evaluated across full 4-year terms alongside cumulative mid-term benchmarks. Historical index data compiled by S&P Dow Jones Indices and analyzed by Schroders Investment Management shows that markets have historically trended upward regardless of party affiliation, averaging an annual total return of over 12% since 1946.
| Administration & Term | Period | S&P 500 Total Return (4-Year) | Cumulative 22-Mo. Benchmark | Primary Market Driver / Context |
|---|---|---|---|---|
| Ronald Reagan (Term 2) | 1985–1988 | +91.8% | +32.4% | Post-inflation recovery & 1980s tax restructuring |
| Bill Clinton (Term 1) | 1993–1996 | +88.6% | +21.2% | Early tech adoption & productivity boom |
| Bill Clinton (Term 2) | 1997–2000 | +88.6% | +48.1% | Dot-com expansion |
| Barack Obama (Term 1) | 2009–2012 | +85.1% | +41.5% | Post-Global Financial Crisis market rebound |
| Donald Trump (Term 1) | 2017–2020 | +81.3% | +24.8% | Tax Cuts and Jobs Act of 2017 & deregulation |
| Joe Biden | 2021–2024 | +66.3% | +18.4% | Post-pandemic stimulus & Tech/AI mega-cap surge |
| Barack Obama (Term 2) | 2013–2016 | +52.9% | +28.6% | Steady economic expansion & low interest rates |
| Donald Trump (Term 2) | 2025–2026 (In Progress) | N/A | +36.0% | Corporate earnings growth, domestic energy, & tech resilience |
Core Drivers of the 2025–2026 Equity Rally
1. Fundamental Earnings Growth Beat Expectations
Unlike market cycles driven purely by price-to-earnings (P/E) valuation expansion, the equity gains during 2025 and 2026 have been anchored in corporate earnings execution. S&P 500 second-quarter revenue grew over 16% year-over-year, while quarterly earnings surged 53%, more than doubling initial Wall Street forecasts. Third-quarter projections compiled by research teams at Bloomberg indicate sustained top-line revenue growth near 12% and earnings growth of 28%.
2. Market Rotation and Small-Cap Expansion
A notable divergence in Trump’s second term compared to earlier cycles is the broadening of market participation beyond mega-cap technology companies (“The Magnificent Seven”):
- Small-Cap Performance: The Russell 2000 and broader small-cap indices surged 60%+ from their April 2025 lows through September 2026.
- Sector Diversification: Financials, domestic industrials, and energy sectors saw accelerated inflows following regulatory easing and domestic energy development policies.
3. Institutional Volatility and Unprecedented Portfolio Activity
The market landscape in 2025 and 2026 has been marked by high policy-driven volatility. Disclosures analyzed by CBS News Financial Analysis and reporting from Reuters revealed unprecedented trading volume within executive investment accounts, executing thousands of transactions across defense, technology, real estate, and energy sectors during key legislative shifts.
Stay Ahead of the Markets
Subscribe to our free daily newsletter for institutional-grade analysis on how macroeconomic policies impact your portfolio.
Macro Economic Headwinds: Rates, Debt, and Inflation
While stock indices sit near historic highs, structural macroeconomic challenges remain. Here is a snapshot of the current macroeconomic realities:
- Elevated Federal Debt Costs: Data from the Federal Reserve Bank of St. Louis (FRED) highlights that the average interest rate on marketable U.S. Treasury debt climbed to 3.44%, compared to 1.42% in 2022. This elevation increases federal debt service obligations as maturing Treasury notes are refinanced at higher prevailing yields.
- Consumer Spending Shifts: Retail sales grew 5.0% year-over-year, though monthly momentum slowed. Wage growth at 3.2% provides ongoing income expansion but remains closely balanced against cumulative consumer price levels.
Analytical Summary: Wall Street vs. White House Context
Historical market analysis published by Morgan Stanley demonstrates that political leadership is only one of many variables driving long-term equity returns. Key takeaways for investors include:
- Policy vs. Fundamentals: Short-term market swings frequently respond to trade declarations, tariffs, and executive actions, but multi-year equity performance remains dictated by corporate earnings, cash flows, and monetary policy.
- Divided Government Advantages: Historically, markets under both Democratic and Republican presidents have posted above-average gains during periods of divided congressional control, which tends to limit radical fiscal shifts.
- Portfolio Discipline: Rebalancing asset allocations and maintaining broad sector diversification remains the primary protection against political and geopolitical market cycles.
What are your thoughts on the market’s response to recent trade policies? Share your perspective in the comments below, or check out our detailed breakdown of sector-by-sector performance in 2026.
Discover more from The Economy
Subscribe to get the latest posts sent to your email.


Markets & Finance
Dow Futures vs Dow Jones: What E-mini Contracts Really Tell You Before Wall Street Opens
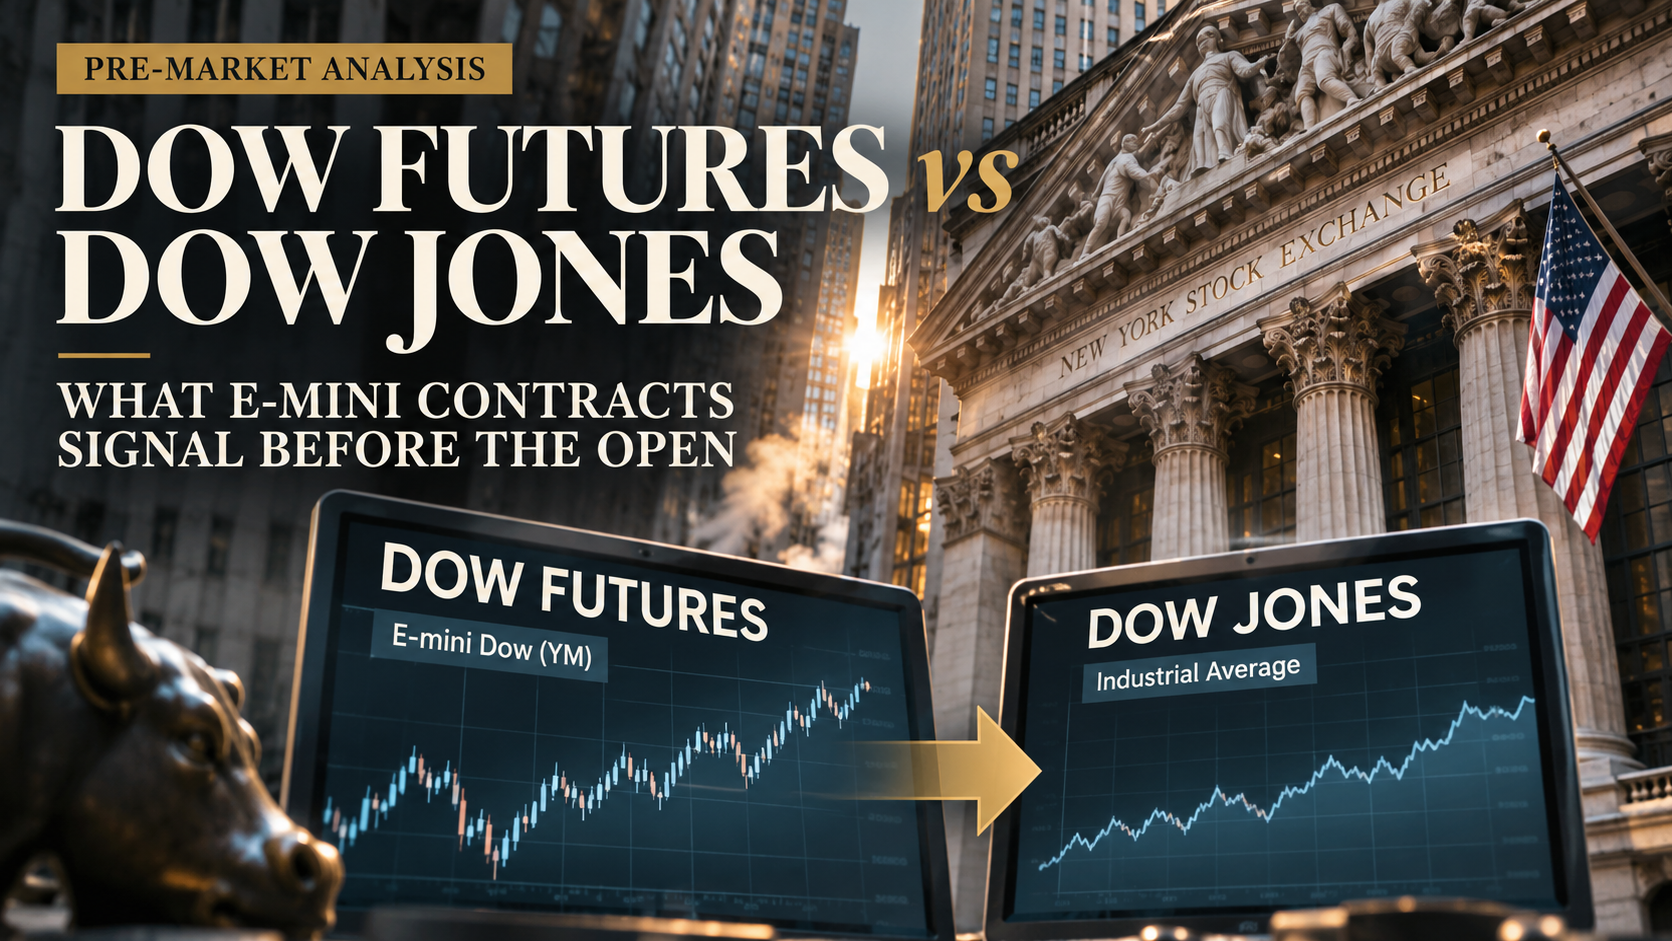
The Dow Jones Industrial Average (DJIA) is a calculated, price-weighted index of 30 major U.S. stocks. Dow futures are exchange-traded derivatives whose value is linked to that index. The most commonly referenced Dow futures product, the E-mini Dow (YM), has a $5 contract multiplier per index point; the smaller Micro E-mini Dow (MYM) uses $0.50 per point. Both can trade outside the regular cash-stock session, so a Dow futures price is not necessarily the same as the Dow’s last closing value. These details come from S&P Dow Jones Indices and CME Group’s equity-futures comparison.
This distinction often disappears in financial headlines. A reader sees ‘Dow futures up 200 points’ on a Wednesday morning and assumes the Dow Jones Industrial Average has already risen 200 points. The cash market may not have opened yet. What changed was the price of a derivative contract, as buyers and sellers adjusted positions before the underlying stock-market session.
Understanding the difference is useful even if you never trade futures. It helps interpret breaking financial news, compare overnight market risk and avoid confusing a leveraged contract’s profit-and-loss mechanics with the performance of a familiar stock index.
Start with the Dow Jones Industrial Average.
The DJIA is not a company, exchange or financial product you can buy directly. It is an index calculated from the share prices of 30 selected U.S. blue-chip companies. It began in 1896; the index expanded to 30 constituents in 1928, according to the index provider’s historical overview.
Unlike the S&P 500’s familiar float-adjusted market-capitalisation approach, the Dow is price-weighted. Broadly, a $300 stock has more index influence than a $60 stock before accounting for the index’s divisor and other calculation details. A high-priced company’s daily movement can therefore affect the Dow more than the movement of a lower-priced company whose total market value might be higher.
The official DJIA factsheet and profile describe the Dow as a 30-stock blue-chip measure covering sectors other than the specialised Dow transportation and utility averages. The index provider maintains its constituent methodology and calculates the index during applicable market periods. You can observe its level; you cannot place an order for ‘one share of the DJIA’ itself.
Exposure generally comes from an index-linked exchange-traded fund, a fund, an option or a futures contract. These vehicles can have different fees, tracking behaviour, settlement terms and risks. That is the first conceptual separation: the index measures; the financial product trades.
What exactly is a Dow futures contract?
A Dow futures contract is a standardised agreement traded through a futures exchange, with a specified contract month and formula for determining its dollar value. In the case of E-mini Dow and Micro E-mini Dow futures, the reference is the DJIA, but the actual product is a derivative maintained under exchange rules.
Futures allow investors and institutions to take long or short market exposure, hedge portfolios or express short-term views. They also permit trading well beyond normal U.S. stock hours. CME’s E-mini Dow contract page explains that the product gives exposure to the 30-stock index through an electronically traded contract.
The word ‘futures’ does not mean the market has perfect foresight. It refers to the contract structure and settlement date. A futures price reflects current trading, funding conditions, expected distributions, hedging demands, liquidity and risk appetite. It can be a useful signal but is not a guaranteed forecast of the next cash open or close.
YM vs MYM: The contract-size difference
| Feature | E-mini Dow | Micro E-mini Dow |
|---|---|---|
| Common code | YM | MYM |
| Multiplier | $5 × Dow futures index level | $0.50 × Dow futures index level |
| One-point movement | $5 per contract | $0.50 per contract |
| Notional exposure at hypothetical 52,000 | $260,000 | $26,000 |
| Ten-point movement, excluding costs | $50 | $5 |
| 200-point movement, excluding costs | $1,000 | $100 |
The specifications above are based on CME’s side-by-side product table, not on assumed broker conditions. The index value of 52,000 is used solely to illustrate the arithmetic; it is not a reported live market quote.
Worked example: 200 points in two different products
Imagine one long YM contract purchased at a futures price of 52,000. If that same contract later trades at 52,200, its mark-to-market change is 200 index points × $5 = $1,000, before commissions, fees and other effects. If it falls instead to 51,800, the analogous movement is a $1,000 loss. For one MYM contract over the same 200 points, the gross change is $100.
Ten MYM contracts have the same index-point dollar exposure as one YM contract, although actual order execution, fees and liquidity can differ. The arithmetic explains both the appeal and danger of smaller futures products: the Micro contract reduces the dollar increment of exposure but does not remove leverage, market risk or the possibility of rapid losses.
A futures contract’s notional value is not its purchase price
A common mistake is to read the $260,000 notional value of a hypothetical YM contract and conclude that traders must pay $260,000 up front. Futures typically operate with a performance-bond or margin system. A clearing broker requires a margin deposit to support a position, rather than full payment of its notional amount. That does not make the underlying exposure small or low risk.
Margin requirements can change with volatility, exchange rules and brokerage policies. Some brokers demand higher amounts than exchange minimums. A trader can face losses exceeding an initial deposit and may be required to add funds or liquidate positions, sometimes at unfavourable prices. The CME futures introduction and product pages explain the basic structure, while brokers publish the applicable real-time margin terms.
For an ordinary reader interpreting market news, notional exposure is the clearest reminder of how much index-linked risk a position represents. For someone contemplating trading, the relevant questions are position size, maximum tolerable loss, broker rules, liquidity and suitability—not simply which product has the smaller initial margin.
Why futures prices and the last cash Dow level can differ
Suppose the DJIA closed at 52,000 yesterday and a Dow futures contract trades at 52,150 overnight. It is tempting to say ‘the Dow is already up 150.’That is imprecise. The cash index’s last recorded close and the current futures contract price are two different measurements. The contract can trade at a premium or discount to a fair-value estimate depending on financing costs, expected dividends and time to expiration, as explained in CME’s stock-index fair-value guide.
A futures contract may also be quoted as a percentage change from its own prior futures settlement, rather than a change versus the cash Dow’s previous close. Those reference points may not match. A professional explanation should identify whether the number represents a futures change, an implied cash opening adjustment or a change in the already-open DJIA.
This matters particularly during volatile overnight sessions. The market may move sharply while U.S. stock exchanges are closed, and new information can be incorporated by futures traders. At 9:30 a.m. Eastern, the cash market provides another set of prices. The eventual cash Dow can open higher, lower or near flat regardless of what an earlier futures snapshot suggested.
Dow futures trading hours versus stock-market hours
The CME equity-futures schedule generally describes equity-index futures trading from Sunday through Friday, 5 p.m. to 4 p.m. Central Time, with a daily break from 4 p.m. to 5 p.m. CT. That gives roughly 23 hours of trading per day during the trading week, subject to holidays, scheduled halts and exchange notices.
The regular U.S. cash-stock session runs 9:30 a.m. to 4:00 p.m. Eastern Time on normal trading days, according to the NYSE’s official trading schedule. Changes in daylight-saving time affect conversions to overseas time zones, so international readers should rely on the exchange’s local clock or an accurate calendar. Futures may also have separate rules during U.S. holidays and exceptional market events.
Futures are not literally open 24 hours every calendar day. Exchange maintenance breaks, weekends and trading interruptions exist. A financial website that shows a frozen quote during an exchange break is not necessarily reporting a market that has stopped moving for an economic reason.
How futures contract months and rollovers work
Equity-index futures are not timeless securities. A contract is associated with an expiration month, and traders who want ongoing exposure may close the expiring contract and open one in a later month, a process often called rolling. The nearer and later contracts can have different prices because financing and dividend expectations change with the remaining time.
Many financial quote pages default to a front-month or continuous futures series. That can be convenient for charts but introduces subtleties. On rollover dates, the displayed series may switch underlying contracts; historical ‘continuous’ charts may apply adjustments that are not the exact path of any single tradable contract. If you are comparing a news report with today’s quote, confirm the month and whether the series is adjusted.
At expiration, Dow futures are generally cash settled according to the contract’s settlement methodology, not delivered as a physical basket of 30 corporate share certificates. The CME Dow futures specification and education materials explain the contract framework. Settlement details should be verified against the specific active contract rather than assumed from outdated broker summaries.
The Dow’s price weighting changes how to interpret an overnight move
The Dow is sometimes treated as shorthand for the entire U.S. economy, but the benchmark covers only 30 selected stocks. A large change in a highly priced Dow component can move the index more than a similar percentage change in a smaller-priced one. The S&P 500 offers broader coverage; the Nasdaq-100 differs in membership and sector mix. They will not always move together.
A practical premarket report should therefore examine several layers: the Dow futures percentage, S&P 500 and Nasdaq-100 futures, Treasury yields, the dollar, major corporate announcements and industry sectors. If Dow futures are positive but technology-heavy futures are negative, the divergence may be meaningful. Conversely, simultaneous changes across all three indices may suggest a broad risk repricing.
No single signal demonstrates causation. A surprise earnings release could shift tech sentiment while interest rates rise for unrelated reasons. Index moves alone cannot reveal whether the price change came from hedging, speculation, a fundamental reassessment or a temporary liquidity shortage.
Five reading mistakes to avoid
- Equating the futures price with the cash Dow. Identify which instrument is actually quoted.
- Ignoring the timestamp. A 4 a.m. futures gain is not a report about the 4 p.m. cash close.
- Ignoring the reference price. Futures percentage changes can use prior settlement rather than the cash close.
- Confusing points and contract dollars. One point is $5 per YM contract but only $0.50 per MYM contract.
- Treating leverage as low-cost safety. A small margin deposit does not eliminate large notional exposure.
The most accurate headline is often a little less dramatic: ‘Dow futures rose in early trading before the stock-market open,’ followed by a specific timestamp and source. That wording is much more informative than suggesting the Dow itself has already rallied.
How to use Dow futures as a nontrader
A long-term investor can use futures as one piece of context for potential opening volatility, without trying to day-trade every movement. A business reporter can identify whether the overnight reaction to earnings or an election is concentrated in the Dow or broader benchmarks. A reader outside the United States can separate what happened while Wall Street was closed from what happened after cash trading resumed.
A responsible quote check has four parts: instrument code, contract month, timestamp and percentage reference. Add the exchange or feed source. If any of those are missing, the explanation should be cautious. The CME market comparison page is a practical starting point for contract identification, while the DJIA index provider documents the underlying benchmark.
Frequently asked questions
Are Dow futures the same as the Dow Jones Industrial Average?
No. Dow futures are tradeable derivatives; the DJIA is a calculated 30-stock, price-weighted benchmark. The futures contract references the index but has its own settlement, expiration and trading hours.
What does YM mean in Dow futures?
YM is the commonly used code for the E-mini Dow futures contract. One index-point move generally represents $5 per contract before costs.
What is MYM?
MYM refers to the Micro E-mini Dow contract. Its dollar exposure is one-tenth of the E-mini’s: $0.50 per index point, compared with $5 for YM.
Does Dow futures up 300 mean the Dow will open up exactly 300?
No. The derivative and cash index use different price references, and the market can move before the cash open. The actual Dow opening print is determined by the component stock prices at that time.
Can Dow futures trade at night?
Yes. CME equity-index futures generally trade for roughly 23 hours on trading days, with scheduled breaks and holiday variations. See the CME trading-hours guide.
Can I lose more than my futures margin deposit?
Yes. Futures are leveraged. Losses can exceed the initial margin deposit; broker liquidation and additional margin requirements are possible. Product specifications and risk disclosures should be reviewed before any trade.
The Dow is a measurement; Dow futures are contracts linked to that measurement. Once that difference is clear, the other pieces fall into place: YM and MYM determine dollars per point, futures hours extend well beyond cash trading, contracts expire, and premarket prices are useful but fallible signals. The right habit is to read the instrument and timestamp before reading too much into the headline.
Discover more from The Economy
Subscribe to get the latest posts sent to your email.

Quick answer: The Chinese tape maker attracting global attention is Crown New Materials Technology Co., Ltd., which began trading on the Shenzhen Stock Exchange on November 3, 2026, under stock code 001381. Its offering price was 16.98 yuan a share. The stock touched 150.58 yuan, approximately 787% above that price, but closed at 84.55 yuan, a gain of approximately 398% from the IPO price. The difference between the day’s high and its close is essential to understanding the story, according to the company’s official exchange listing document and November 3 trading record.
A manufacturer of industrial adhesive tape has become one of the most remarkable stock-market stories of the week. It is tempting to frame Crown’s debut entirely around the fortune created for its founders or the astonishing percentage gain. Both are newsworthy. Neither tells investors why a business built around adhesive materials can attract such intense demand—or whether a first-day valuation can survive contact with its earnings.
The more revealing story is about the difference between a company’s economic value, the limited number of shares available to trade, and the very public excitement surrounding a newly listed stock. Crown’s filings provide enough information to begin disentangling those forces, although they cannot establish exactly why individual buyers paid particular prices.
Crown New Materials IPO: The essential numbers
| Measure | Verified figure | Why it matters |
|---|---|---|
| Exchange and ticker | Shenzhen main board, 001381 | Identifies the actual listed company |
| Listing date | November 3, 2026 | The first session of trading |
| IPO offer price | 16.98 yuan | The baseline for quoted first-day returns |
| Intraday high | 150.58 yuan | Approximately 786.8% above offer price |
| First-day closing price | 84.55 yuan | Approximately 397.9% above offer price |
| Shares outstanding after issue | 468,980,000 | Basis for indicative equity valuation |
| Shares issued in IPO | 56,304,768 | New shares sold to investors |
| Shares freely tradable at listing | 44,097,241 | Just 9.40% of post-IPO share capital |
| Approximate gross IPO proceeds | 956.1 million yuan | Money raised by the new-share offering |
The share counts, listing details and pricing come from Crown’s Shenzhen Stock Exchange listing announcement. The trading high and close are corroborated by the November 3 quote record and contemporary Forbes reporting carried by Yahoo Finance.
These are first-session historical figures, not a live quote. Any article describing the stock as trading ‘today’ must retrieve a fresh, timestamped market price.
What happened on November 3?
Crown completed its public offering at 16.98 yuan and entered the Shenzhen main board with an ordinary industrial business that suddenly looked extraordinary on trading screens. At its session peak, a share cost nearly nine times the issue price. Two trading interruptions were reported amid the volatility, according to a contemporary market report.
Yet the closing price tells a second story. At 84.55 yuan, shares ended the day 66.03 yuan below the intraday peak. Someone who bought at that peak and hypothetically valued the position at the close would have faced an approximately 43.9% decline from their purchase price. That is not the same calculation as the IPO gain, and it does not describe any individual investor’s realized loss. It illustrates how one stock can simultaneously produce a spectacular headline gain and substantial short-term downside for late buyers.
Using the official post-issue total of 468.98 million shares, the closing price implies an equity market value of roughly 39.65 billion yuan. Applying the session high to all outstanding shares produces an illustrative peak valuation near 70.62 billion yuan, although very few shares may have changed hands at the highest price. Neither figure represents proceeds received by the company: Crown raised roughly 956 million yuan from the offering itself.
What kind of company is Crown?
Calling Crown a ‘tape maker’ is accurate but incomplete. Its prospectus describes a manufacturer of functional composite materials, including industrial-grade adhesive products, electronics-grade adhesives and specialized functional films. These materials are engineered to stick, shield, protect, insulate, release or otherwise perform specific roles in industrial applications.
A roll of ordinary stationery tape offers little insight into materials used to assemble delicate consumer electronics, protect optical surfaces or accommodate heat and vibration in vehicles. The value proposition in those markets depends on formulations, coating precision, manufacturing consistency and customer qualification—not simply the number of meters of tape sold.
The Guangdong-based company has described its products as reaching end-use supply chains associated with brands such as Apple, Google, Tesla and BYD. That wording needs careful treatment. A material used in the supply chain of a major brand does not automatically mean that the brand buys directly from Crown, contributes a disclosed share of Crown’s revenue, or has endorsed its investment prospects. The company discusses those end-use applications in its IPO prospectus; any stronger claim about a direct contract needs separate documentation.
From a schoolteacher to a paper billionaire
The human-interest angle has helped propel the story internationally. Forbes’ account identifies chairman and chief executive Mai Michael, also identified in the company’s Chinese filing as Mai Huiquan, as a former elementary-school teacher. It estimated his holdings at about $2.5 billion during the IPO excitement and those of his sister, vice-chairwoman Mai Huixia, at approximately $2 billion.
Those estimates describe paper wealth, calculated from shareholdings and quoted market prices. They do not mean the founders received those sums in cash. Large founder positions are typically subject to lockups, and selling a large position into a thin market could affect its price. The official listing announcement describes multiple lockup periods and a relatively small initial public float.
It is a compelling entrepreneurial story. But the investment case should not depend on its protagonist’s change of profession.
The overlooked number: Only 9.4% was freely tradable
Crown’s filing says 44,097,241 shares, or 9.40% of total post-IPO shares, were free of sale restrictions at listing. This matters because the market price is established at the margin—where the available sellers meet eager buyers—not by simultaneous trading in all 468.98 million shares.
When newly available supply is scarce, even relatively modest incremental demand can produce outsized price movements. The result can be an equity valuation that looks spectacular when multiplied across every share, despite much less money changing hands in the market. This is a plausible mechanism for IPO volatility, not definitive proof of Crown’s specific order-book dynamics.
The company explicitly warned in its listing risk disclosures about irrational speculation, concentrated tradable supply and the risks of widened price bands during the early sessions. It also said there is no guarantee its shares will remain above the issue price.
An investor comparing Crown with an established listed manufacturer therefore needs to account for both fundamental valuation and float-related volatility. A first-day close is a price discovery event, not a long-term estimate of intrinsic value.
The business was growing—but profit momentum was weaker
Here lies the most useful contrast with the headline gain. Crown reported 2025 revenue of approximately 3.408 billion yuan, compared with 3.159 billion yuan in 2024 and 2.895 billion yuan in 2023. Its attributable net profit was approximately 309.18 million yuan in 2025, compared with 302.29 million yuan and 277.54 million yuan in the preceding two years, according to its prospectus financial statements.
The more recent picture was less straightforward. For January–September 2026, revenue increased 11.75% year over year, to roughly 2.779 billion yuan, while attributable net profit fell 7.89%, to approximately 225.04 million yuan, according to the company’s pre-listing financial update. Crown attributed the margin pressure partly to higher raw-material costs and a production base that had not yet reached its intended operating scale.
The same disclosure projected 2026 full-year attributable net profit of 263.64 million–278.26 million yuan, a decline of approximately 10%–14.73% against 2025. Management cautioned that this was a preliminary estimate, not a binding earnings forecast.
A stock whose price approaches five times its issue price while projected earnings are falling is not necessarily overvalued: investors may expect future expansion, stronger product mix or recovering margins. But it certainly requires more explanation than the phrase ‘strong growth’.
What the first-day valuation implies
At the 84.55-yuan close, Crown’s approximately 39.65-billion-yuan market capitalization divided by its 2025 attributable profit of 309.18 million yuan produces a rough trailing price-to-earnings multiple of 128 times. This simple calculation is not a substitute for fully adjusted financial analysis, but it establishes the magnitude of expectations embedded in the price.
At 16.98 yuan, the same method suggests roughly 25.8 times 2025 profit—close to the 25.87-times issue multiple disclosed in the listing documentation, which uses a specified adjusted earnings basis. The differences in definitions and rounding explain why calculated figures need not match exactly.
The point is not that a high multiple guarantees a crash. It is that long-term returns at that valuation depend heavily on whether Crown can convert new capacity, customer qualifications and research spending into significantly higher sustainable earnings.
Why the adhesive-materials opportunity is real
Functional adhesives occupy an easily overlooked position in technology and industrial supply chains. Electronics need materials for assembly, protection, sealing and thermal management; advanced batteries and electric vehicles impose demanding requirements around durability, heat, vibration and safety. Specialized films can carry different margins, know-how requirements and qualification processes from commodity tape.
Crown plans to invest IPO funds in functional-material capacity, semiconductor-related materials, optical films and a research center. Its IPO project plan lists approximately 918.68 million yuan of intended funding uses across the projects and working capital.
But opportunity and revenue are different categories. New facilities can take time to ramp up, and advanced-materials products must meet demanding technical specifications before customer orders scale. Investors need to assess qualification delays, production yields, competitive pricing and capital spending—not just the relevance of a product to artificial intelligence, electric vehicles or smartphones.
Three risks that deserve more attention
Raw materials. Crown disclosed that direct materials represented roughly 80% of its main operating costs across the reporting periods. Resins, solvents and other petrochemical inputs expose it to energy-market volatility. The company estimated that a 5%–10% raw-material cost increase, under the modeled conditions, could materially reduce gross margin. The assumptions and risk language appear in the listing document.
Competition. Industrial adhesives are not a monopoly. Crown itself identifies major international players including 3M, Nitto and tesa, alongside Chinese manufacturers, in its prospectus. Winning a customer program does not guarantee pricing power indefinitely.
Market structure. A small free float, lockups and early-session volatility can exaggerate price swings. A high share price may also make future disappointing earnings more painful because investors have already priced in exceptional success.
What to watch after the debut
The next useful data will be operating results and disclosures, not another viral percentage. Investors should monitor the company’s official disclosure page for updated earnings, shareholding notices, capacity milestones, customer concentration details and risks. They should compare gross margins across reporting periods, verify actual product-mix changes and distinguish scheduled lockup expirations from real share sales.
For coverage of Chinese IPOs generally, it is also important to separate exchange-regulator decisions, media reports about listing-policy changes and company-specific performance. A report about the wider IPO pipeline does not establish that Crown’s listing was exceptional because of a particular new policy.
Frequently asked questions
Which Chinese tape maker surged in its stock debut? Crown New Materials Technology, listed on Shenzhen’s main board under code 001381 on November 3, 2026.
Did its shares finish up 787%? No. The approximately 787% figure refers to the intraday peak relative to the IPO price. Shares ended their first session approximately 398% above the offering price.
How much did Crown raise? Roughly 956 million yuan gross through the sale of 56.3 million newly issued shares priced at 16.98 yuan each, before offering expenses.
Does Crown sell directly to Apple and Tesla? Its prospectus identifies end-use applications associated with major brands. That statement alone does not establish direct purchasing relationships or revenue concentration.
Is Crown a good investment after its IPO? The first-day performance cannot answer that question. Price, earnings quality, future margins, customer concentration, trading liquidity and individual risk tolerance all matter.
Why did its founders become billionaires? Media wealth estimates used their equity stakes and the newly quoted stock price. Such gains are unrealized and subject to market movements and share-sale restrictions.
Crown’s debut reveals two different phenomena: an industrial-materials company with a genuine technology-supply-chain business, and an IPO market capable of valuing a relatively small free float at startling prices. The 787% intraday gain made the headline. The 398% closing gain, 9.4% free float and weakening near-term profit outlook provide the better starting point for investors trying to understand it.
Discover more from The Economy
Subscribe to get the latest posts sent to your email.

Why investors punished Google while largely sparing Microsoft—and what the historic sell-off reveals about the economics of artificial intelligence.
Wall Street has spent years rewarding technology companies for promising an artificial intelligence revolution. On October 29, it sent one of the revolution’s largest financiers a brutally different message: innovation may be impressive, but investors still expect a return on their money.
In a single trading session, approximately $500 billion evaporated from Alphabet’s stock market valuation. Shares in Google’s parent company plunged 12.6 percent, their worst one-day performance since the company’s public listing in 2004.
The extraordinary sell-off came after a quarter that, by many conventional measures, should have been cause for celebration. Alphabet reported revenue of $127.6 billion, a 25 percent increase from a year earlier. Its cloud division more than doubled its revenue. Operating income rose 30 percent.
Yet investors responded not with applause but with alarm.
The explanation lies in a troubling contradiction at the heart of the AI economy. The industry’s technological ambitions are accelerating faster than its capacity to translate those ambitions into cash.
What happened to Alphabet was not simply an earnings disappointment. It was a warning that the financial rules governing Silicon Valley’s AI investment boom may be changing.
And the contrasting treatment of Microsoft, which reported results on the same evening, offers an illuminating explanation.
The $500 Billion Warning
Alphabet’s financial results, released on October 28, exposed an uncomfortable imbalance.
The company generated $42.3 billion in operating cash flow during the third quarter. But it spent $51.4 billion on capital expenditure, primarily technical infrastructure. That left negative free cash flow of approximately $9.1 billion.
The previous quarter had produced a free-cash-flow deficit of $5.9 billion.
Two consecutive quarters in which capital investment exceeded internally generated operating cash represent a significant change in the financial profile of a business long celebrated for converting digital advertising into enormous amounts of cash.
The numbers are particularly striking because Alphabet’s investment programme shows little sign of slowing.
Management maintained its capital-expenditure forecast of $195 billion to $205 billion for 2026 and warned that spending would rise significantly again in 2027.
For investors, this raises a question that no amount of enthusiasm about large language models can easily answer: How much investment will be required before the financial rewards become commensurate with the costs?
The market was not reacting merely to the size of the expenditure. It was reacting to the possibility that infrastructure commitments could continue rising faster than the cash available to finance them.
There is, however, an essential distinction.
Alphabet is not a financially distressed company. According to its third-quarter regulatory filing, it held approximately $265 billion in cash, cash equivalents and marketable securities at the end of September, although that total included substantial equity holdings, including restricted SpaceX shares.
Its free cash flow over the preceding 12 months remained positive at $19.7 billion.
Moreover, an approximately $8.7 billion loss on equity securities—largely associated with SpaceX—depressed reported earnings without representing an equivalent quarterly operating cash outflow.
These distinctions matter. A temporary cash-flow deficit is not proof of impending insolvency, just as a large accounting profit is not proof that every investment creates economic value.
Alphabet has the resources to continue financing its ambitions. What investors are questioning is the price shareholders must pay for those ambitions, and the returns they will ultimately receive.
The market’s message is therefore more subtle than a rejection of AI: extraordinary financial capacity no longer guarantees unlimited investor patience.
Why Microsoft Escaped the Same Punishment
Microsoft’s earnings announcement provided a revealing contrast.
The company reported quarterly revenue of $92.3 billion, up 19 percent, while Azure revenue grew 48 percent.
It generated approximately $58 billion in operating cash flow and recorded $18.6 billion in positive free cash flow, despite capital expenditures of $45.2 billion.
Microsoft’s share price finished October 29 almost unchanged, declining approximately 0.2 percent.
That relative resilience was not because Microsoft had abandoned infrastructure spending. Nor was its investment programme fundamentally modest.
The company was continuing to commit extraordinary sums to data centres, processors and cloud infrastructure. Management projected approximately $170 billion in capital expenditures for calendar 2026, with some capacity deliveries delayed.
The distinction was that Microsoft’s operating cash generation continued to cover its cash capital investment, providing a financial cushion that Alphabet lacked during the latest quarter.
Microsoft also presented investors with a more immediately visible commercial connection between infrastructure and revenue.
Azure sells computing capacity directly to business customers. Microsoft can monetize AI through cloud consumption, enterprise software, development platforms and productivity subscriptions.
The relationship between customer demand, computational capacity and revenue is not perfectly transparent, but it is relatively straightforward.
When a business buys additional Azure computing capacity, Microsoft can demonstrate the associated revenue. That does not guarantee attractive returns on capital, but it offers investors a clearer path toward measuring them.
Alphabet faces a more complicated challenge.
Its infrastructure must support cloud customers, AI-model development and a vast collection of consumer services. Much of the expenditure is directed toward transforming products that users already access, including Search.
In those businesses, greater AI usage does not automatically produce a corresponding increase in revenue.
Nevertheless, the argument that Microsoft can finance its AI expansion entirely from internally generated cash also requires qualification.
On October 29, Microsoft priced a $25 billion offering of senior unsecured notes, with proceeds available for general corporate purposes, potentially including capital expenditure.
Even one of the industry’s strongest cash generators has chosen to supplement its financial resources through capital markets.
The real distinction is therefore not between companies that borrow and those that do not.
It is between companies whose investors remain confident in the relationship between investment, operating cash generation and future returns—and those for which that relationship has become harder to forecast.
Google’s Most Dangerous AI Problem Is Its Greatest Business
The more consequential challenge may lie beneath Alphabet’s capital expenditure.
Google’s search engine remains one of the most profitable commercial platforms ever created. For decades, its advertising model has depended on a remarkably efficient transaction: users express an intention, advertisers compete for their attention, and Google collects revenue.
Artificial intelligence threatens to alter that relationship.
Alphabet reported that Google Search and other advertising revenue grew 12 percent to approximately $63.4 billion in the third quarter, down from 17 percent growth in the preceding quarter.
The slowdown was not solely attributable to AI. Company executives pointed to currency effects and changing advertising patterns in specific industries, with foreign exchange identified as the largest factor.
But they also acknowledged that lower monetization in Google’s AI Mode was contributing to the deceleration.
This is the economic dilemma at the centre of Google’s transformation.
Traditional search presents users with advertisements alongside links to external websites. AI-powered search increasingly attempts to answer questions within Google’s own interface.
These experiences can be more useful, more conversational and more engaging. But the established commercial architecture does not transfer automatically.
A user who receives a comprehensive AI-generated answer may have less reason to click on conventional search results. Advertisers may need different formats to reach that user. Google must discover how to generate sufficient revenue from those interactions without compromising their usefulness.
Chief Executive Sundar Pichai has said AI investments are helping produce the fastest year-over-year growth in search queries in five years.
He has also reported that queries in AI Mode are, on average, three times longer than traditional searches.
Longer queries do not necessarily mean three times the computational cost. But they illustrate how significantly the product is changing.
The crucial question is whether this increased engagement can become sufficiently profitable engagement.
If Google’s new AI services attract greater usage but generate less advertising revenue per interaction, the company faces a double challenge: increasing infrastructure costs alongside uncertainty about monetization.
That possibility makes Alphabet’s situation different from a conventional infrastructure investment cycle.
Google is not merely building a new business. It is spending heavily to reinvent an existing one, partly to defend it against technologies that could undermine its established advantages.
And that creates a difficult strategic calculation.
Moving too slowly risks allowing competitors to redefine how consumers discover information. Moving too quickly could weaken the economics of the search business that finances Google’s technological ambitions.
For Alphabet, therefore, the cost of AI is not limited to servers, chips and electricity.
It also includes the possibility of disrupting one of the world’s most successful advertising models before an equally profitable successor is firmly established.
The Case Against Wall Street’s Verdict
There is a powerful counterargument to the market’s reaction.
Alphabet’s latest earnings contained evidence that its AI investments are already producing substantial commercial results.
Google Cloud revenue increased 103 percent to $30.7 billion, while the division’s operating income climbed from approximately $3.6 billion to $11.1 billion.
These are not the financial results of a business experiencing a collapse in AI demand.
They suggest that Alphabet is gaining meaningful commercial traction.
Importantly, the company said sales of its tensor processing unit systems made a significant contribution to Cloud’s expansion. Such hardware sales are not economically identical to recurring cloud-service revenue, and investors should distinguish between them when evaluating future growth.
Even so, the improvement in operating income is difficult to dismiss.
Alphabet has also built substantial expertise across semiconductor design, AI models, cloud infrastructure and consumer distribution.
Its ability to combine these capabilities may ultimately create advantages that narrower competitors struggle to replicate.
And large infrastructure investments frequently require cash long before their economic benefits become visible.
Data centres may take years to build and operate at full capacity. Customers may increase their spending gradually as applications move beyond experimentation into widespread deployment.
Judging a multiyear investment programme solely by two quarters of negative free cash flow would be shortsighted.
Indeed, if Alphabet’s investments strengthen its cloud business, improve the economics of inference and preserve Google’s position in search, the present spending surge could ultimately appear justified.
The difficulty is that investors must evaluate these possibilities before the returns become fully measurable.
That is what makes the debate so consequential.
The question is not whether Alphabet possesses valuable technology or whether demand for AI infrastructure exists. Its latest cloud results provide compelling evidence of both.
The question is whether today’s investment will earn sufficient returns to justify the company’s valuation after allowing for operating costs, depreciation, financing requirements and technological obsolescence.
That is a substantially higher standard than simply demonstrating rapid revenue growth.
The AI Boom Has Entered Its Financing Era
Alphabet’s experience is part of a much broader transformation in the economics of America’s largest technology companies.
The industry’s leading platforms are committing sums once associated with national infrastructure programmes.
Meta expects capital expenditures of $135 billion to $145 billion in 2026. It also reported negative free cash flow of approximately $2.1 billion in the third quarter.
Amazon’s October 29 results revealed a $42.4 billion free-cash-flow outflow over the preceding 12 months, despite AWS revenue growing 39 percent in the third quarter. Amazon maintained plans for approximately $220 billion in cash capital expenditures in 2026.
The enormous scale of these commitments suggests that AI is moving from a software-led innovation cycle into something closer to an industrial investment cycle.
Building the infrastructure requires land, electricity, cooling systems, semiconductors, financing and years of planning.
It also introduces risks unfamiliar to investors accustomed to the exceptional profitability of asset-light internet businesses.
An AI accelerator purchased today may become less economically competitive as newer processors arrive. Data-centre capacity must attract customers at prices sufficient to recover its cost. Electricity and cooling requirements can place lasting pressure on operating margins.
Accounting profits may remain strong while cash is tied up in new infrastructure.
Nor is the industry insulated from the cost of capital.
When borrowing becomes more expensive, when investors demand higher returns or when economic uncertainty affects enterprise spending, projects that once appeared compelling can become less attractive.
This does not mean an AI investment bubble must inevitably burst. Technological revolutions can deliver extraordinary productivity gains and create profitable businesses.
But history offers no guarantee that every company financing a technological revolution will capture a proportionate share of its economic benefits.
Railways transformed trade. Telecommunications transformed communication. The internet transformed commerce.
In each case, society’s long-term gains and the financial returns available to particular investors were not always the same thing.
Artificial intelligence may prove no different.
The Next Test Is Not Revenue Growth. It Is Return on Capital.
Investors should now demand more useful answers from technology companies than ever-larger announcements of capital expenditure.
How much additional revenue is generated by each dollar invested in computing infrastructure?
How quickly does new capacity reach commercially productive utilization?
Are businesses earning attractive margins after accounting for depreciation, energy, financing and maintenance?
And perhaps most importantly for Alphabet, can AI-powered search eventually produce revenue per user interaction comparable to—or better than—the traditional model it is replacing?
These questions matter more than headline declarations about model capabilities or user engagement.
Alphabet’s forthcoming fourth-quarter results, including further guidance on 2027 capital expenditure, will provide another opportunity to assess whether spending is beginning to stabilize relative to cash generation.
Microsoft will face similar scrutiny, especially as delayed GPU capacity becomes available and its own financing requirements increase.
The market’s relative tolerance toward Microsoft should not be mistaken for permanent immunity.
If AI revenue growth disappoints, or if capital requirements continue escalating faster than cash flow, even the strongest balance sheets will be tested.
There is another possibility, of course.
If AI adoption accelerates, infrastructure becomes more efficient and companies successfully develop profitable products, today’s expenditure could support years of earnings growth.
That outcome remains plausible.
But the burden of proof is shifting from technological promise to financial performance.
The End of Silicon Valley’s Blank Cheque
Alphabet’s historic sell-off may ultimately be remembered not as the moment Wall Street abandoned artificial intelligence, but as the moment it began taking the technology’s economics seriously.
The company did not lose roughly $500 billion in market value because its engineers had failed to build compelling AI products. It lost that value because investors became less confident about how much future cash shareholders would receive from the investments required to commercialize them.
Microsoft’s comparative resilience demonstrates the importance of that distinction. Investors were more willing to tolerate enormous capital commitments when supported by strong operating cash flow and clearer monetization prospects.
But Microsoft is not exempt from the same arithmetic, and Alphabet is far from defeated by it.
The real reckoning lies ahead.
Silicon Valley has successfully convinced the world that artificial intelligence will reshape how businesses operate and how people live.
Now it must prove that the economics of building that future will reward those paying for it.
For years, the defining question of the AI boom was who could build the most powerful technology. The defining question now is who can turn that technology into sustainable cash returns.
That is not the end of the AI revolution.
It may be the beginning of its financial maturity.
Discover more from The Economy
Subscribe to get the latest posts sent to your email.

Dow Futures vs Dow Jones: What E-mini Contracts Really Tell You Before Wall Street Opens

China Tape Maker Stock Debut: Crown New Materials Soared 787%

Apple’s Earnings Beat Had a Catch: Look Past the Tariff Refund

Social Security Payments in November 2026: The Full Calendar and Two Important Changes

Johor–Singapore SEZ’s $21.8 Billion Bet: The Hard Part Starts Now

China’s 175 Trillion AI Tokens Reveal a Bigger Shift: The AI Boom

The Philippines’ Stagflation Trap: Higher Interest Rates

Alphabet’s $500 Billion Reckoning: Wall Street Is Losing Patience With the AI Boom

4 Reasons Why China’s Trade Concessions to Europe Will Not Solve the Crisis

The AI Revolution Needs Atomic Power. Southeast Asia Is Ready to Build It.

Zhuhai Airshow 2026: How China’s Stealth Jets, Drones and Missiles Are Redrawing Global Air Power

The $8 Billion Runway: China’s Strategic Bet on Guangzhou and the Future of Aviation

The Sandbox Imperium: Why Beijing’s Digital Yuan Needs Hong Kong

Gold at the $4,000 Line: Possible December Fed Hike

Crude Oil & Petroleum Market Analysis: OPEC+ Decisions and Price Forecasts

Top US Convenience Store Chains: Store Counts, EV Charging, and Sales Trends

Social Security Extra $90 Deposit: Who Qualifies for the October 2026 Medicare Rebate?

Gold Price Outlook 2026: The Forces Behind the Forecasts—and What Could Reverse Them

Algorithmic Dogfights: Why the U.S. and China Must Establish Rules of Engagement for Autonomous Air Power

Corporate America Faces a New Debt Test as US Borrowing Costs Surge

Global Economic Outlook 2026: 7 Forces Reshaping Markets, Trade and Business

Stock Market Crash in 2026? Warning Signs, Scenarios and a Calm Investor Checklist

US–Iran Conflict in October 2026: Hormuz, Oil Prices and Diplomacy

Stock Market Today: Dow, S&P 500, and Nasdaq Retreat as Treasury Yields

Geopolitics and Your Portfolio: How International Affairs Move Global Markets

Anthropic Bans Sustained Abuse of Claude AI Under New Usage Policy Effective November 12, 2026

Why Did I Get $90 From Social Security? 8 Reasons Behind an Unexpected SSA Payment

US–China Critical Minerals Competition: Why a Trade Deal Cannot Fix Every Supply Risk
-

 Markets & Finance10 months ago
Top 15 Stocks for Investment in 2026 in PSX: Your Complete Guide to Pakistan’s Best Investment Opportunities
-

 Analysis8 months ago
Johor’s Investment Boom: The Hidden Costs Behind Malaysia’s Most Ambitious Economic Surge
-

 Analysis9 months ago
Top 10 Stocks for Investment in PSX for Quick Returns in 2026
-

 Banks10 months ago
Best Investments in Pakistan 2026: Top 10 Low-Price Shares and Long-Term Picks for the PSX
-

 Analysis9 months ago
Brazil’s Rare Earth Race: US, EU, and China Compete for Critical Minerals as Tensions Rise
-

 Investment10 months ago
Top 10 Mutual Fund Managers in Pakistan for Investment in 2026: A Comprehensive Guide for Optimal Returns
-

 Global Economy10 months ago
15 Most Lucrative Sectors for Investment in Pakistan: A 2025 Data-Driven Analysis
-

 Global Economy10 months ago
Pakistan’s Export Goldmine: 10 Game-Changing Markets Where Pakistani Businesses Are Winning Big in 2025