
Analysis
Hong Kong’s IPO Crown Is About to Be Snatched — By a Single Deal
It took Hong Kong six years, three rounds of regulatory reform, and a historic wave of Chinese technology listings to reclaim the title of the world’s largest IPO market. It will take Elon Musk approximately one afternoon in June to take it away again.
On Wednesday, SpaceX filed its public prospectus with the US Securities and Exchange Commission, targeting a Nasdaq debut around June 12 under the ticker SPCX. The offering is expected to raise up to $75 billion at a valuation nearing $1.75 trillion — a figure that would make it the largest initial public offering in the history of capital markets, nearly tripling the $29.4 billion Saudi Aramco raised in 2019. That $75 billion sum would also exceed twice the total funds raised by every company that listed in Hong Kong across the entirety of 2025.
The arithmetic is blunt. The implications run considerably deeper.
How Hong Kong Got Here — and Why the Timing Stings
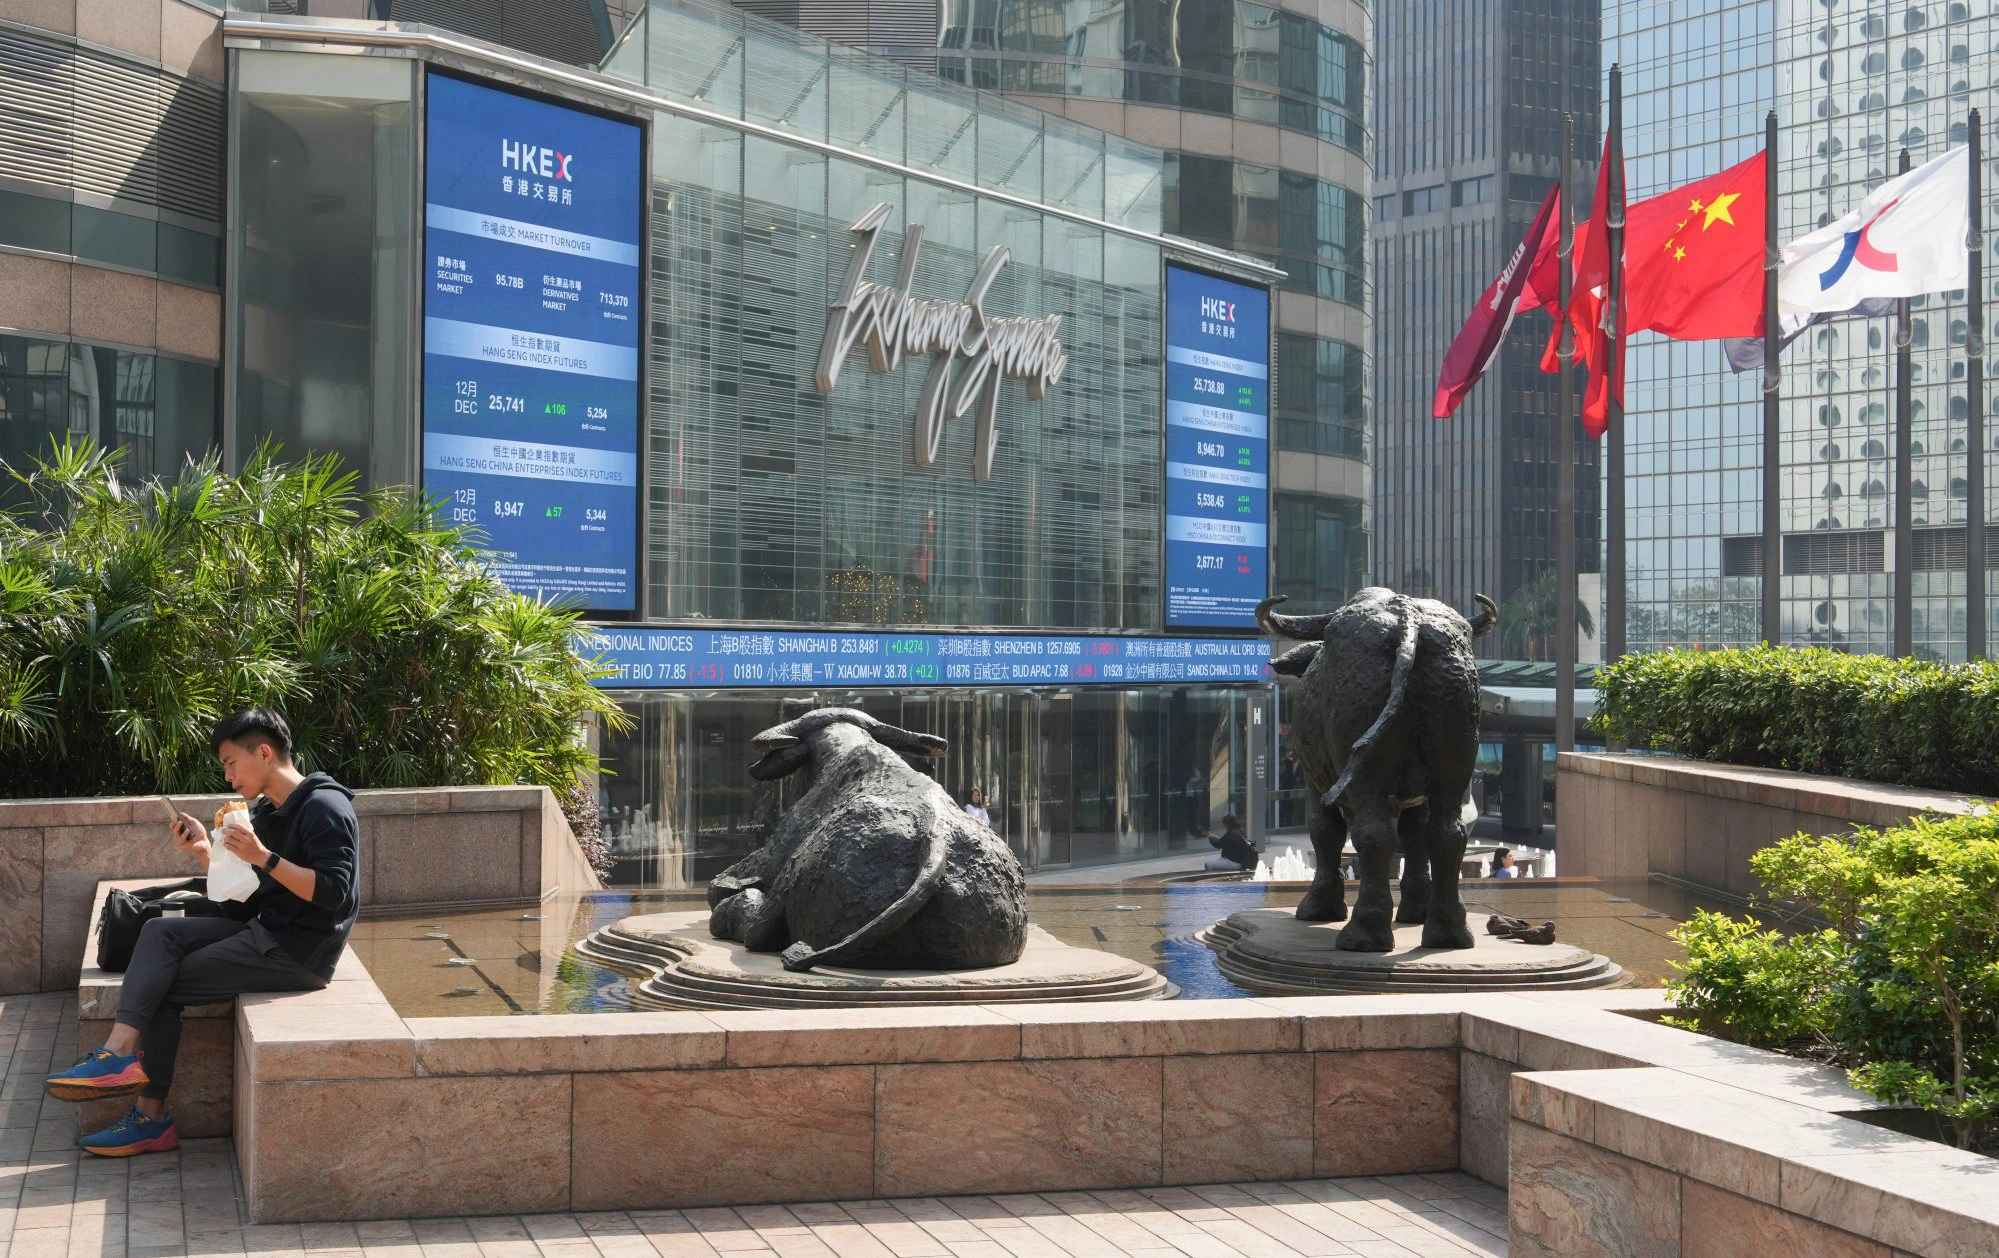
The Hong Kong Exchanges and Clearing’s (HKEX) reclamation of the global IPO crown in 2025 was not a fluke. It was earned, painstakingly, through structural reform and geopolitical tailwinds that converged in ways even optimists hadn’t fully anticipated.
According to data from LSEG, a total of 114 companies raised $37.22 billion on HKEX’s main board in 2025 — a 229% increase from the $11.3 billion raised in 2024. That pushed Hong Kong from fifth place to first globally, the exchange’s highest ranking since the pandemic-era boom of 2019 and 2021. Nasdaq finished second at $27.53 billion; India’s NSE and BSE followed in third and fourth.
The recovery wasn’t a single surge. It was built on a structural realignment. A record wave of A+H listings — companies trading simultaneously on both mainland Chinese exchanges (A-shares) and the Hong Kong exchange (H-shares) — accounted for more than 50% of total funds raised. PwC’s Hong Kong Capital Markets team recorded 76 A+H listings in 2025, up from 30 the year before — a 153% increase that reflected both Beijing’s strategic support for offshore fundraising and a fast-tracked listing process that HKEX had engineered specifically for such deals.
The momentum carried into 2026. By the end of the first quarter, KPMG reported that Hong Kong’s IPO market had raised HK$109.9 billion across 40 new listings — a staggering 489% increase in funds raised year on year, and the strongest first-quarter performance in five years. Nasdaq placed second in the Q1 global ranking with just $5.65 billion from 18 listings. Hong Kong wasn’t merely ahead — it was lapping the field.
Then came Wednesday’s filing.
The SpaceX Effect: When One Deal Reshapes a Market
The single most consequential fact about the SpaceX IPO isn’t the size. It’s the concentration.
At $75 billion, the SpaceX offering would alone represent more than the combined IPO proceeds of the second and third ranked global exchanges in 2025. It would, in a single transaction on a single exchange, transform Nasdaq from a distant runner-up into the unambiguous leader of the 2026 global IPO league table — regardless of what Hong Kong achieves over the remaining seven months of the year.
The prospectus filed in New York reveals a company of genuine complexity. SpaceX generated $18.674 billion in consolidated revenue in 2025, anchored by its Connectivity segment — primarily the Starlink satellite internet service, which now serves more than nine million subscribers and produced a quarterly operating profit of $1.19 billion in Q1 2026. Yet the company also posted a $2.589 billion operating loss for the full year 2025, driven almost entirely by the xAI division that SpaceX absorbed. In the first quarter of 2026 alone, the AI segment swung to a $2.47 billion loss on just $818 million in revenue.
Elon Musk will retain 85.1% of voting power through a dual-class share structure — 12.3% of Class A stock and 93.6% of Class B shares. Georgetown University finance professor Reena Aggarwal has noted that valuing SpaceX is inherently difficult because no comparable peer group exists. Reuters reported the company plans to price shares on June 11 before a June 12 trading debut.
What does this mean for the Hong Kong IPO market 2026 rankings? Straightforwardly: HKEX is almost certain to finish the year in second or third place, not first. Even under PwC’s bullish forecast — HKD 320–350 billion in total 2026 proceeds, approximately $41–45 billion — that figure falls short of SpaceX’s $75 billion target. A single private aerospace company raising more capital than the entire Hong Kong exchange raises in a year is not a competitive scenario; it’s a category event.
John Lee Chen-kwok, vice-chairman and co-head of Asia coverage at UBS in Hong Kong, acknowledged as much while choosing measured optimism: Hong Kong’s main board, he said, could remain in the top three this year even accounting for the challenge posed by US exchanges. That is almost certainly where Hong Kong will land.
What This Reveals About Structural Depth vs. Gravitational Pull
Can Hong Kong maintain its IPO market ranking in 2026?
Hong Kong is highly likely to remain a top-three global IPO market in 2026, supported by a pipeline exceeding 300 active listing applications and structural A+H listing momentum. However, SpaceX’s planned $75 billion Nasdaq offering means the exchange will not retain the top global ranking, which it held in 2025 after a six-year absence. The critical distinction is between a temporary ranking loss — caused by a singular once-in-a-generation listing — and a structural decline. On current evidence, Hong Kong is experiencing the former.
The picture is more complicated, however, than a simple “SpaceX effect.”
There’s a legitimate debate about what IPO market rankings actually measure. Hong Kong’s 2025 triumph owed much to the A+H structure — a mechanism that doesn’t exist on Nasdaq and doesn’t transfer. A+H listings are available exclusively to Chinese mainland companies that are already publicly traded on the Shanghai or Shenzhen exchanges and want offshore capital. They’re structurally embedded in the China-Hong Kong capital corridor in ways that no US exchange can replicate. KPMG’s full-year 2025 analysis found that A+H listings accounted for more than half of total Hong Kong IPO funds raised — a structural bedrock that insulates the market against competition in ways that headline rankings obscure.
Yet the same analysis exposes a vulnerability. A markets ledger built substantially on a single deal type — however structurally sound — remains sensitive to supply-side disruption. Beijing’s pace of approval for A+H candidates, capital controls, US–China geopolitical temperature, and the health of mainland equity markets all exert pressure on the same structural mechanism. The exchange is not diversified in the way, say, the NYSE is diversified.
That asymmetry matters when a US exchange can attract a $75 billion offering in a sector — commercial aerospace — where Hong Kong has essentially no issuer base at all. HKEX’s own March 2026 competitiveness consultation paper acknowledged that Greater China issuers typically choose between Hong Kong and the US, and that US regulatory developments bear more directly on HKEX competitiveness than developments in other non-US markets. The document was an unusually candid self-assessment from a regulator that had just reclaimed a global crown.
The Reform Agenda That SpaceX Just Made More Urgent
The SpaceX filing arrives at a moment when HKEX was already deep in the most ambitious overhaul of its listing rules in nearly a decade.
In March 2026, HKEX proposed a suite of reforms that, taken together, signal genuine structural ambition: halving the minimum valuation threshold for companies with weighted voting rights from HK$40 billion to HK$20 billion (approximately $2.6 billion); reducing the minimum market capitalisation for the revenue-based listing route; and — critically — allowing all IPO applicants to file prospectuses confidentially, a practice already standard in the United States.
That last reform is more significant than it sounds. Confidential filing allows companies to test regulatory appetite and valuation before committing publicly to a listing, reducing reputational risk. It was one of the specific advantages that US exchanges have historically held over Hong Kong in attracting high-growth technology companies wary of the spotlight that public-draft filings create. The irony is that SpaceX — which filed its S-1 confidentially with the SEC in April before going public — is the paradigmatic beneficiary of exactly the kind of process HKEX is now trying to replicate.
The biotech sector tells a similar story of structural deepening. DLA Piper’s 2026 market outlook noted that Hong Kong’s biotech index outperformed its Nasdaq counterpart by a wide margin in 2025 — rising nearly 100% compared to Nasdaq’s 20–30% gain — drawing global investors attracted by both the returns and the comparatively lower entry valuations. Since the introduction of Chapter 18A, which allows pre-revenue biotech companies to list in Hong Kong, more than 80 companies have joined the exchange. That ecosystem has reach in sectors adjacent to the kind of deep-tech companies that HKEX wants to attract through its newest listing channel, the Technology Enterprises Channel (TECH).
Still, the SpaceX listing clarifies the ceiling. HKEX’s structural reforms are necessary but insufficient to compete for capital-raising events of this magnitude. Elon Musk’s company didn’t choose Nasdaq because Hong Kong’s listing rules were too restrictive. It chose Nasdaq because it’s an American company, its investors are American, and the infrastructure — banks, lawyers, institutional relationships — for listing America’s largest companies runs through Wall Street, not Admiralty.
The Case for Not Panicking
Edward Au, southern region managing partner at Deloitte China, put the tension clearly at an April press conference: “The tide could change quickly,” he said, noting that US mega IPOs in AI and the space sector “could shift the global rankings quite easily.” He was right — and that’s precisely the argument for measured perspective rather than alarm.
Rankings are not destiny. Hong Kong finished fifth in 2024, first in 2025, and will likely finish second or third in 2026. What that volatility reveals is not structural fragility but the inherent lumpiness of large-cap IPO activity — a reality that affects every exchange, including Nasdaq, including the NYSE.
The deeper argument for Hong Kong’s resilience rests on the demand side. LSEG data shows more than 300 active IPO applications were in HKEX’s pipeline as of late 2025, including 92 A+H applicants alone. KPMG projects that number could grow. The listing queue for Chinese artificial intelligence companies — including names like Zhipu AI and MiniMax, which passed HKEX listing hearings in late 2025 — represents genuine, durable demand for Hong Kong as an international capital gateway. None of that pipeline disappears because SpaceX lists in New York.
JPMorgan, alongside UBS, has maintained its bullish posture on Hong Kong’s market, noting continued strong investor appetite for mainland technology and other listing candidates driven by the outlook for the Chinese economy.
There is also the question of what global investors actually want. For those seeking exposure to Chinese technology, innovation, and the mainland economy, Hong Kong is not interchangeable with Nasdaq. SpaceX’s Nasdaq listing will attract a specific class of investor with a specific risk appetite. The investors bidding for MiniMax’s Hong Kong IPO are playing a different game entirely.
A Crown, Not a Kingdom
The world’s largest IPO market in any given year is ultimately a title determined by a handful of very large deals. Hong Kong learned this in 2019, when a run of mainland mega-listings briefly carried it to the top. It learned it again in 2021, during the boom. And it’s relearning it now — this time, watching the crown travel in the other direction.
What HKEX has built since 2022, however, is something more durable than a rankings trophy: a reformed listing architecture, a deepening technology pipeline, and a structural A+H corridor with mainland China that no other exchange can replicate. None of that is erased by SpaceX’s June flotation.
The honest assessment is that Hong Kong’s IPO revival was always going to be tested by the gravitational pull of US capital markets when something genuinely historic came along. Something genuinely historic has now come along.
Whether the city’s exchange has built enough structural depth to absorb that gravity — and continue growing in its aftermath — is the question that matters for 2027 and beyond. On current trajectory, the answer looks more durable than the rankings suggest.
The crown moves. The architecture stays.
Discover more from The Economy
Subscribe to get the latest posts sent to your email.


Analysis
Malaysia Bets Its 2026 on “Execution” — And the Semiconductor Upcycle Is Doing the Heavy Lifting
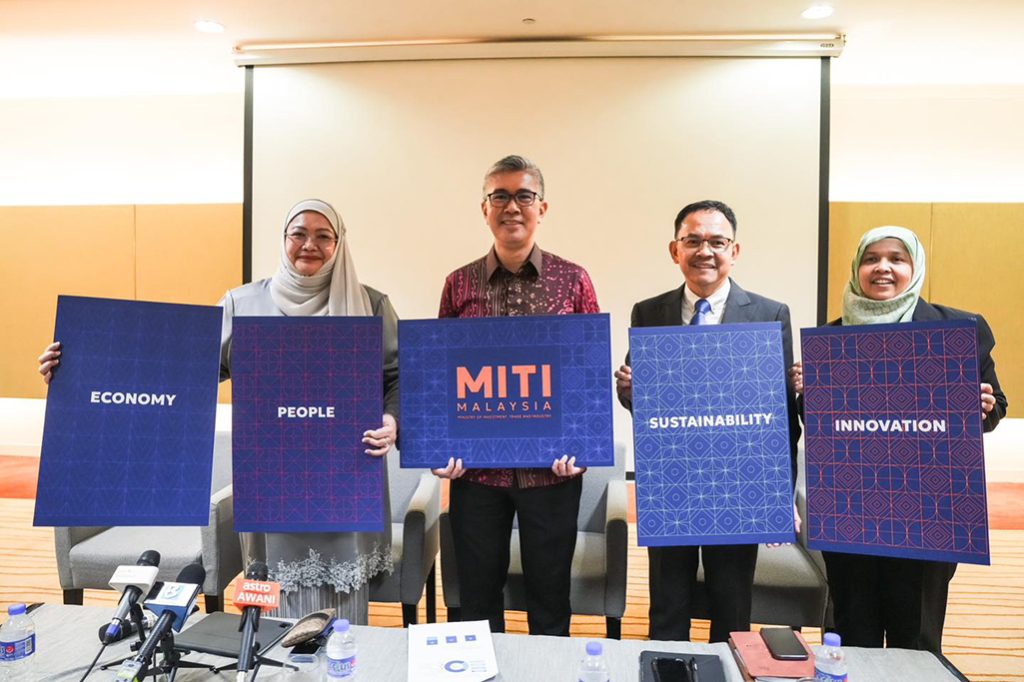
Malaysia’s government has declared 2026 a year of “execution” and “discipline” as the Anwar Ibrahim administration races to deliver on the 13th Malaysia Plan (RMK13) ahead of elections that could come as early as February 2028, according to Fortune’s interview with economy minister Akmal Nasrullah Mohd Nasir.
A Strong Base to Build From
Malaysia’s economy grew 4.9% in 2025 following 5.1% growth the year before, with unemployment falling to 2.9% — the lowest in a decade — and the ringgit trading at its strongest level in five years. HSBC’s ASEAN economist Yun Liu forecasts 4.6% growth for 2026, citing strength in electrical equipment manufacturing, tourism, and sound government policy, while Nomura economists have projected an even more bullish 5.2%, pointing to infrastructure spending under RMK13.
The ASEAN+3 Macroeconomic Research Office (AMRO) projects growth moderating slightly to 4.6% from an estimated 4.9% in 2025, describing Malaysia’s performance as reflecting its “entrenched position in global semiconductor and electronics value chains” and the broader global tech upcycle, according to AMRO’s assessment of Malaysia’s investment upcycle.
Navigating Washington Without Picking Sides
Malaysia’s trade relationship with the US has been turbulent. Washington imposed 25% tariffs on Malaysian goods in April 2025, rattling the country’s export-led economy, before a deal reduced US duties to 19% in exchange for Malaysia lowering tariffs on select American products, with exemptions carved out for aviation components and electrical equipment. Malaysia’s trade hit a record high of more than 3 trillion ringgit (roughly $780 billion) last year despite the friction.
Deputy finance minister Liew Chin Tong has framed Malaysia’s positioning explicitly around neutrality: the country is “not China, not the US,” a stance he argues gives Malaysia a strategic advantage in both geopolitical and supply-chain terms, according to Fortune’s reporting from the Forum Ekonomi Malaysia summit.
Capital Is Flowing In — From Everywhere
Malaysia recorded 22.8 billion ringgit (about $5.8 billion) in foreign direct investment in the first quarter of 2026, a 6.0% year-on-year increase, moderating from the prior quarter’s 48.7% surge. Inflows into information and communication technology services remained particularly strong, with China, Hong Kong, and Singapore serving as the primary capital sources, according to McKinsey’s Southeast Asia quarterly economic review. Bank Negara Malaysia has held its policy rate steady following a pre-emptive 25 basis-point cut in July 2025, with headline inflation projected to average just 2.0% in 2026.
The Long Game: Semiconductors, Rare Earths, and Nuclear Power
Beyond RMK13’s near-term targets, Malaysian officials are positioning the country’s industrial strategy around decades, not years. Minister Akmal has reiterated commitments to eliminate coal use by 2044 and reach net zero by 2050, while confirming Malaysia is actively “exploring the potential” of nuclear power to meet the energy demands of its expanding data-center and semiconductor sectors. AMRO’s structural policy guidance urges Malaysia to develop domestic semiconductor and rare-earth capabilities as a hedge against ongoing US-China “geoeconomic fracturing,” positioning the country as a trusted neutral hub for global manufacturers diversifying away from concentrated exposure to either superpower.
Discover more from The Economy
Subscribe to get the latest posts sent to your email.
Analysis
Canada’s Central Bank Holds the Line at 2.25% as Tariffs and a Middle East Oil Shock Collide
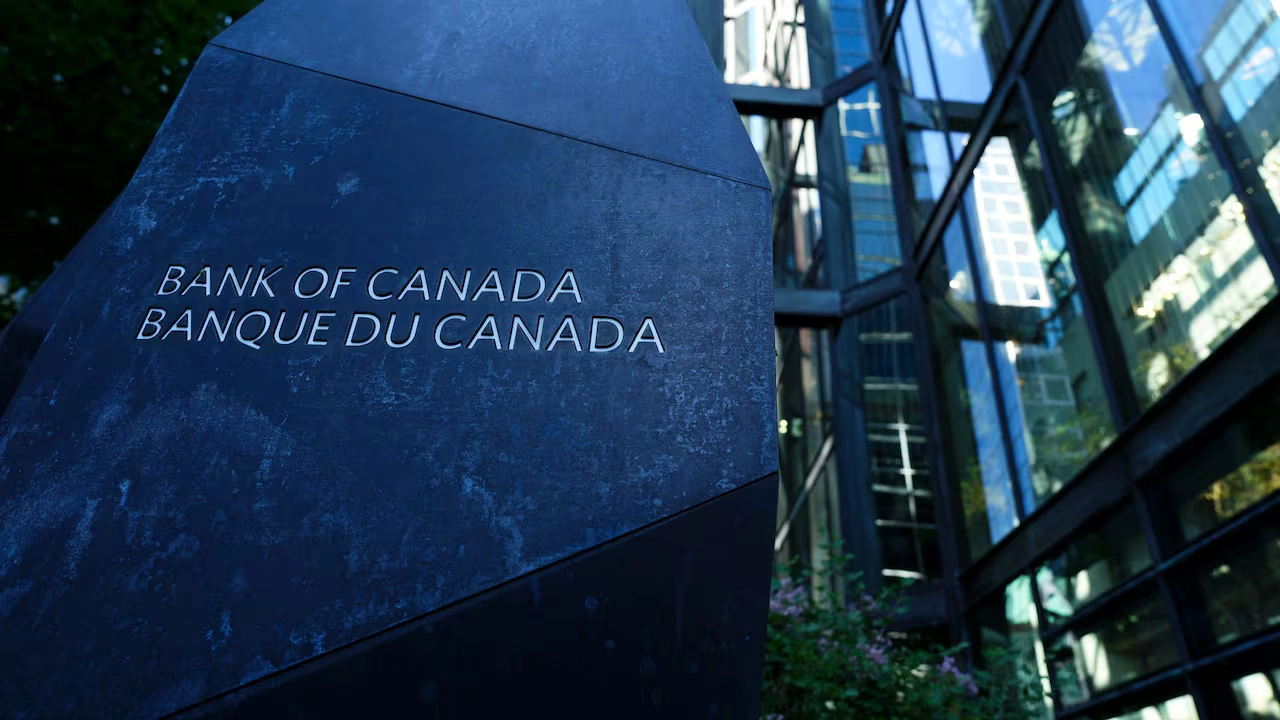
The Bank of Canada has maintained its policy rate at 2.25% for a consecutive meeting, navigating a rare combination of tariff-driven trade disruption and Middle East-driven energy inflation that is squeezing the economy from two directions at once, according to the Bank of Canada’s June 2026 rate announcement.
A Soft Economy Absorbing Two Shocks
Canadian GDP edged down 0.1% in the first quarter, weaker than the Bank’s April projection, even as global equity markets stayed buoyant and the Canadian dollar weakened against its US counterpart. Governing Council says it will “look through” the near-term inflation impact of the Middle East conflict but will not allow higher energy prices to become entrenched, a distinction the Bank has drawn explicitly to avoid repeating the policy mistakes of the 2021-22 inflation surge, per the Bank’s official statement.
The Bank’s April Monetary Policy Report forecasts GDP growth of just 1.2% in 2026, rising to 1.6% in 2027, as exports and business investment recover only gradually from a US tariff regime the Bank now treats as a structural, not cyclical, feature of the outlook, according to the Bank of Canada’s April 2026 report.
The Tariff Toll So Far
RBC Economics estimates the US has imposed a roughly 6% average effective tariff rate on Canadian exports, with most trade remaining exempt under CUSMA compliance rules, based on RBC’s structural-damage assessment. Steel, aluminum, and auto exports have declined sharply, while other sectors have proven more resilient than initially feared. HSB Pricing Lab research conducted with Bank of Canada staff found roughly a quarter of Canada’s own retaliatory tariff costs passed through to consumer prices before being rapidly unwound once most retaliatory measures were lifted.
The Canada-United States-Mexico Agreement (CUSMA) review is, in the words of Desjardins Group economists, “the defining issue” of 2026 for Canadian policy, with FTSE Russell analysts suggesting the agreement is unlikely to survive in its current form even as the broader global trading system adapts around it, according to Yahoo Finance Canada’s economist survey.
Structural Damage, Not Just a Cyclical Dip
Bank of Canada officials have been unusually direct about the long-run cost of trade disruption. The Bank’s own commentary describes Canada’s potential output growth falling to roughly 1.0% in 2026 before a modest recovery to 1.3% in 2027, driven by both trade friction and slower population growth from reduced immigration, according to the Bank of Canada’s “Structural change” commentary. The labour market remains soft, with unemployment in the 6.5%–7% range reflecting weak hiring rather than mass layoffs — what Indeed Canada economist Brendon Bernard describes as a “low-hire, low-fire” dynamic.
Watching the Same AI Risk From Ottawa
Notably, the Bank of Canada’s own risk assessment flags the same concern now dominating global financial commentary: a “sudden tightening in global financial conditions sparked by a correction in AI related stock market valuations” as a distinct downside risk to its inflation projections, according to RBC’s analysis of the Bank’s scenario planning. That makes Canada one of the first G7 central banks to formally embed AI-valuation risk into its published monetary policy framework.
The Bank’s next rate decision and full Monetary Policy Report are due July 15, 2026.
Discover more from The Economy
Subscribe to get the latest posts sent to your email.
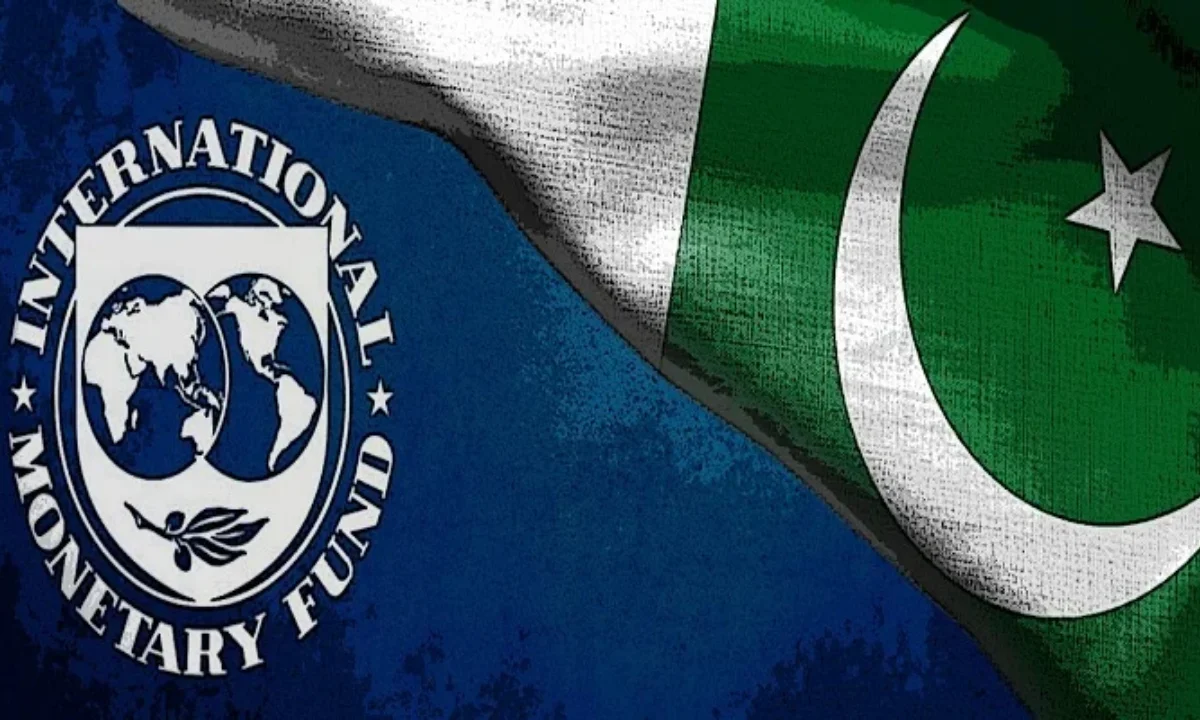
The International Monetary Fund’s Executive Board has completed the third review of Pakistan’s Extended Fund Facility and the second review of its Resilience and Sustainability Facility, unlocking continued disbursements at a moment when the country’s external buffers remain thin but improving, according to the IMF’s official press release.
Fiscal Discipline Holding, Barely
Pakistan is on track to deliver a primary surplus of 1.6% of GDP in FY26, in line with program targets, while gross reserves climbed to $16 billion at end-December from $14.5 billion at end-June 2025. GDP growth in the first half of FY26 averaged 3.8% year-on-year, driven by the auto, construction, and garment industries, per the IMF’s Country Report No. 26/101.
Not every benchmark was met. A structural benchmark requiring amendments to the Sovereign Wealth Fund Act to align governance safeguards with international standards was missed, though the changes are pending Cabinet approval. A separate continuous benchmark barring preferential tax treatment was also missed after an extension of a sugar-import tax exemption, which authorities subsequently repealed.
The Middle East War’s Fiscal Bite
The IMF flags that Pakistan’s current account is projected to worsen by roughly 0.2 percentage points in FY26 and 0.4 points in FY27 as higher fuel-import costs are only partially offset by compressed non-oil imports. Under the Fund’s April 2026 adverse scenario, the cumulative hit to GDP could reach 1.5 percentage points by FY27, with inflation and current-account deterioration each roughly 1.5 to 2.5 percentage points worse than a pre-conflict baseline. Business Recorder separately reported the IMF lowering Pakistan’s growth forecast to 3.5% for the current fiscal year while raising the inflation projection to 8.4%, according to Business Recorder’s coverage.
Revenue Mobilization Under Pressure
Meeting the FY27 fiscal target requires an additional 0.6% of GDP in revenue-collection measures to address chronically low tax buoyancy. The Federal Board of Revenue (FBR) is expected to generate 0.3% of GDP in additional revenue through its transformation plan and by streamlining tax expenditures, with an FBR revenue-collection floor proposed as a new quantitative performance criterion starting December 2026. At the provincial level, authorities are focused on broadening the General Sales Tax (GST) base for services.
Governance Costs Still Weighing on Growth
Pakistan’s economy loses an estimated 5–6.5% of GDP annually to corruption tied to entrenched “elite capture,” according to the IMF’s 2025 Governance and Corruption Diagnostic Assessment cited in Wikipedia’s economy of Pakistan overview. The IMF has urged continued momentum on anti-corruption institutions, state-owned enterprise reform and privatization, and energy-sector viability, alongside the broader structural reform push tied to the fund’s ongoing lending program.
For investors and businesses tracking Pakistan’s KSE-100 and rupee trajectory, the third review’s completion is a signal of continued program credibility, but the widening current-account gap tied to Middle East energy costs means the reform runway remains narrow.
Discover more from The Economy
Subscribe to get the latest posts sent to your email.

The Money Is Drying Up: How US Pressure Is Choking Off Russia-China Payment Channels

Indonesia GDP Growth 2026: 5.61% Expansion Marks Fastest Pace in Three Years

Singapore Makes Its Move to Become Asia’s Precious-Metals Capital

Malaysia Bets Its 2026 on “Execution” — And the Semiconductor Upcycle Is Doing the Heavy Lifting

Canada’s Central Bank Holds the Line at 2.25% as Tariffs and a Middle East Oil Shock Collide

China Economy 2026: Property Crash Meets Record AI-Driven Export Boom

Pakistan IMF Deal 2026: Third Review Cleared, Budget 2026-27 and Inflation Outlook

Bank of England Interest Rates 2026: Why Inflation Is Rising Again Despite a Hold

Fed Ends Forward Guidance: What Kevin Warsh’s Policy Shift Means for Markets

AI Bubble Warning 2026: Why BIS, IMF and Bank of England Fear a Market Crash

Russia Raised VAT to 22% to Pay for the War. It Still Isn’t Enough

Six Straight Quarters of Falling Prices: Inside China’s Deflation Trap

Canada Missed Its CUSMA Deadline. Now Its Economy Is “On Pause”

UK Stagflation 2026: Why the Bank of England May Hike Rates, Not Cut Them

Investors Pile Into Bullish Dollar Bets as ‘US Exceptionalism’ Trade Returns

Nasdaq Tumbles 4% as Chip and Memory Stocks Sink: A $1.2 Trillion Wipeout

How to Fix Pakistan’s Debt Economy: A Structural Blueprint

Grinding the Already Ground: Pakistan’s Inflation Crisis

Japan’s Nikkei Scales Record Peak as AI Shares Track US Chip Rally

JPMorgan Cuts Anthropic AI Access in Hong Kong

Smash Capital Leads $200M Funding for Allen Control Systems

New Investment Super-Cycle: AI, Green Energy & Re-Shoring

Middle East Conflict Oil Prices: The $4 Surge Explained

Xponential Fitness Franchise Lawsuit: The $3.97M Judgment

Germany Rail Network Upgrade: Inside the €100bn Rescue Plan

The End of the Chatbot: Why OpenAI is Tearing Up Its Most Successful Product

The Global Sovereign Debt Crisis: Fiscal Strain in a High-Rate Era

Fiscal Policy under Pressure: High Debt, Rising Risks
-

 Markets & Finance6 months ago
Top 15 Stocks for Investment in 2026 in PSX: Your Complete Guide to Pakistan’s Best Investment Opportunities
-

 Analysis5 months ago
Top 10 Stocks for Investment in PSX for Quick Returns in 2026
-

 Analysis5 months ago
Brazil’s Rare Earth Race: US, EU, and China Compete for Critical Minerals as Tensions Rise
-

 Analysis4 months ago
Johor’s Investment Boom: The Hidden Costs Behind Malaysia’s Most Ambitious Economic Surge
-

 Banks6 months ago
Best Investments in Pakistan 2026: Top 10 Low-Price Shares and Long-Term Picks for the PSX
-

 Investment6 months ago
Top 10 Mutual Fund Managers in Pakistan for Investment in 2026: A Comprehensive Guide for Optimal Returns
-

 Global Economy6 months ago
15 Most Lucrative Sectors for Investment in Pakistan: A 2025 Data-Driven Analysis
-

 Global Economy6 months ago
Pakistan’s Export Goldmine: 10 Game-Changing Markets Where Pakistani Businesses Are Winning Big in 2025