
Analysis
Five PSX Stocks Worth Owning Before the Second Quarter Ends

Pakistan’s stock market doesn’t do anything quietly. In January 2026, the KSE-100 Index scaled an all-time high of 189,556 points — a figure that would have seemed hallucinatory to anyone watching the exchange crater in the summer of 2023. By early May, Operation Sindoor had knocked the index below 104,000, triggering circuit breakers and a one-hour trading halt as panic selling swept through commercial banks, cement, and energy counters alike. The recovery has been partial and fragile. Yet the volatility, for investors with conviction and a horizon measured in quarters rather than days, has done something useful: it’s separated price from value on a clutch of names that were, frankly, overdue for a reset.
With the second quarter of 2026 drawing to a close on June 30, these five stocks on the Pakistan Stock Exchange represent the clearest alignment of macro tailwinds, sectoral fundamentals, and current-price opportunity.
The five PSX stocks best positioned before June 30, 2026 are MCB Bank (shorter bond duration, highest sector dividend), Meezan Bank (Islamic banking structural growth), Lucky Cement (diversified industrial conglomerate), OGDC (oil production at six-and-a-half-year highs), and Fauji Fertilizer (dominant urea pricing power). Each offers a company-specific investment case resilient to the current rate and geopolitical environment.
The Context: A Market That Has Been Through It
To understand where the best PSX stocks for Q2 2026 sit in the cycle, you need to understand what the market has absorbed in less than five months.
The State Bank of Pakistan surprised analysts on April 27, 2026 by raising its benchmark policy rate by 100 basis points to 11.5%, marking the first rate hike since June 2023. The decision came amid heightened economic uncertainty, volatile oil prices from Middle East tensions, and inflation climbing to 7.3% in March — breaching the central bank’s 5–7% target range for the first time since October 2024.
That’s a lot to absorb. An unexpected tightening cycle, a geopolitical shock severe enough to halt trading, and inflation re-accelerating — all in a single quarter. Yet even within this turbulence, the IMF approved a $1.2 billion tranche on May 8, 2026, providing a floor of institutional confidence beneath the chaos.
The picture is more complicated than the bearish headlines suggest. Corporate earnings, though uneven, remained broadly positive through the first quarter of calendar 2026. Pakistan’s banking sector collectively achieved profits of Rs. 671 billion in 2025 — a notable increase from Rs. 600 billion in 2024, even as the benchmark policy rate saw reduction during that year. The structural story of Pakistan’s economic recovery, backed by a three-year IMF Extended Fund Facility, hasn’t reversed. It’s been interrupted.
The Five Stocks: A Selective Case
The best PSX stocks to buy in Q2 2026 are not sector plays or index bets. Each of the five names below has a company-specific argument that would hold up even if the macro environment stayed difficult. In aggregate, they represent the clearest risk-reward in a market that has, in the space of a few months, oscillated between euphoria and panic.
1. MCB Bank (MCB)
MCB is the quiet achiever. It’s not Pakistan’s largest bank, it doesn’t carry the geopolitical weight of Habib Bank or the growth narrative of Meezan, and that restraint is precisely the point right now.
Banks such as MCB Bank are considered relatively better positioned to weather the current rising-yield environment, maintaining shorter-duration portfolios that limit their vulnerability to mark-to-market losses. Analysts expect these institutions to recover more quickly as market conditions stabilize. While United Bank Limited is seen as the most exposed of the major lenders to yield duration risk, with an estimated post-tax hit of Rs. 117 billion to its book value, MCB’s shorter book shields it from the worst of that balance-sheet pressure.
MCB Bank offered the highest dividend in the banking industry at Rs. 36 per share in 2025, with an EPS of Rs. 45.73. For investors who want banking sector exposure without carrying UBL’s interest-rate duration, MCB is the structurally safer entry.
2. Meezan Bank (MEBL)
Meezan Bank is not really a bank play. It’s a demographic play disguised as a bank.
Pakistan’s Islamic finance sector is growing faster than the conventional system, driven by the same ideological and regulatory momentum that has transformed Malaysian and Indonesian markets over two decades. Meezan holds an unassailable structural position as Pakistan’s largest dedicated Islamic bank, and no conventional competitor can credibly replicate its Shariah compliance at scale.
Meezan Bank’s market capitalization stood at Rs. 870.71 billion as of May 12, 2026 — an increase of 78.62% in one year. Even after the geopolitical correction, the structural bull case hasn’t moved. Seven analysts unanimously rate the stock a Strong Buy, with an average 12-month price target of Rs. 577 — implying upside of over 16% from the mid-April price of Rs. 497.
The earnings execution has been precise. MEBL reported quarterly earnings of Rs. 12.10 per share against a consensus estimate of Rs. 12.09 — a number that signals a management team in full control of its cost and revenue levers. This isn’t a story about a rate cycle. It’s a story about irreversible market share in a product vertical that’s growing structurally.
3. Lucky Cement (LUCK)
Call it a cement company if you must, but you’d be underselling it.
Lucky Cement, through its parent and subsidiary network spanning polyester, soda ash, pharmaceuticals, chemicals, automobiles, and power generation, has assembled the most diversified industrial book on the KSE-100. That diversification is now providing real earnings resilience. Lucky Cement’s Q3 net income came in at Rs. 22.62 billion, up from Rs. 21.99 billion in Q2 — a business delivering sequential quarterly growth even as the broader index swung wildly around it.
The cement sector was the second-largest positive contributor to the KSE-100’s April 2026 recovery, adding 1,735 points to the index, with LUCK among the leading individual contributors at 768 points. When the market’s recovery was at its most selective — favouring fundamentals over momentum — cement and LUCK led the way.
Pakistan’s infrastructure ambitions, regardless of which government is in office, require cement. And Lucky’s ability to cross-subsidise its cyclical core with chemicals, automotive, and power revenues makes it structurally more valuable than a price-to-book valuation of the cement segment alone would suggest.
4. Oil and Gas Development Company (OGDC)
OGDC is the government’s most important listed asset and, at current prices, arguably its most overlooked one.
OGDC’s oil production crossed 40,000 barrels per day — its highest level in more than six and a half years — suggesting improving operational momentum despite receivable and curtailment challenges. That’s a material operational milestone, and one that tends to precede upward earnings revisions.
Analysts have adjusted price targets for OGDC to reflect updated expectations for revenue growth of 16.42% and a profit margin of 40.80%, with a future P/E of 12.84x — indicating a modestly stronger earnings profile being incorporated into their models. At a forward earnings multiple well below regional peers and with production volume trending upward, the downside is limited and the recovery trade is straightforward.
The circular debt overhang — historically OGDC’s most persistent structural discount — is actively improving. Cash recoveries now exceed billings, power-sector receivables have declined sharply, and the remaining backlog is expected to clear within the quarter, with gas expected to regain prominence in the production mix as new fields come online.
5. Fauji Fertilizer Company (FFC)
The final pick is the one most directly tied to what Pakistan is — an agrarian economy where the state of the harvest matters more to most households than the price of a US Treasury bond.
FFC holds the dominant market position in urea, the fertilizer that underpins Pakistan’s wheat and rice output. When the government needs to support agricultural productivity — and it always does — FFC is the conduit. That political economy backing is a structural moat most international investors consistently underprice.
The fertilizer sector was the fourth-largest positive contributor to the KSE-100 in April 2026, adding 987 points to the index. Fauji Fertilizer’s extraordinary earnings growth in the prior fiscal year — driven by fertilizer price increases and product diversification into urea, DAP, power, and food segments — has given the company a dominant market position that makes it a standout performer in its sector.
With inflation creating pressure on input costs across the agricultural chain, the farmers who need FFC’s urea have limited alternatives. Pricing power combined with volume certainty is a rare combination on the KSE-100.
The Analytical Layer: What the Rate Hike Changes, and What It Doesn’t
How Will the SBP Rate Hike Affect PSX Stocks in Q2 2026?
The April 27 rate hike to 11.5% is contractionary, but its equity market consequences are asymmetric. Banks with long-duration bond portfolios face mark-to-market pressure; banks with shorter books, like MCB and Meezan, face less. Companies with strong pricing power, like FFC, can pass cost increases through to consumers. Capital-intensive industrials with clean balance sheets, like LUCK and OGDC, are less sensitive to the risk-free rate than leveraged players. The five stocks selected here are precisely the names that the rate environment discriminates in favour of, not against.
The deeper structural question is whether the rate hike marks the beginning of a prolonged tightening cycle or a one-off response to a supply shock. The SBP’s Monetary Policy Committee assessed that the current supply shock may push inflation to double digits in coming months before it begins to ease, but inflation is expected to stay above the upper bound of the target range for most of FY27. That’s hawkish language, but it’s language tied to a supply-side shock — Middle East energy volatility, rupee pressure, monsoon uncertainty — rather than a structurally overheating economy. Once the supply shock fades, the easing cycle resumes. Investors who hold through the noise capture the full re-rating.
Implications and Second-Order Effects
The geopolitical volatility of May 2026 has done something that years of steady gains cannot: it has created entry points in some of Pakistan’s best-managed companies at prices that reflect fear rather than fundamentals.
AKD Research projects the KSE-100 to reach 263,800 points by December 2026, driven by anticipated monetary easing, a stronger external account, and sustained structural reforms. The brokerage expects the rally to be fuelled by higher returns on equity in banking, better profitability in E&P and OMC firms, and a strong fertilizer sector performance. Even the most conservative broker models see a meaningful floor well above current levels.
The IMF’s continued engagement is the key stabilizer. As long as Islamabad remains compliant with its Extended Fund Facility conditionalities — and the May 8 tranche approval signals it is — the macro floor holds. Forex reserves, which once threatened to fall to catastrophic lows, are now on a rebuilding trajectory.
What the volatility has done, perversely, is compress valuations on fundamentally sound names. A forward P/E of approximately 6.8x for the KSE-100 — against a historical average of 8x — is not a market pricing in deterioration. It’s a market pricing in fear. The difference matters to investors with a three-to-six-month horizon.
The Counterargument: Why This Might Not Work
Steel-manning the bear case is not an optional exercise on the PSX in May 2026. It’s essential.
The most credible risk to this thesis isn’t geopolitical noise — it’s fiscal slippage. The IMF noted that Federal Board of Revenue tax collections slowed considerably to 10.2% year-on-year during July–November FY26, implying significant acceleration required to achieve the budgeted tax collection target in the remaining months of the fiscal year. If revenue collection misses materially, the government faces a binary choice: cut spending aggressively in an election-sensitive environment, or risk programme derailment.
The yield shock has also left real scar tissue. The banking sector’s gross revaluation losses are estimated at Rs. 685 billion, with a net impact of approximately Rs. 95 billion across major institutions after adjusting for existing surpluses. This constrains the sector’s capacity to grow lending precisely when economic recovery should be generating credit demand.
And there’s the India-Pakistan dimension. The ceasefire that followed Operation Sindoor has, historically, proved durable. Both countries have strong incentives to de-escalate. But “historically” is not a guarantee, and a second shock event in the same quarter would test the thesis hard.
The counterargument is real. It doesn’t, however, change the specific company cases for MCB, Meezan, LUCK, OGDC, and FFC. All five have balance sheets capable of weathering an extended macro storm. The question is one of patience, not conviction.
Closing
Pakistan’s equity market is not for the faint of heart. Never has been. What it offers, repeatedly and to those willing to hold through the storms, is the chance to buy genuinely good businesses at prices that discount the risk rather than the reality.
The KSE-100’s journey from 40,000 points in mid-2023 to nearly 190,000 at its January 2026 peak was not accidental. It reflected a real improvement in Pakistan’s macro fundamentals — a collapsing inflation rate, IMF stabilization, recovering forex reserves, and a corporate earnings boom. That improvement hasn’t evaporated; it’s been temporarily obscured by a rate hike, a geopolitical shock, and the ordinary noise of a market that moves fast in both directions.
MCB Bank’s balance sheet discipline, Meezan’s structural growth story, Lucky Cement’s diversified industrial logic, OGDC’s production recovery, and Fauji’s pricing power represent the sharpest set of fundamental arguments available on the PSX heading into June 30. They’re not risk-free. Nothing in frontier markets ever is.
But in a market that has consistently rewarded conviction over caution, these five names make the case for both.
Discover more from The Economy
Subscribe to get the latest posts sent to your email.


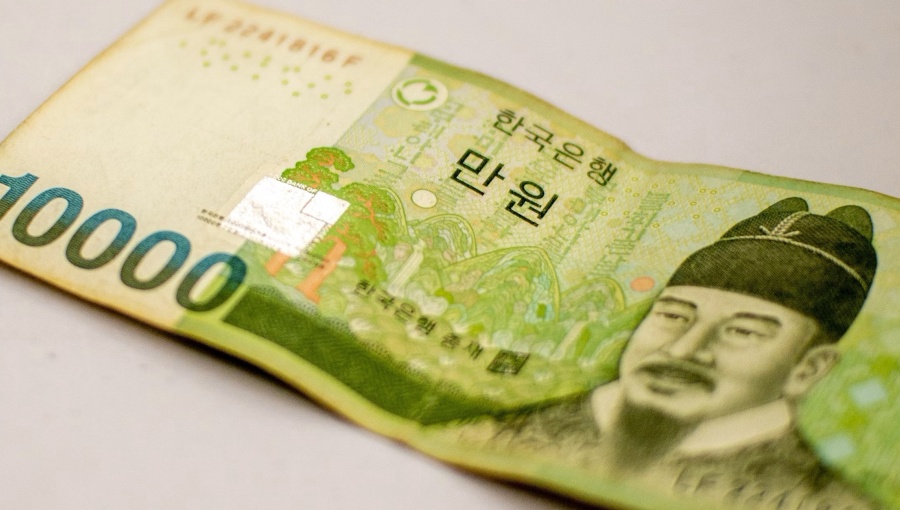
South Korea’s won has not traded at these levels since Lehman Brothers collapsed and the world was sorting through the wreckage of its worst financial crisis in eighty years. That the currency has returned to those depths under entirely different circumstances — not a global credit event, but a sustained combination of dollar strength, political uncertainty, and structural capital outflows — makes the current episode more complex, and in some ways more concerning, than 2009.
The Numbers
On July 1, 2026, the won declined as much as 0.6 percent to 1,559.10 per dollar, following a prior session low of 1,562.20 — a level last seen in March 2009. Overseas investors sold a net 1.46 trillion won ($938 million) of stocks in the Kospi index on a single trading day, marking the eighth consecutive session of equity outflows from the Korean market.
“The dollar’s strength is such that a fresh low for the won would not be surprising,” said Moon Dawoon, an economist at Korea Investment & Securities. “If it does break through, it will be difficult to identify the next technical level, so from a qualitative perspective, the downside for the won should be kept open to around 1,600 per dollar.”
A breach of 1,600 would represent territory not visited since the 1997 Asian financial crisis — a threshold that carries both technical and psychological significance for regional currency markets.
Why the Won Is Falling
The 2026 won story is not a simple export slump. South Korea continues to run a current-account surplus — $18.70 billion in December 2025, $13.26 billion in January 2026. The fundamentals of the trade balance have not deteriorated dramatically. What has changed is the capital account.
Several forces are pulling simultaneously in the wrong direction. The US-Korea interest rate differential remains wide, making dollar-denominated assets relatively attractive to Korean investors. Structural outward investment — Korean residents and institutions consistently moving capital into foreign assets — keeps upward pressure on dollar demand. Trade friction and tariff uncertainty from the United States raise risk premia on Korean assets broadly. And geopolitical stress in the Middle East has driven a risk-off flight to dollar safety that penalises emerging market currencies disproportionately.
The IMF estimated Korea’s growth at 0.9 percent in 2025, with a projected rebound to 1.8 percent in 2026 — an improvement, but well below Korea’s historical growth trajectory. The Bank of Korea has held its base rate at 2.50 percent, balancing growth support against exchange-rate and financial stability concerns.
The Semiconductor Exposure
Korea’s currency vulnerability is amplified by its sector concentration. Samsung and SK Hynix together constitute a dominant share of the global memory chip market — and global memory chip markets are themselves being stress-tested by the AI infrastructure boom. The so-called “RAMageddon” dynamic, in which AI-fuelled demand for memory chips has sent prices soaring, has provided export revenue support. But it has also created concentration risk: a reversal in AI capex demand, which the BIS and Chinese hedge funds have been warning about, would hit Korea’s export base and currency simultaneously.
The Kospi index’s heavy weighting toward Samsung, Hyundai, and semiconductor-adjacent companies means that institutional investors who reduce technology sector exposure globally tend to sell Korean equities as a primary execution path. Eight consecutive days of outflows is the market expressing that thesis in real time.
Regulatory Response
Following an earlier episode in which the won slid to its lowest since 2009 in June 2026, South Korean authorities convened an emergency meeting between the Bank of Korea governor and financial regulators. The government announced measures including stepped-up oversight of offshore currency derivatives, boosted inspections for suspected market misconduct, and investigations into potentially illegal foreign-exchange transactions.
The won briefly rebounded following those announcements before resuming its decline in early July. The pattern is familiar in currency management: administrative measures can slow momentum but rarely reverse the underlying capital flow dynamics that are driving the move.
Regional Contagion Signals
The won’s decline on July 1 led a broader retreat in Asian currencies, reflecting the dollar’s role as the default safe haven in periods of global risk aversion. The Japanese yen simultaneously extended losses to multi-decade highs against the dollar — a different dynamic driven by the US-Japan rate differential, but contributing to a picture of simultaneous stress across the major Asian currency pairs.
Emerging market investors are monitoring whether won weakness begins translating into spillover dynamics: whether Korean retail investors rotate into crypto as a won hedge (measurable through the “kimchi premium” on Korean crypto exchanges), and whether institutional outflows from Korean equity and bond markets intensify as currency losses erode total returns for foreign holders.
A currency at 1,562 per dollar, trending toward 1,600, with eight straight days of equity outflows and a semiconductor sector exposed to an AI capex cycle that global institutions are increasingly questioning — is not a crisis yet. But it is accumulating the conditions for one.
Discover more from The Economy
Subscribe to get the latest posts sent to your email.
Analysis
Japan’s $2.3 Trillion Bet: Takaichi’s AI-Semiconductor Moonshot and the Fiscal Tightrope It Requires
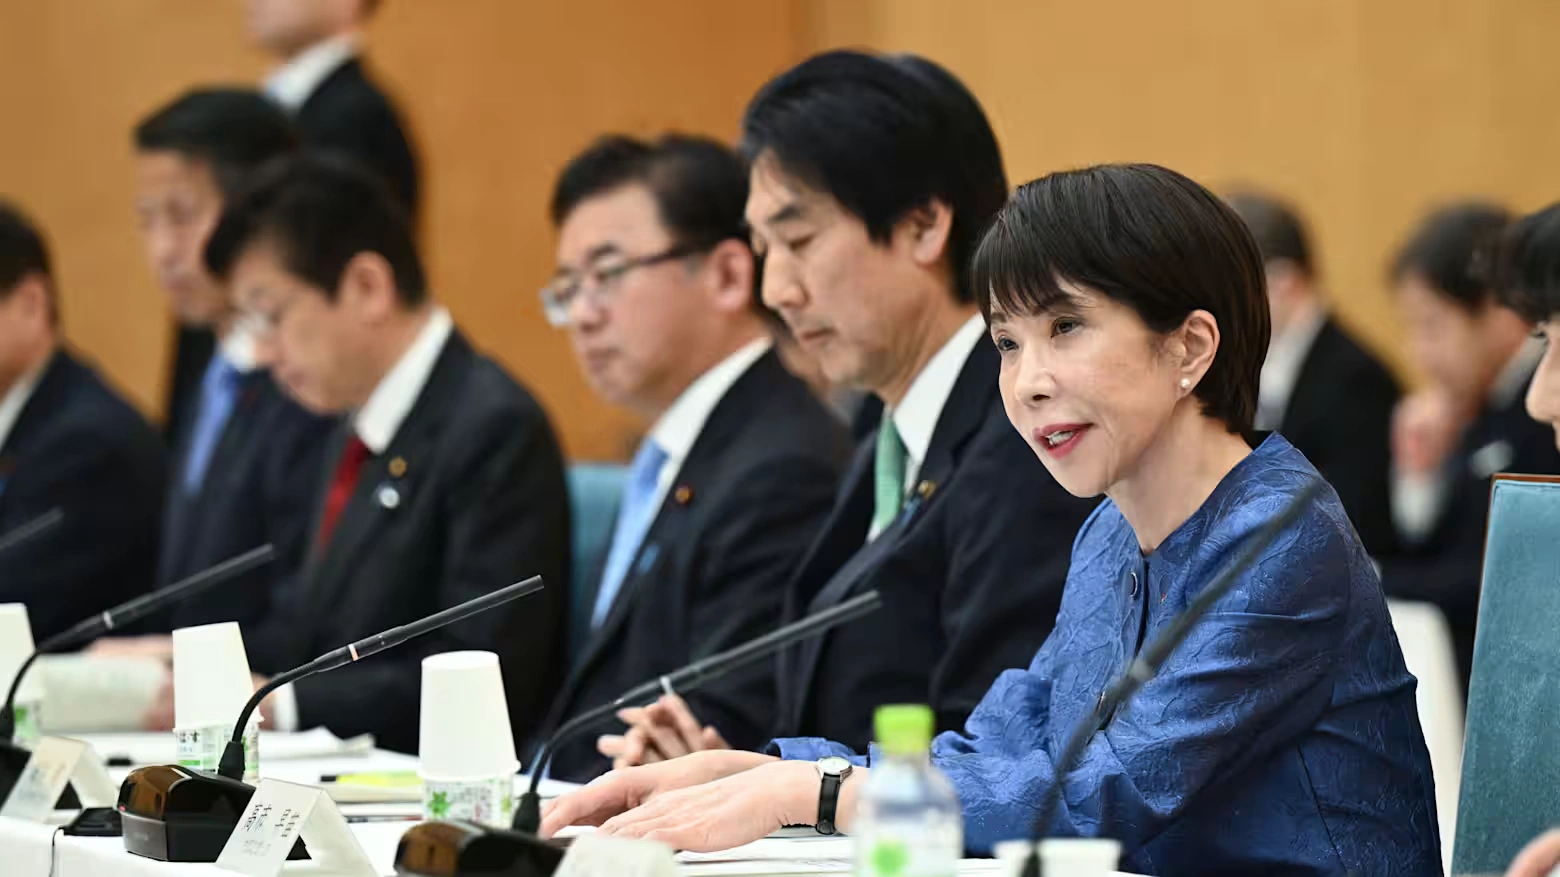
Japan has never been timid about industrial policy. But the plan unveiled by Prime Minister Sanae Takaichi on June 24, 2026, represents an ambition of a different magnitude: JPY 370 trillion — approximately $2.3 trillion — in combined public and private investment across 17 strategic sectors over the 14 fiscal years ending in March 2041. It is the most consequential economic growth blueprint Japan has released in a generation, and it carries risks proportionate to its scale.
The Numbers and Their Logic
The plan’s centrepiece is AI and semiconductors, which together account for JPY 101.6 trillion — nearly one-third of the total. Of that allocation, the largest share targets semiconductor manufacturing. The government projects that domestic chip sales, currently at roughly 8 trillion yen annually, will reach 40 trillion yen by fiscal 2040: a fivefold increase that would require sustained policy commitment, significant private capital mobilisation, and a structural reconfiguration of Japan’s manufacturing base.
Beyond semiconductors, the plan earmarks $65 billion specifically for AI infrastructure — data centres, power capacity, and the hardware underlying large-scale AI deployment. Vertical AI tools, built for specific industries such as healthcare, manufacturing, and logistics, receive separate priority funding alongside physical AI systems. The government projects semiconductor investment alone will generate 443 trillion yen in economic spillovers by fiscal 2040, with physical and vertical AI adding a further combined 366 trillion yen.
Additional sectors covered include defence, space development, advanced manufacturing, shipbuilding, and critical minerals — all framed as pillars of economic security in an era of intensifying geopolitical competition.
The Political Context
Takaichi became Japan’s first female prime minister in October 2025, following a decisive Liberal Democratic Party electoral victory in February 2026 that gave her government the political runway to pursue long-horizon strategies. The plan builds on prior investment commitments: since 2021, the government has channelled roughly 7.2 trillion yen into semiconductors and AI, including approximately 2.6 trillion yen in support for state-backed chip venture Rapidus.
The Nikkei 225 briefly surpassed 72,000 following the announcement — a level that reflected AI-adjacent stock enthusiasm, particularly around SoftBank and Tokyo Electron. The market signal was interpretable in two ways: confidence in the industrial vision, or exuberance about government-supported capital flows into a sector already attracting speculative premium.
The Fiscal Tightrope
The plan’s fiscal architecture is where complexity enters. According to the Japanese government’s roadmap, public funding accounts for slightly less than half of the total, with the remainder expected from private capital. Three long-term fiscal scenarios were released alongside the plan, with sharply divergent outcomes.
In the most optimistic case, the strategy delivers as intended: Japan’s debt-to-GDP ratio declines steadily even as the government contributes 10 trillion yen in real annual spending. In the two alternative scenarios, where market demand or technological uptake falls short, the ratio resumes its upward trajectory during the 2030s.
Critically, all three scenarios assume inflation stabilises at around 2 percent. They exclude the potential costs of expanded defence spending and proposed consumption-tax reductions, meaning actual fiscal pressure could significantly exceed the government’s baseline projections. Meanwhile, Japan’s superlong government bond yields have risen to multi-decade highs — a market signal that investor confidence in fiscal discipline is not fully intact, even as the Nikkei rallied.
The Bank of Japan, under Governor Kazuo Ueda, has signalled continued rate increases in response to above-target inflation and upside price risks. Deputy Governor Ryozo Himino reinforced that the BoJ expects to adjust policy in response to economic conditions and financial developments, while monitoring risks including the conflict in Iran. A government pushing expansionary fiscal policy while the central bank tightens monetary conditions is a combination that creates sovereign yield risk — precisely the kind of sovereign-financial nexus the BIS has flagged as a global vulnerability.
The Industrial Security Imperative
The plan’s framing as an economic security initiative, rather than purely a growth strategy, reflects Japan’s reading of the current geopolitical moment. Supply chain resilience, technological self-sufficiency, and domestic semiconductor capacity have become strategic imperatives for governments across the developed world in the wake of the pandemic disruptions and US-China technology competition.
Japan’s bid to quinttuple domestic chip sales by 2040 places it in direct competition with the United States’ CHIPS Act investments, the EU’s European Chips Act, and South Korea’s semiconductor cluster ambitions. The difference is that Japan is making the largest single national commitment to that competition — a bet that the country has identified the window for industrial transformation, and that the cost of missing it exceeds the fiscal risk of pursuing it.
Whether the numbers work depends on outcomes that no government roadmap can control: whether AI adoption curves justify the infrastructure being built, whether Rapidus can achieve competitive semiconductor yields, and whether private capital follows government funds at the scale the plan requires. The bet is large. The stakes are higher.
Discover more from The Economy
Subscribe to get the latest posts sent to your email.
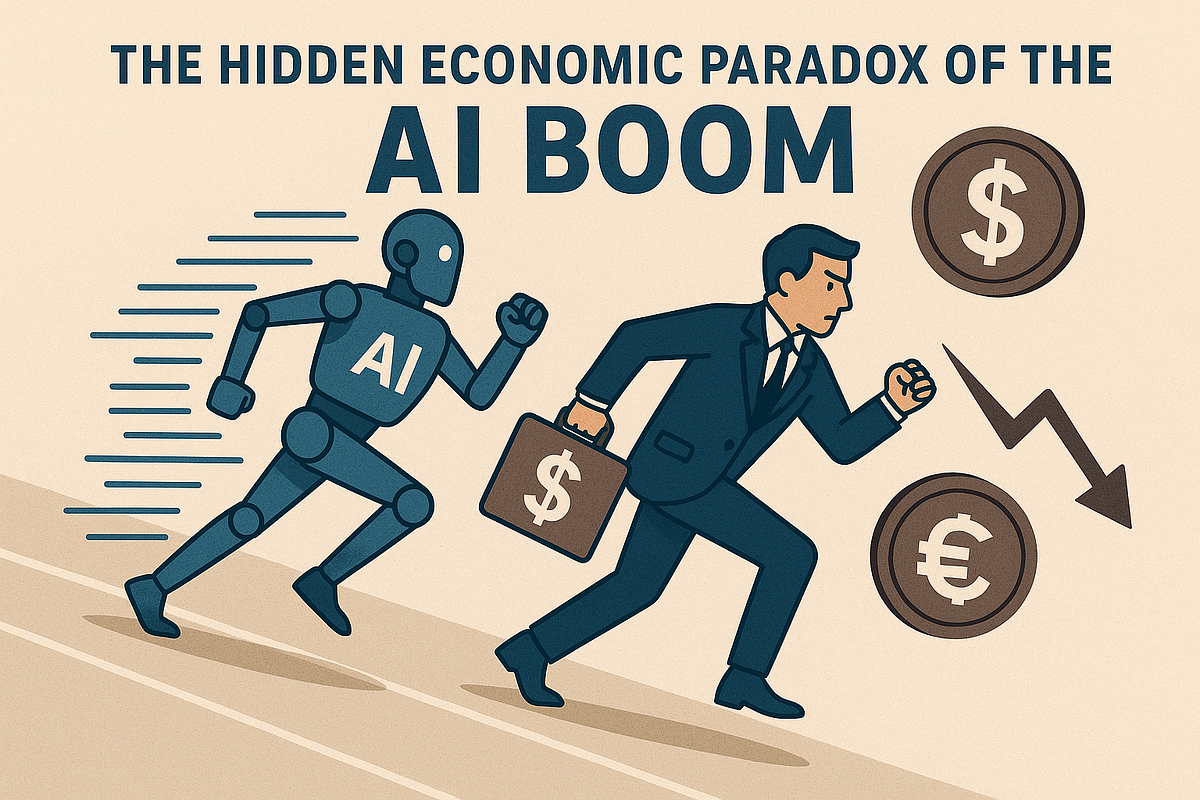
The numbers are unambiguous, even if their implications remain contested. In 2025, global personal wealth rose at its fastest pace since 2017. Nearly one million new millionaires were minted. The billionaire population swelled by 13 percent. And in most of the 56 markets where the UBS Global Wealth Report tracks outcomes, median wealth — the wealth of the person sitting precisely in the middle of the distribution — actually declined.
That combination, record headline growth alongside falling typical household wealth, is the defining economic signature of the AI boom. It raises questions about the sustainability of an economic narrative built on aggregate progress.
What the UBS Report Found
The UBS Global Wealth Report 2026, released June 30 and built from data spanning 56 markets representing 92 percent of all global wealth, recorded 10.8 percent growth in personal wealth in 2025 — the fastest rate in at least three years. The millionaire population grew by 1.5 percent, adding close to one million people at a pace of roughly 2,680 per day.
More than 440,000 of those new millionaires were American — exceeding 1,200 per day — making the United States responsible for close to half of the worldwide increase. The United Kingdom added more than 43,000 new millionaires, while France, Spain, Japan, and India each added more than 30,000.
The report also counted 3,302 US dollar billionaires, an increase of 383 people, or 13.1 percent, over the prior year. Billionaire wealth grew by 25 percent on average in the year ended in April, compared with a 10.8 percent rise in average personal wealth. James Mazeau, an economist at UBS, attributed the outperformance directly to the AI boom in equity markets.
The Median Paradox
UBS chief economist Paul Donovan acknowledged to Fortune what the headline figures conceal: “There is a concentration of equity wealth into the very highest wealth and income cohorts, which means that periods of strong equity performance will widen the gap between the two.” When asset markets rise and the gains are overwhelmingly held at the top of the distribution, aggregate averages can soar while the typical household experiences stagnation or decline.
The pattern is not incidental. Software and platform businesses scale at close to zero marginal cost, meaning that when an AI-adjacent product wins, it tends to win globally — and the revenue, profit, and equity all funnel into very few hands. The World Inequality Report 2026 sharpened the point with striking precision: just 56,000 ultra-wealthy individuals — the top 0.001 percent — now control more wealth than the poorest 4 billion people on Earth combined. Their share of global wealth has nearly doubled since 1995.
Since 1995, billionaire wealth has compounded at approximately 8.5 percent annually. The bottom half of the global population has grown theirs at roughly 3.4 percent.
The Ultra-Wealthy Tier Accelerates
Altrata, a wealth intelligence firm, tracked a 14.4 percent jump in 2025 in the number of people worth more than $30 million — reaching a record 556,850 worldwide. In mainland China, the $50 million to $100 million cohort has compounded in real terms at nearly 31 percent annually since 2000. The United States’ top 1 percent of households, per the Federal Reserve, now holds approximately 32 percent of the nation’s total wealth — the highest proportion since the Fed began compiling the relevant data in 1989.
Within this hierarchy, the AI trade has functioned as a supercharger. Founders who hold large equity stakes in companies that have benefited from AI-driven market re-ratings have watched their personal wealth compound at the same exponential rates as the underlying businesses. The upcoming major IPOs — SpaceX, Anthropic, and OpenAI — are projected to create a new cohort of billionaires and dramatically expand the existing ultrawealthy population.
The Political Economy of the K-Shape
Bloomberg’s K-shaped economy analysis projected that the divergence between asset holders and wage earners will deepen further. The political consequences are already visible. California Governor Gavin Newsom, in comments reported ahead of a potential 2028 presidential run, proposed a national wealth tax and an initiative to give Americans a direct stake in AI development. Former Amazon CEO Jeff Bezos called for the bottom 50 percent of earners to pay zero federal income tax.
Axios reported that a growing number of tech billionaires are developing prescriptions for AI-fuelled inequality — not from altruism, but from a calculation that populist revolt represents a greater threat to their interests than redistributive taxation. “The pitchforks are here, they’re not just coming,” Newsom warned, predicting that resentment toward billionaires and AI-driven automation will dominate the 2026 and 2028 electoral cycles.
Donovan, the UBS economist, noted that governments are likely to seek to mobilise wealth to lower the cost of debt finance. What that means in practice — wealth taxes, forced investment mandates, or some novel fiscal instrument — remains the defining policy question of the decade the AI boom is creating.
Discover more from The Economy
Subscribe to get the latest posts sent to your email.

$109 Trillion and Counting: How the World’s Sovereign Debt Crisis Is Being Built in Plain Sight

South Korea’s Won Slides to Its Weakest Since Lehman: Asia market impact

Japan’s $2.3 Trillion Bet: Takaichi’s AI-Semiconductor Moonshot and the Fiscal Tightrope It Requires

A 13% Surge in Billionaires, a Falling Median: The AI Boom’s Wealth Paradox

The Next Banking Crisis Won’t Come From Bad Loans. JPMorgan Says It Will Come From Hackers.

The Kill Switch: Bank of England Moves to Contain Agentic AI Before It Crashes Financial Markets

The AI Super Bubble Is Ready to Burst

Carry Trade Unwind 2026: How the Yen’s Snapback Triggered a Global Margin Call

Bitcoin $150k Milestone Achieved as US Sovereign Crypto Pivot Looms

S&P 500 7000 Target: Wall Street’s Bullish Case for Year‑End 2026

EU Greenwashing Enforcement Hits New Peak with €1.2 Billion Fast‑Fashion Fine

India Economic Rise 2026: How the Subcontinent Toppled Japan

Sovereign Debt Crisis 2026: The ‘Lost Decade’ Is Already Here for 40 Nations

Crude Oil Price Rally June 2026: OPEC+ Extends Cuts, Targets $100

PwC China Partner Payouts Cut Amid Evergrande Audit Fraud

Broadcom Market Value Loss: Revenue Forecast Disappoints

Investors Pile Into Bullish Dollar Bets as ‘US Exceptionalism’ Trade Returns

Here’s How Much It’ll Cost You to Be Part of SpaceX’s Record-Breaking $75 Billion IPO

Nasdaq Tumbles 4% as Chip and Memory Stocks Sink: A $1.2 Trillion Wipeout

Japan’s Nikkei Scales Record Peak as AI Shares Track US Chip Rally

How to Fix Pakistan’s Debt Economy: A Structural Blueprint

Smash Capital Leads $200M Funding for Allen Control Systems

Grinding the Already Ground: Pakistan’s Inflation Crisis

Democrats Draw a Red Line Around Military AI — And the Pentagon Is Already Pushing Back

JPMorgan Cuts Anthropic AI Access in Hong Kong

New Investment Super-Cycle: AI, Green Energy & Re-Shoring

Xponential Fitness Franchise Lawsuit: The $3.97M Judgment

Middle East Conflict Oil Prices: The $4 Surge Explained
-

 Markets & Finance6 months ago
Top 15 Stocks for Investment in 2026 in PSX: Your Complete Guide to Pakistan’s Best Investment Opportunities
-

 Analysis4 months ago
Top 10 Stocks for Investment in PSX for Quick Returns in 2026
-

 Analysis5 months ago
Brazil’s Rare Earth Race: US, EU, and China Compete for Critical Minerals as Tensions Rise
-

 Analysis4 months ago
Johor’s Investment Boom: The Hidden Costs Behind Malaysia’s Most Ambitious Economic Surge
-

 Banks5 months ago
Best Investments in Pakistan 2026: Top 10 Low-Price Shares and Long-Term Picks for the PSX
-

 Investment6 months ago
Top 10 Mutual Fund Managers in Pakistan for Investment in 2026: A Comprehensive Guide for Optimal Returns
-

 Global Economy6 months ago
15 Most Lucrative Sectors for Investment in Pakistan: A 2025 Data-Driven Analysis
-

 Global Economy6 months ago
Pakistan’s Export Goldmine: 10 Game-Changing Markets Where Pakistani Businesses Are Winning Big in 2025