
Analysis
India Economic Rise 2026: How the Subcontinent Toppled Japan


Demographics, Digital Infrastructure, and a Manufacturing Explosion Propel India’s Ascent
India has officially overtaken Japan to become the world’s third‑largest economy in nominal GDP terms, the International Monetary Fund confirmed in its April 2026 World Economic Outlook database. With a GDP of $5.2 trillion, India now trails only the United States ($32 trillion) and China ($21 trillion) (IMF WEO Database, April 2026). The milestone cements the India economic rise 2026 narrative that has captivated global investors, strategists, and policymakers. The ascent is not a statistical fluke; it is the result of a confluence of structural forces: a demographic dividend, a digital‑public‑infrastructure revolution, and a manufacturing boom that is redrawing global supply chains.
The Demographic Dividend: A 25‑Year Tailwind
India’s population, at 1.48 billion, is now the world’s largest, and its median age is just 28. While China and Japan grapple with aging, shrinking workforces, India is adding 12 million young people to the labor market every year. The United Nations projects that India will account for 22% of the world’s working‑age population between 2025 and 2050. This demographic bulge, if effectively harnessed, can produce a virtuous cycle of rising savings, investment, and consumption.
The challenge is employment. The labor force participation rate has improved to 55% from a low of 40% in 2021, but is still below the 60%+ levels needed to absorb the influx. The government’s response is a combination of mass skilling (the Skill India Digital platform has trained 250 million people), entrepreneurship support (the MUDRA loan scheme has disbursed over $150 billion to micro‑enterprises), and large‑scale infrastructure projects. The National Infrastructure Pipeline, which aims to invest $2 trillion by 2030, is creating jobs in construction, logistics, and urban services.
Digital Public Infrastructure: The Game‑Changer
India’s most powerful economic weapon is its digital public infrastructure. The Unified Payments Interface (UPI) processed 18 billion transactions worth $3.5 trillion in May 2026 alone, a volume that dwarfs all other real‑time payment systems globally ([NPCI Monthly Statistics, June 2026](https://www.npci.org.in/statistics/monthly-metrics)). UPI has formalized a vast informal economy, allowing street vendors to accept digital payments, small businesses to access credit based on transaction history, and the government to deliver subsidies directly to beneficiaries’ bank accounts, plugging $45 billion in annual leakage.
The Open Network for Digital Commerce (ONDC) is democratising e‑commerce by unbundling the platform‑centric model of Amazon and Flipkart, enabling small retailers to list their products on a unified network. The Account Aggregator framework is pioneering consent‑based data sharing, reducing the cost of credit assessment and enabling a boom in small‑business lending. Aadhaar, the biometric ID, covers 1.4 billion people and is the backbone for KYC and service delivery. This stack, collectively, is adding an estimated 1.5 percentage points to annual GDP growth by cutting transaction costs and increasing economic participation (IMF Working Paper, “India’s Digital Revolution”, 2026).
The Manufacturing Boom and PLI Scheme
India’s manufacturing sector, long an underperformer, has undergone a renaissance. The Production‑Linked Incentive (PLI) scheme, launched in 2020 and expanded to 14 sectors, offers fiscal incentives to firms that achieve specified investment and sales thresholds. By June 2026, PLI‑sanctioned investments had reached $65 billion, creating 2.8 million direct jobs (DPIIT Annual Report 2025‑26). The biggest success stories are in electronics and automobiles. Apple now produces over 20% of its global iPhone output in India, up from 5% in 2022, and its supplier ecosystem—Foxconn, Wistron, Pegatron—has expanded aggressively. Samsung’s smartphone factory in Noida is its largest globally. Tesla’s Gigafactory in Sanand, Gujarat, started production in early 2026, initially targeting domestic and Southeast Asian markets.
Semiconductor fabrication, a strategic priority, has received a $15 billion government commitment. Micron’s ATMP facility in Sanand and the Tata Group’s fab in Dholera are under construction, with the first “Made in India” chips expected in 2027. The global manufacturing boom in India is being driven by the “China + 1” strategy, but also by the sheer size of the Indian consumer market, which is projected to become the world’s third‑largest by 2027.
The Nominal GDP League Table and What It Means
Surpassing Japan in nominal GDP is symbolically powerful but must be understood in context. India’s per‑capita GDP is still only $3,600, about one‑tenth of Japan’s and less than one‑third of China’s. The country remains a lower‑middle‑income nation, with 220 million people living below the national poverty line. However, the pace of income growth is accelerating: real per‑capita GDP has grown at an average of 6.5% annually over the past four years, a trajectory that, if maintained, could lift per‑capita income to $10,000 by 2035, transforming India into an upper‑middle‑income country.
For global investors, India is the “consensus long” of the decade. Equity markets, represented by the Nifty 50, have delivered a 15% compound annual growth rate in dollars over the last five years, driven by earnings growth, not multiple expansion. Foreign portfolio inflows have been robust, but foreign direct investment is the real engine, reaching $85 billion in FY2025‑26. Sectors attracting the most FDI include renewable energy, digital services, data centers, and healthcare. The bond market’s inclusion in the J.P. Morgan and Bloomberg emerging‑market indices has reduced borrowing costs and expanded the investor base.
Risks remain: political polarization, the complex federal structure that can delay land acquisition and labor reforms, and the external vulnerability of oil imports (India imports 85% of its crude). Yet the structural narrative is overwhelmingly positive. India’s rise is not just about catching up; it is about creating a distinct, digitally‑native growth model that combines scale, frugality, and innovation. As Japan’s Nikkei noted in an editorial, “India’s ascent is a reminder that economic dynamism has shifted from the old industrial powers to the demographic giants of the South” (Nikkei Asia, June 2026).
Discover more from The Economy
Subscribe to get the latest posts sent to your email.



The human and commercial toll of the conflict choking the Strait of Hormuz came into sharp focus this month as the UAE’s state oil company confirmed a mounting tally of attacks on its shipping fleet — and Emirati officials took their case for reopening the waterway to the international stage in Jaipur.
Fifteen Vessels, One Fatality, Twenty Injuries
The Abu Dhabi National Oil Company said it “continues to be significantly impacted by unprovoked attacks on its assets and employees,” disclosing that 15 of its vessels have been attacked by missiles and drones while transiting the Strait of Hormuz since the conflict began, including three vessels in a single week. The company said the attacks have resulted in one fatality and 20 injuries among crew members.
The pattern has escalated sharply in recent days. On the evening of August 13, two ADNOC vessels were attacked while transiting the strait, with no injuries reported, according to the UAE’s state news agency WAM. That followed an incident days earlier in which the UAE accused Iran’s Revolutionary Guard Corps of striking an ADNOC tanker with a missile, an act Abu Dhabi’s foreign ministry labelled “piracy” and a “direct threat to the stability of the region, its peoples, and the global energy supply”.
Diplomatic adviser to the UAE president Anwar Gargash said Abu Dhabi would defend its sovereignty and interests while continuing to prioritise diplomatic options, a balancing act between deterrence and de-escalation that has defined the UAE’s posture throughout the conflict.
Taking the Case to BRICS
The UAE elevated its concerns onto a multilateral stage at the 2026 BRICS Trade Ministers Meeting in Jaipur, India. Minister of Foreign Trade Dr Thani Al Zeyoudi underscored the UAE’s grave concerns over Iran’s attacks on commercial shipping and reiterated the call for the strait’s immediate and unconditional reopening, invoking the protection of freedom of navigation under international law. Notably, trade ministers at the summit were unable to reach consensus on a joint declaration — a sign of how divisive the Iran conflict has become even within a bloc that includes Russia and China, both of which maintain complex relationships with Tehran.
Regional solidarity has been swift and vocal. The Gulf Cooperation Council’s Secretary-General Jassim Mohammed al-Budaiwi condemned one of the recent strikes as a “dangerous and unacceptable escalation”, while Qatar separately rejected the use of the strait as a “bargaining chip.”
Why the Strait Still Matters
About a fifth of the world’s oil and liquefied natural gas passed through the Strait of Hormuz before the conflict began, a chokepoint for a large share of the world’s seaborne oil. Since the outbreak of the US-Israeli war with Iran on February 28, shipping through the corridor has been repeatedly disrupted, and freight and insurance costs for tankers transiting the route have climbed accordingly.
The UK Maritime Trade Operations agency has also logged separate incidents, including a bulk carrier struck by an unknown projectile in the strait — a reminder that ADNOC’s fleet, while the most visible target given the UAE’s high public profile in the dispute, is not the only shipping affected.
The Economic Stakes for Abu Dhabi and Dubai
The disruption arrives at an inconvenient moment for the UAE, whose non-oil economy has otherwise been a standout performer this year. Dubai’s preliminary Economic Survey 2026 showed GDP rising to roughly $264.7 billion in 2025, with employment reaching 4.69 million, while forecasters including Emirates NBD have projected Dubai’s economy will expand 4.5% in 2026, powered by tourism, population growth, and private-sector investment.
But the oil side of the ledger tells a more troubled story. Economists at FocusEconomics have noted that UAE crude output fell by about a third annually during the worst months of the Hormuz disruption, before partially rebounding on a temporary US-Iran truce. Continued attacks on the strait threaten to reopen that wound just as the non-oil economy has been carrying growth largely on its own.
What Comes Next
With a seventh round of separate US-mediated diplomacy already underway on the Israel-Hezbollah front and no resolution yet in sight on Hormuz specifically, the UAE finds itself managing a war economy on two fronts: absorbing direct attacks on its national oil champion while its diplomats work multilateral channels — from BRICS to the GCC — to build pressure for a reopening that has so far proven elusive.
Key Takeaways
- ADNOC reports 15 vessels attacked since the conflict began, with one crew fatality and 20 injuries.
- The UAE raised the issue at the 2026 BRICS Trade Ministers Meeting in Jaipur, calling for the strait’s immediate, unconditional reopening.
- Trade ministers failed to reach consensus on a joint BRICS declaration, reflecting divisions over the Iran conflict.
- About a fifth of global seaborne oil and LNG normally transits the strait, and continued attacks threaten to reverse UAE oil-output gains made during a temporary truce.
Frequently Asked Questions
How many ADNOC vessels have been attacked in the Strait of Hormuz? ADNOC has reported 15 vessels attacked by missiles and drones since the start of the conflict, resulting in one fatality and 20 injuries among crew members.
What did the UAE ask for at the BRICS summit? UAE Minister of Foreign Trade Dr Thani Al Zeyoudi called for the immediate and unconditional reopening of the Strait of Hormuz and reaffirmed the need to protect freedom of navigation under international law.
How important is the Strait of Hormuz to global oil supply? Before the conflict, roughly a fifth of the world’s seaborne oil and liquefied natural gas passed through the strait, making it one of the most critical chokepoints in global energy trade.
Discover more from The Economy
Subscribe to get the latest posts sent to your email.
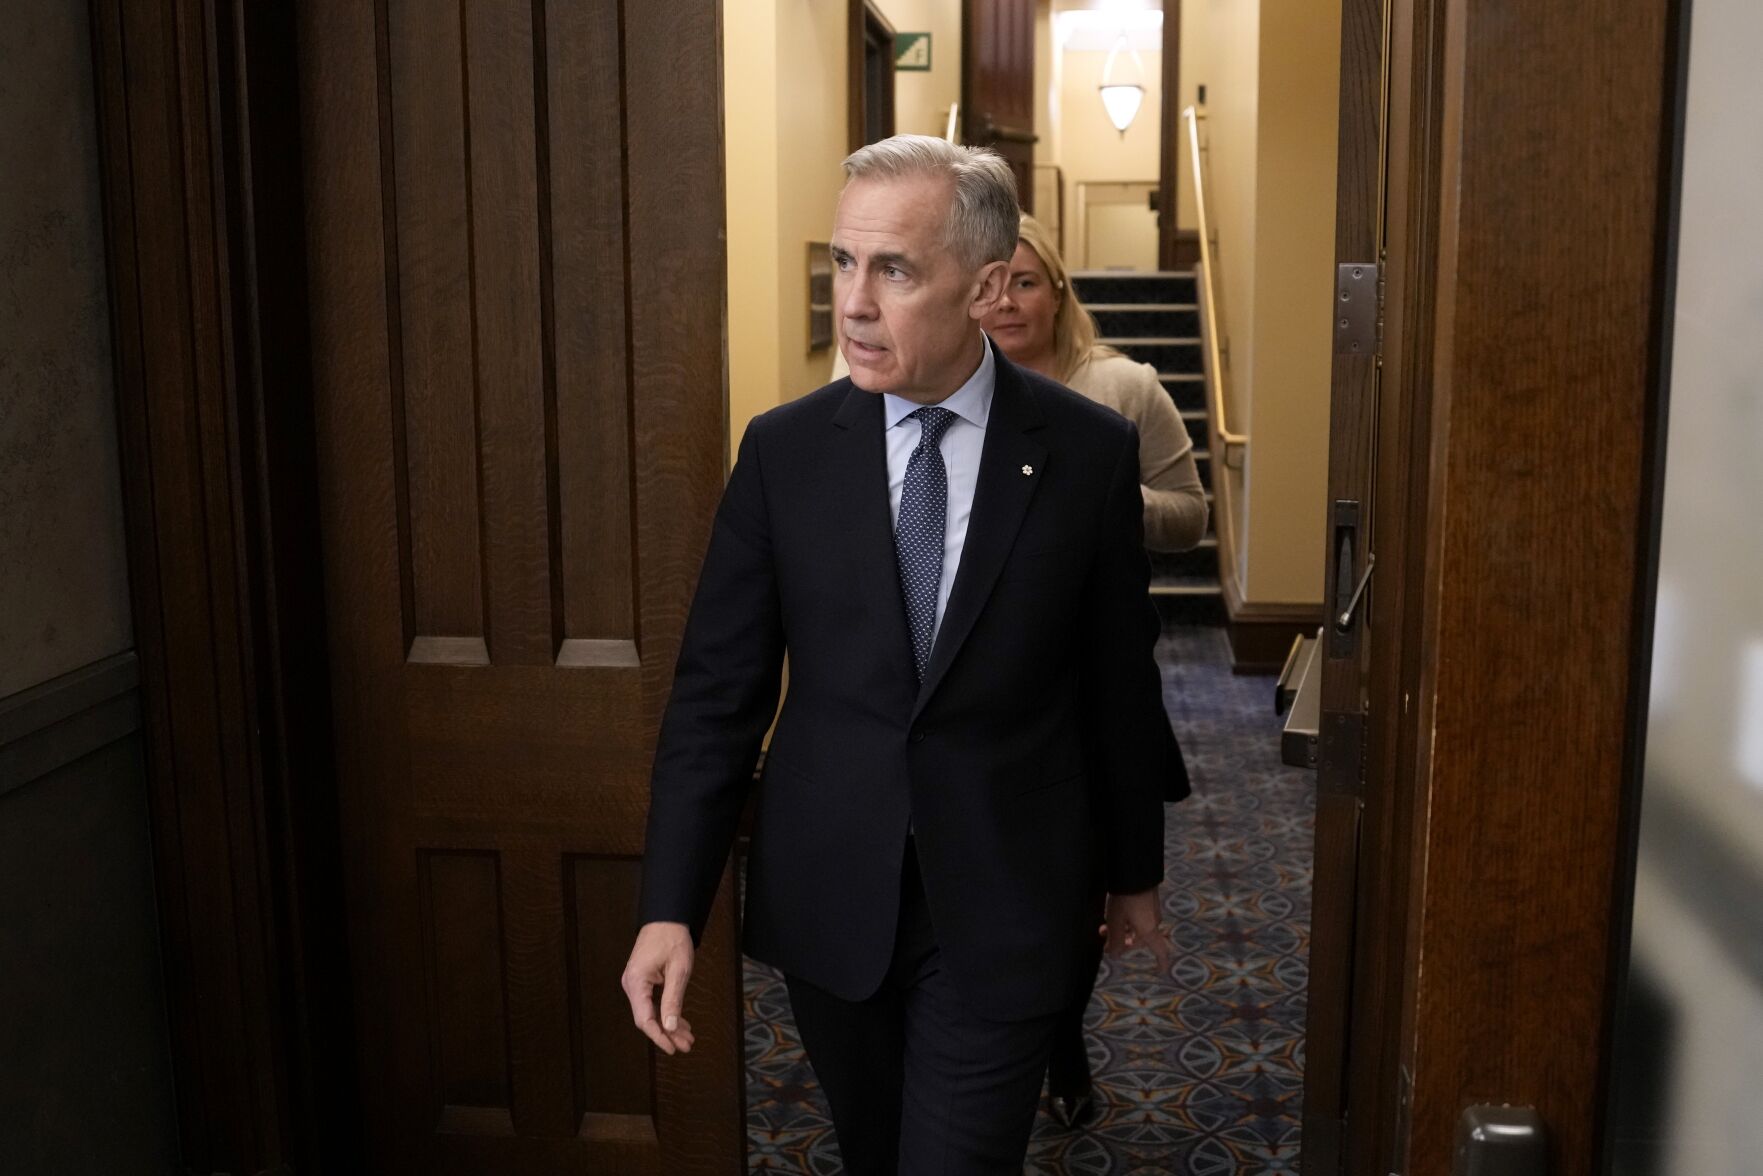
Canada is racing against a hard deadline. On August 19, 2026, a fresh round of 50% US tariffs on nearly $20 billion of Canadian goods is scheduled to take effect — and unlike almost every other tariff Washington has imposed this year, this one carries no exemption for goods that comply with the Canada-US-Mexico Agreement, the trade pact that has underpinned North American commerce for years.
What’s About to Change
The new tariffs apply across three separate lists of Canadian imports: dairy products including milk, cream and whey; a broad “Motor Vehicles” category that despite its name covers electronics, furniture, building materials, plastics, clothing, footwear, machinery, cosmetics and agricultural goods; and other targeted sectors. In total, the list touches well over a dozen distinct Canadian industries, from honey and plywood to hyacinth bulbs — products that collectively make up about five percent of Canada’s exports to the United States.
Canada’s Trade Minister Dominic LeBlanc and chief negotiator Janice Charette have been working through the weekend in Washington, meeting repeatedly with US Trade Representative Jamieson Greer as officials on both sides try to close a gap that reportedly remained substantial as of late last week. Canadian negotiators have so far rejected Washington’s latest offer, judging the proposed tariff reductions insufficient to meet Ottawa’s demands.
The Stakes for CUSMA Itself
This deadline is not just another tariff skirmish — it cuts to the credibility of CUSMA as an institution. At the pact’s mandated 2026 joint review, the United States declined to extend the agreement in its current form, though USTR has stated the pact remains formally in force while the three governments continue negotiating. Under CUSMA’s review structure, the absence of a three-country extension pushes the parties into a cycle of annual reviews, with the agreement technically able to continue until 2036 unless terminated earlier.
The economic stakes of a genuine breakdown are significant. A recent analysis modelled three scenarios — status quo, CUSMA breakdown, and successful renegotiation — and found that a full breakdown would cost roughly 214,000 American jobs and 102,000 Canadian jobs relative to the status quo. Conversely, a successful renegotiation could add 137,000 US jobs and 98,000 Canadian jobs. That asymmetry — bigger job losses in the US under a breakdown scenario than gains for Canada under renegotiation — illustrates just how intertwined the two economies remain more than three decades after the original NAFTA was signed.
Businesses Are Betting on a Deal
Despite the looming deadline, Canadian firms have largely avoided the kind of front-loaded shipping rush that typically precedes a tariff implementation date. Industry groups report that companies are opting to wait and see rather than rushing shipments across the border to beat the deadline, a sign that many exporters are betting Washington will ultimately soften its position, as it has at several points earlier in the year.
That confidence is not universal. Analysts at the Atlantic Council have characterised the broader pattern differently, describing Washington’s approach as rebuilding tariffs “brick by strong brick” through more durable, court-tested legal authorities after the US Supreme Court struck down the earlier “Liberation Day” tariff regime in February. One industry source went further, suggesting the country is “at the end of the beginning” of the Trump tariff agenda, with large portions of the policy expected to be fully entrenched by the end of summer.
Carney’s Position
Prime Minister Mark Carney has kept Canada’s response deliberately ambiguous, declining to rule out retaliation after a four-hour meeting with provincial premiers in Charlottetown in late July, stating that “everything is on the table” while adding that responding pre-emptively would be counterproductive. Provincial leaders themselves remain split on how forcefully to push back, reflecting the uneven exposure different provinces face to the specific goods targeted by the new tariff lists.
Separately, a business-confidence survey found that 73% of member firms expect a failure to renew CUSMA to weaken their overall confidence and outlook, regardless of whether the August 19 tariffs specifically hit their sector — a sign that the uncertainty itself, not just the tariffs, is already dampening investment decisions.
Key Takeaways
- A new 50% US tariff on nearly $20 billion of Canadian goods takes effect August 19, 2026, with no CUSMA exemption.
- Canadian and US negotiators worked through the weekend in Washington but had not closed the gap as of Friday.
- A modelled CUSMA breakdown scenario would cost roughly 214,000 US and 102,000 Canadian jobs versus the status quo.
- Canadian businesses have largely avoided pre-deadline shipping surges, betting Washington will soften its stance.
- PM Mark Carney has kept retaliation “on the table” without committing to a specific response.
Frequently Asked Questions
What happens on August 19, 2026 for Canada-US trade? A new 50% US tariff takes effect on nearly $20 billion of Canadian goods across dairy, electronics, furniture, building materials and other sectors, with no exemption for CUSMA-compliant products.
Is CUSMA ending? No. CUSMA remains formally in force. The US declined to extend it in its current form at the 2026 review, which triggers a cycle of annual reviews rather than an automatic termination.
How many jobs are at risk if CUSMA breaks down? One modelled scenario projects roughly 214,000 US job losses and 102,000 Canadian job losses if CUSMA were to fully break down, compared with the status quo.
Discover more from The Economy
Subscribe to get the latest posts sent to your email.
China’s economy opened the second half of 2026 on weaker footing than markets had hoped, with July data released Monday showing industrial output, retail sales, and fixed-asset investment all undershooting forecasts simultaneously — a broad-based miss that intensifies pressure on Beijing to deliver further policy support.
The Numbers Behind the Slowdown
Industrial production rose 4.5% year-on-year in July, missing the 4.8% consensus estimate and slowing from June’s 5.3% pace — the first deceleration in three months. Retail sales fared even worse: consumption grew just 0.6% year-on-year, well below the 1.5% forecast in a Bloomberg survey and down from 1% growth in June. In yuan terms, total retail sales of consumer goods reached 3,902.2 billion yuan (roughly $578.7 billion), up just 0.06% on a month-on-month basis — effectively flat.
Investment told a similarly downbeat story. China’s urban fixed-asset investment, spanning real estate and infrastructure, contracted 6.7% in the year to end-July, worse than the roughly 6% decline economists had expected. The labour market showed strain too, with the urban unemployment rate ticking up to 5.2% in July from 5% in June. Manufacturing sentiment reinforced the picture: July’s Purchasing Managers’ Index fell to 49.2%, back below the 50-point expansion threshold.
Why It’s Happening
China’s National Bureau of Statistics pointed to a combination of external and domestic pressures behind the soft patch. Spokesman Fu Linghui told reporters that international geopolitical conflicts persisted through July and the global energy market was marked by significant instability, a reference to the same Iran-linked oil volatility that has been rattling markets from London to Washington. Authorities also cited extreme weather conditions in parts of the country during the month as a contributing drag on activity.
Beijing is targeting national growth of 4.5%–5.0% for 2026 — already the lowest official goal in decades — and the economy fell short of that pace in the second quarter even before July’s figures. The property downturn remains the most stubborn drag: new home prices extended their decline in July, continuing a slump that has weighed on household wealth and, by extension, consumer confidence for well over two years.
The AI Export Lifeline
Not every part of the economy is struggling. Investment in high-tech industries grew a solid 5.0% year-on-year, with information services up 19.2%, aerospace vehicle and equipment manufacturing up 12.3%, and electronic and communication equipment manufacturing up 7.1%. More broadly, industrial production and exports tied to the global AI investment boom have helped cushion weak consumption and private investment, though July’s data suggest that offsetting support “may be thinning” as the headline numbers show broader weakness breaking through.
Trade data released earlier this month told a more encouraging story on the export side, with exports and imports both climbing on the back of overseas demand for AI-related technology products — a dynamic that has also shown up as a tailwind in Malaysia’s and Singapore’s most recent growth prints, both of which have leaned heavily on AI-hardware and data-centre exports this year.
What Comes Next: The Stimulus Question
The scale and timing of the data release itself became a story in its own right. China’s statistics bureau shifted Monday’s briefing to 3 p.m. local time — a break from its usual 10 a.m. slot and a move that coincided with the close of China’s stock market, fuelling speculation among analysts about whether officials were managing market reaction as much as reporting data.
With growth undershooting Beijing’s already-modest target, investors are now watching for a policy response. The People’s Bank of China and fiscal authorities have levers available — from further rate cuts to expanded consumer trade-in subsidies and infrastructure spending — but have so far proceeded cautiously given concerns about debt sustainability and the limited effectiveness of prior stimulus rounds in reviving the property sector specifically.
Key Takeaways
- Industrial output (4.5%), retail sales (0.6%) and fixed-asset investment (-6.7%) all missed forecasts in July, marking a broad-based slowdown.
- Urban unemployment rose to 5.2% and the manufacturing PMI slipped back below the 50 expansion threshold.
- Officials cited Middle East-linked energy market instability and extreme domestic weather as contributing factors.
- AI-related high-tech investment and exports remain a bright spot, growing 5% and helping offset weaker consumption.
- Markets are now watching for fresh stimulus signals after China fell short of its already-reduced 2026 growth target in the first half.
Frequently Asked Questions
Why did China’s July economic data disappoint? Industrial output, retail sales and fixed-asset investment all grew more slowly than forecast, with officials citing global energy market instability and extreme weather, on top of a prolonged property-sector downturn.
What is China’s 2026 GDP growth target? Beijing is targeting growth of 4.5%–5.0% for 2026, its lowest official target in decades, and the economy fell short of that range in the second quarter.
Is any part of China’s economy still growing strongly? Yes — high-tech investment and exports linked to global AI infrastructure demand grew solidly in July, helping offset weakness in consumption and property investment.
Discover more from The Economy
Subscribe to get the latest posts sent to your email.

UAE Demands Hormuz Reopening After 15 ADNOC Vessels Attacked Since War Began

Canada Faces an August 19 Tariff Cliff as CUSMA’s Future Hangs in the Balance

Pakistan Posts Fastest Growth in Four Years as KSE-100 Closes at a Record High

China’s Economy Slows Across the Board in July, Raising Pressure for Fresh Stimulus

UK Gilt Yields Ease as Q2 GDP Beats Forecasts — But Inflation Report Looms

AI Rally vs Oil War Premium: Markets Split as Anthropic Surges, Brent Nears $90

Rebel Creamery & Polymarket: A Corporate Risk Management Playbook

Susan Collins vs. Troy Jackson: Inside Maine’s Toss-Up 2026 Senate Race

Retail Earnings Week: What Home Depot, Target & Walmart Reveal

FTC Scrutiny of Prediction Markets: What Traders Need to Know

Nvidia’s $500 Billion AI Financing Plan Has a China-Shaped Hole In It

The Rocket That Won’t Quit: Inside SpaceX’s Falcon 9 Launch Machine

Safeway and Tyson Foods: Pricing in Today’s Economy

Inside the New Jif Peanut Butter Branding Overhaul

China Politburo July 2026: Stimulus Signals Explained

Down But Not Out: Inside the Slow Sinking of Russia’s War Economy

Gulf Capital Retreat From Pakistan 2026: UAE Loan Freeze & What It Means

Russia Fuel Shortages 2026: Inside a Cracking War Economy

Top 15 Financial Stocks for Investment in PSX

Pakistan Passed Its Third IMF Review

Andy Burnham, UK Gilts and Mortgages: July 2026 Explainer

Anthropic’s Trillion-Dollar Race: Inside the Path to an October 2026 IPO

SpaceX Stock Lockup Expiration Explained: Why $123B in Shares Could Hit the Market

Pakistan IMF Program 2026: Inside the Push Toward an Interest-Free Economy

Facebook and Instagram Experience Global Outage

Pakistan’s 2026 Monsoon Floods Threaten Fragile Economic Recovery as Inflation Nears 9%

Canada US Trade War 2026: Inside Carney’s Push to Cut Ties With Trump’s Tariffs

Russia Oil Revenue 2026: How Sanctions on Rosneft and Lukoil Are Draining the War Chest
-

 Markets & Finance7 months ago
Top 15 Stocks for Investment in 2026 in PSX: Your Complete Guide to Pakistan’s Best Investment Opportunities
-

 Analysis6 months ago
Johor’s Investment Boom: The Hidden Costs Behind Malaysia’s Most Ambitious Economic Surge
-

 Analysis6 months ago
Top 10 Stocks for Investment in PSX for Quick Returns in 2026
-

 Analysis6 months ago
Brazil’s Rare Earth Race: US, EU, and China Compete for Critical Minerals as Tensions Rise
-

 Banks7 months ago
Best Investments in Pakistan 2026: Top 10 Low-Price Shares and Long-Term Picks for the PSX
-

 Investment7 months ago
Top 10 Mutual Fund Managers in Pakistan for Investment in 2026: A Comprehensive Guide for Optimal Returns
-

 Global Economy8 months ago
15 Most Lucrative Sectors for Investment in Pakistan: A 2025 Data-Driven Analysis
-

 Global Economy8 months ago
Pakistan’s Export Goldmine: 10 Game-Changing Markets Where Pakistani Businesses Are Winning Big in 2025