
Trade Policy
Canada US Trade War 2026: Inside Carney’s Push to Cut Ties With Trump’s Tariffs

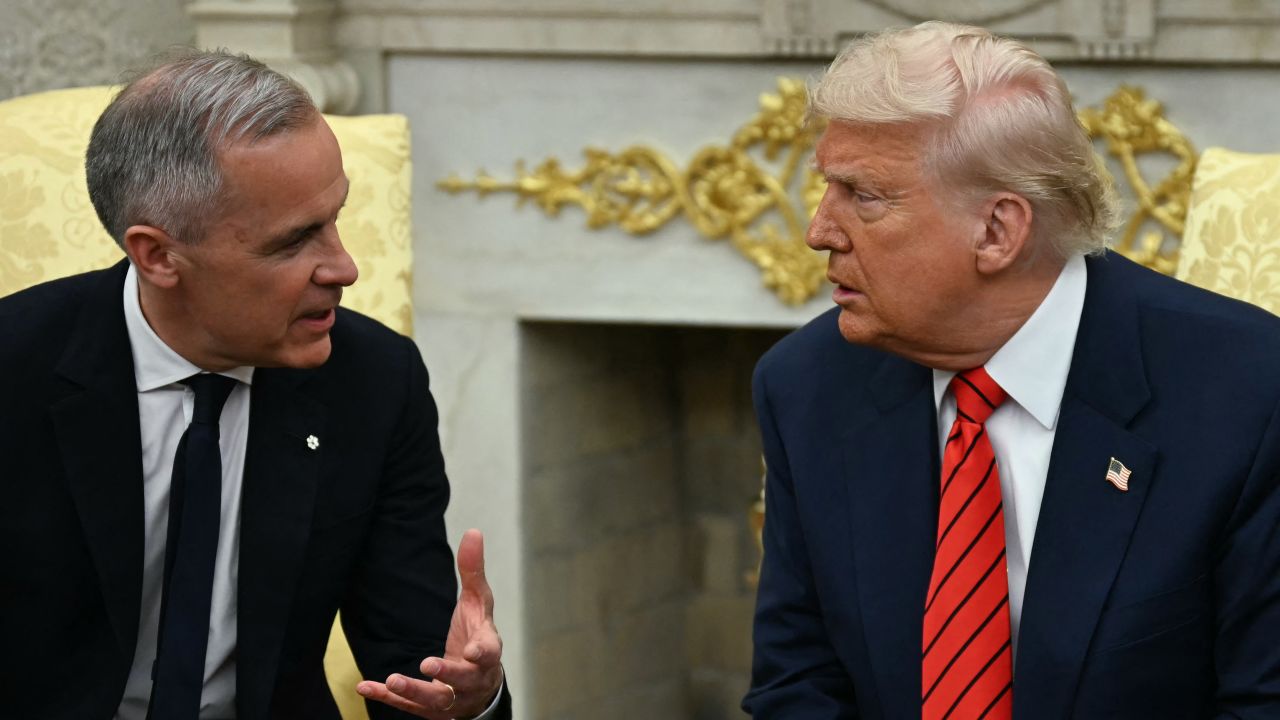
Canadian Prime Minister Mark Carney said he and US President Donald Trump have agreed to “intensify” trade negotiations, but the détente followed one of the more jarring tariff threats of the year: a plan for 50% tariffs on a wide range of Canadian imports, framed by Washington as retaliation over the treatment of US-made cars, alcohol, and dairy, according to Al Jazeera’s coverage.
The dependency Carney can’t diversify away quickly
The core problem is arithmetic, not politics. Canada still sends close to 70% of its exports south of the border, compared with roughly 20% of EU exports going to the US, according to Reuters reporting via AOL. To cut merchandise exports to the US by just 10%, Export Development Canada estimates Canada would need to roughly double its exports to China, Germany, France, Mexico, Italy, and India combined — or find markets of similar scale elsewhere.
Carney has nonetheless pushed further than most G7 peers on diversification, becoming the first Canadian prime minister to visit China since 2017 and signing a trade deal with Beijing in January, even as Ottawa shelved earlier ambitions for a comprehensive free trade agreement with China, according to reporting from Automotive News and a separate account of the shelved FTA.
The data is starting to show it — barely
Statistics Canada data shows early, if modest, evidence of the pivot working: exports to the US fell again in May even as businesses sought alternative partners, with the Canadian Chamber of Commerce noting “encouraging gains in other markets,” according to Global News. Carney has also moved to de-escalate on the margins, removing retaliatory tariffs on US goods compliant with CUSMA rules of origin even as broader trade tensions persist.
A domestic political fight over the same question
The diversification strategy is also a live domestic debate. Conservative leader Pierre Poilievre has argued for staying more closely tethered to the US relationship rather than pursuing what critics characterize as an unproven pivot, per the Automotive News analysis. Meanwhile, sector-specific damage from the trade war continues to surface — Algoma Steel laid off roughly 1,000 workers amid the tariff dispute, and food bank usage in Ontario has risen sharply, underscoring the near-term costs of the standoff regardless of its long-term strategic logic.
Why this connects to the broader trade map
Carney’s pivot toward China arrives as the EU pursues its own diversification — striking a Mercosur deal after 25 years of talks, concluding an agreement with Indonesia, and reopening talks with Malaysia, the Philippines, the UAE, and India, according to the same Reuters analysis. Canada’s experiment is effectively a stress test other US-dependent economies are watching closely, including several in the Gulf and Southeast Asia weighing their own exposure to Washington’s tariff unpredictability.
Discover more from The Economy
Subscribe to get the latest posts sent to your email.


Global Economy
Fed Rate Hike Projections vs. Trump’s Interest Rate Policy: What Global Markets Expect Next
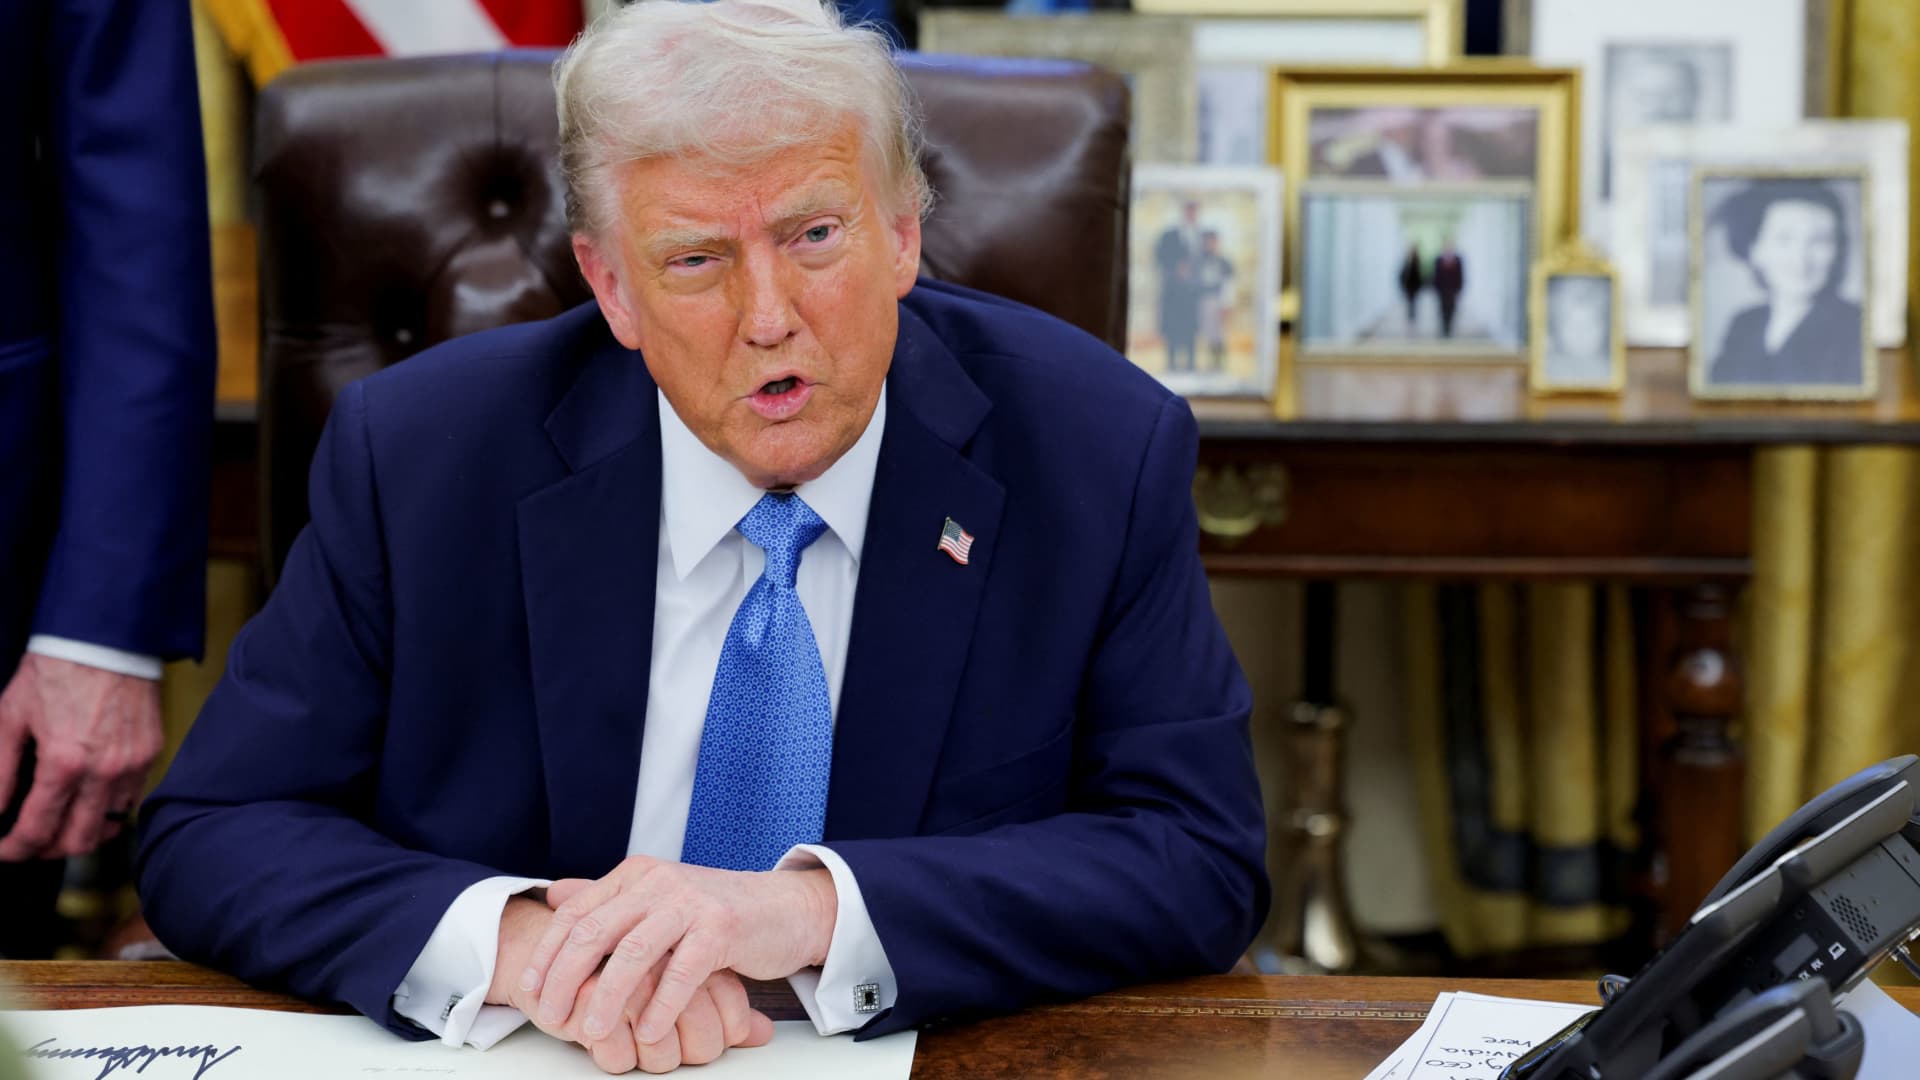
The Fed hiked to 3.75%-4% on Sept 16 as Trump demanded 1% rates. See the dot plot, the market reaction and what it means for borrowers next.
Executive Summary / Key Takeaways
- On 16 September 2026 the Federal Open Market Committee voted 12-0 to raise the federal funds target range by a quarter point to 3.75%–4.00% — the first US rate increase since July 2023.
- The statement was blunt: inflation remains elevated, and the action is meant to support a timelier return to the 2% goal.
- The dot plot showed 16 of 18 participants expecting at least one more quarter-point hike before year-end, with four seeing room for two. Chair Kevin Warsh declined to submit a projection at all.
- President Trump responded within hours, demanding that US rates fall to 1% “or less” — while saying he still has confidence in the chair he appointed.
- Markets sold the decision then partly reversed: the Dow fell more than 600 points, the 10-year Treasury yield topped 5%, and the two-year reached its highest level since 2024.
1. Introduction & Immediate Context
For three and a half years the direction of travel in US monetary policy was one-way — cuts, pauses and arguments about the pace of easing. That ended on Wednesday afternoon.
The Federal Reserve approved its statement by a 12–0 vote, lifting the target range for the federal funds rate by a quarter percentage point to 3¾–4 percent while continuing its policy of maintaining ample reserves in the banking system. The Committee described economic activity as expanding at a solid pace, noted that uncertainty remains elevated partly because of geopolitical developments, and observed that domestic spending has been resilient, productivity growth strong and capital investment robust.
Alongside that assessment sat a one-line justification for tightening: inflation remains elevated, and the policy action will support a timelier return to the 2 percent objective. That combination — firm growth, firm inflation — is what separates this decision from the reflexive easing bias markets carried through the first half of the year. As CNBC reported, futures markets had priced better than a 90% chance of the move, but the accompanying projections were more hawkish than most desks expected.
2. Core Market and Policy Analysis
2.1 What the dot plot actually says
The Summary of Economic Projections is the part institutional desks will trade for the next six weeks. Sixteen of eighteen policymakers anticipate at least one more quarter-point increase by the end of this year, and only two expect rates to stay where they are, according to Reuters. Four of those officials see two further hikes as possible.
Warsh’s refusal to publish his own dot is a deliberate break with a decade of Fed communication practice; he has said repeatedly that he opposes issuing forward guidance. For rate-sensitive borrowers that matters. The committee’s central tendency is now the only signal available, and it points higher.
| Metric / Indicator | Current Status | Projected Impact | Primary Source |
|---|---|---|---|
| Federal funds target range | 3.75%–4.00% (raised 25 bps, 12-0) | At least one further hike signalled for 2026 | Federal Reserve |
| FOMC dot plot | 16 of 18 see ≥1 more hike; 4 see two | Terminal-rate debate shifts toward 4.25%–4.50% | Reuters |
| PCE inflation projection | 3.7% in 2026, falling to 2.3% in 2027 | Above target across the forecast horizon | Fox Business |
| 10-year Treasury yield | Above 5% | Higher mortgage and corporate borrowing costs | Yahoo Finance |
| Prior policy path | Three cuts in 2025 to 3.50%–3.75%, then five holds | First reversal of the easing cycle since 2023 | Trading Economics |
2.2 The inflation case for tightening
Fed projections put PCE inflation at 3.7% in 2026, falling to 2.3% in 2027, with domestic spending remaining resilient, Fox Business reported. That is a second consecutive year of above-target inflation on the central bank’s own numbers, driven substantially by energy costs.
Warsh framed the decision in unusually plain terms at his press conference, saying that inflation is too high and has been for too long, and describing the vote as a sober, serious, responsible decision. Speaking to Bloomberg, he characterised the move as removing a dose of accommodation so that financial and credit conditions would sit more consistently with the Fed’s ultimate objectives — and said the action begins to show the central bank is serious about delivering price stability. He also noted that the economy has gathered speed since the July hold, with little sign of inflation cooling.
3. Structural Drivers and Competitor Gaps: The Independence Test
This is where most coverage stops short. The interesting variable is not 25 basis points; it is the institutional test now underway.
In the week before the meeting, the president, vice president, Treasury secretary and a senior White House economic counselor all publicly urged the Fed not to raise rates and in some cases to cut — an unusually broad pressure campaign even by the standards of Trump’s long-running criticism of the central bank, CNBC reported. Vice President JD Vance said the administration believes the Fed should be lowering rates and would appreciate help from the central bank. Treasury Secretary Scott Bessent argued that the Fed typically does not raise rates during a supply shock until second- or third-order inflationary effects appear.
The decision went the other way. Warsh voted with a unanimous committee despite that pressure, in a move read by analysts as an unambiguous signal that the White House should keep its hands off the Federal Reserve. Trump had selected Warsh in January after souring on former chair Jerome Powell — which is precisely what makes the vote consequential. This was not an inherited adversary defying the administration; it was the administration’s own appointee.
The presidential response came within hours. Trump wrote on Truth Social that US interest rates should be 1% or less because America is the best credit in the world, ending with a demand that rates be lowered fast, Reuters reported. He also appeared to link persistent US trade deficits to the central bank’s borrowing costs, though the two are largely unrelated. Asked later whether he believed Warsh had decided based on White House input, the president said he did not think so, and confirmed he still has confidence in the chair.
For sovereign allocators the pricing question is whether September establishes a durable precedent of operational independence, or whether the pressure campaign intensifies into 2027 as the midterm cycle bites. Long-end term premium is the cleanest instrument for expressing a view either way.
4. Key Implications for Stakeholders
Mortgage borrowers. The transmission channel is the long end, not the policy rate. The 10-year Treasury topped 5% around the decision while oil traded solidly above $100 per barrel, according to Yahoo Finance. Thirty-year fixed mortgage pricing tracks the long bond far more closely than the funds rate, so the term-premium repricing matters more than the hike itself.
Equity investors. Stocks reversed during Warsh’s press conference as markets read his remarks as hawkish, with the Dow dropping more than 600 points — over 1.2% — while the S&P 500 fell 0.4% and the Nasdaq finished near flat. Yardeni Research cut its year-end S&P 500 target to 7,900 from 8,400, citing higher Treasury yields driven by rising energy prices and an increased risk of a downturn over the next three to six months, CNBC noted.
Global markets. By Thursday, sentiment had steadied. Bloomberg reported Treasuries paring losses and US equity futures climbing as Warsh’s resolve reassured investors, with the two-year note easing a basis point to 4.72% after touching its highest level since 2024, and the 10-year and 30-year both slipping around two basis points.
Institutional positioning. The base case is now higher-for-longer with a live December hike. Markets are pricing one more 25-basis-point increase in 2026 followed by further tightening extending into 2027, per Seeking Alpha analysis of CME FedWatch pricing.
5. Frequently Asked Questions
Q1: What is the current Fed interest rate after the September 2026 meeting?
The federal funds target range is 3.75%–4.00%, raised by 25 basis points on 16 September 2026 in a unanimous 12-0 FOMC vote. It was the first US rate increase since July 2023 and partially reversed the 2025 easing cycle.
Q2: Will the Fed raise rates again in 2026?
The dot plot indicates 16 of 18 FOMC participants expect at least one further quarter-point increase before year-end, and four see two as possible. Markets currently price one additional hike in December, with more tightening possible into 2027.
Q3: How did Trump react to the Fed rate hike?
He demanded on Truth Social that US rates be cut to 1% or less, while telling reporters afterwards that he retains confidence in Chair Kevin Warsh and does not believe Warsh acted on White House instruction.
Q4: Why is the Fed hiking when inflation was supposed to be falling?
Fed projections put PCE inflation at 3.7% in 2026, well above the 2% target, driven substantially by energy prices. The Committee judged growth, productivity and capital investment strong enough to absorb tighter policy.
Discover more from The Economy
Subscribe to get the latest posts sent to your email.
Global Economy
Beyond Rhetoric: How the EU Is Deploying ‘All Tools’ to Rebalance Its €1 Billion-a-Day Trade Deficit with China
Key Takeaways
- The Tipping Point: European Commission President Ursula von der Leyen has declared that Europe’s trade deficit with China has reached an “unsustainable” €1 billion per day, pushing bilateral trade relations to a historical tipping point.
- Enforcement Over Engagement: Signaling a fundamental shift in doctrine, von der Leyen issued a direct ultimatum: “Words are good. But deeds are better.”
- The Defensive Arsenal: Brussels is escalating beyond traditional anti-dumping tariffs, actively deploying the Foreign Subsidies Regulation (FSR), the International Procurement Instrument (IPI), and establishing a centralized European Critical Raw Materials Corporation under the RESourceEU framework.
- Supply Chain Exposure: European and Asian enterprises face heightened compliance scrutiny, potential market access restrictions, and supply chain realignment risks across green-tech, automotive, and critical mineral sectors.
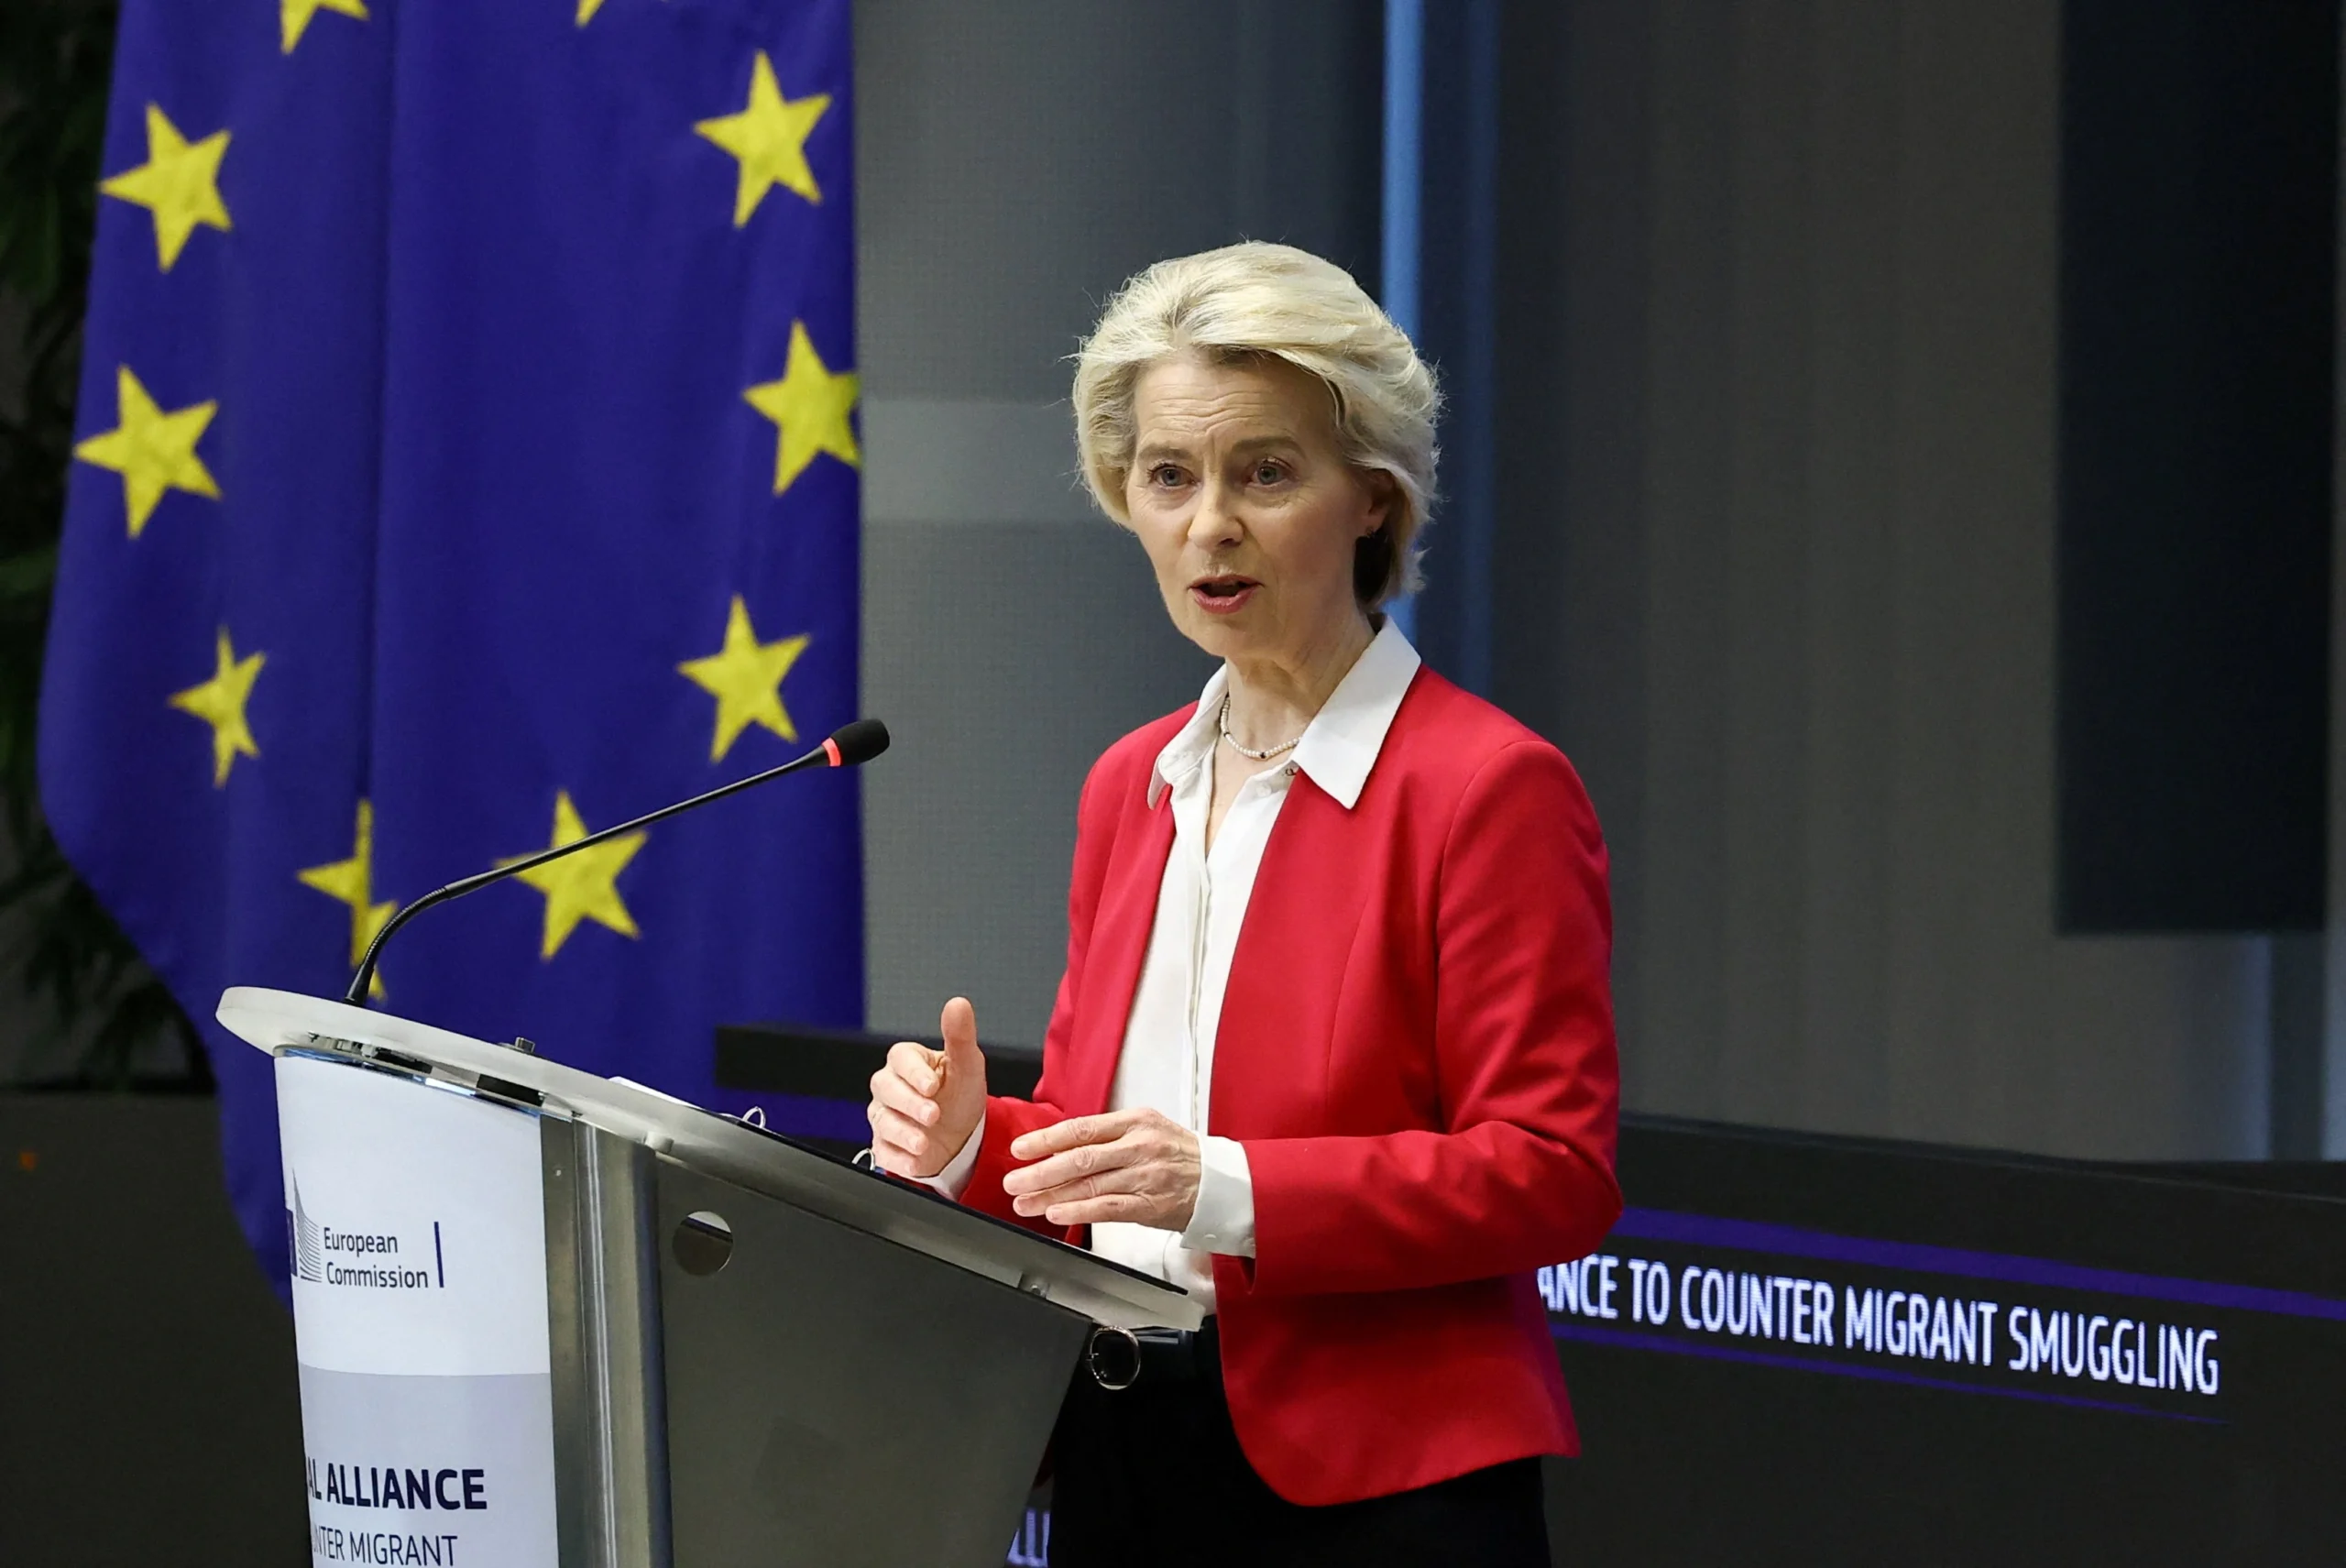
Commission President von der Leyen outlining EU trade policy in Brussels. Source: Yves Herman / REUTERS
The €1 Billion-a-Day Dilemma: Inside Brussels’ Trade Ultimatum
In her 2026 State of the Union address, European Commission President Ursula von der Leyen delivered her sternest warning to date regarding economic relations with Beijing. Citing structural industrial overcapacity in China and subsidized export dumping into the Single Market, von der Leyen emphasized that Europe’s trade deficit with China—now running at approximately €1 billion every single day—has crossed a critical threshold.
While reaffirming that diplomatic dialogue remains open, von der Leyen signaled that Brussels’ patience with protracted negotiations has expired:
“Words are good. But deeds are better. If market imbalances persist and level-playing-field conditions are not restored, the European Union will use all tools at its disposal to rebalance trade.” — Ursula von der Leyen, President of the European Commission
According to official data released alongside the address by the European Union External Action Service, the EU’s merchandise trade deficit with China has expanded sharply over the past decade. The expansion is driven by state-directed investments in clean technology, advanced industrial machinery, and automotive manufacturing, combined with persistent market barriers facing European exporters in mainland China.
Deconstruction of the EU’s Trade-Defence Arsenal
To move beyond political warnings, the European Commission is mobilizing a multi-layered regulatory architecture designed to shield European industries from non-market practices.
| Trade Defence Instrument | Legal Basis & Focus | Operational Impact on Chinese Exports |
|---|---|---|
| Foreign Subsidies Regulation (FSR) | EU Regulation 2022/2560 | Allows Brussels to inspect and block foreign state-subsidized companies from bidding on EU public tenders or acquiring European firms. |
| International Procurement Instrument (IPI) | EU Regulation 2022/1031 | Restricts access to EU public procurement markets for companies from countries that discriminate against EU businesses. |
| Anti-Subsidy & Anti-Dumping Duties | EU Regulation 2016/1037 | Enables retroactive tariffs on subsidized goods (e.g., Electric Vehicles, solar modules, wind turbines). |
| Critical Raw Materials Corporation (RESourceEU) | 2026 Industrial Strategy | Co-finances joint purchasing, strategic stockpiling, and processing of rare earth elements to reduce single-source dependency. |
As highlighted by macroeconomic analysis from Reuters Global Economic News, the Commission’s strategy represents a transition from reactive tariff enforcement to proactive market access restriction.
EU and China trade relations face growing regulatory and tariff barriers. Source: Bloomberg / Bloomberg via Getty Images
De-Risking in Action: Critical Minerals & the RESourceEU Imperative
A core pillar of von der Leyen’s strategic agenda is severing Europe’s vulnerable supply chain dependencies. China currently controls over 70% of global lithium refining, 85% of rare earth processing, and a dominant share of permanent magnet manufacturing.
To counter this vulnerability, von der Leyen confirmed the formal launch of the European Critical Raw Materials Corporation under the broader RESourceEU initiative. This entity will serve as a centralized buyer and investor, co-funding strategic mining, processing, and recycling projects within the EU, North America, and partner nations across Africa and Latin America.
Key objectives of the mineral security framework include:
- Extraction Mandates: At least 10% of the EU’s strategic raw materials extracted domestically by 2030.
- Processing Sovereignty: At least 40% of the EU’s annual consumption of strategic raw materials processed within the bloc.
- Diversification Caps: No more than 65% of any strategic raw material sourced from a single third country.
Economic reporting by the Financial Times Trade Analysis notes that these targets represent one of the most aggressive state-supported supply chain realignment efforts in modern European history.
Geopolitical Fallout & Beijing’s Countermeasures
Beijing’s Ministry of Commerce (MOFCOM) has expressed strong opposition to Brussels’ hardening stance, warning that increased trade barriers risk destabilizing global recovery and violating World Trade Organization (WTO) principles.
In response to European investigations under the FSR and anti-subsidy rules, China has initiated targeted anti-dumping probes into European exports, including brandy, dairy products, and agricultural machinery. Analysts anticipate that further unilateral measures by Brussels could prompt reciprocal restrictions on European automotive and chemical majors operating in mainland China.
+-----------------------------------------------------------------------+
|                 EU-CHINA TRADE TENSION CASCADE MATRIX                  |
+-----------------------------------------------------------------------+
| 1. EU Measures: FSR Inspections, Tariff Escalation, Raw Material Caps |
|    │                                                                  |
|    ▼                                                                  |
| 2. Chinese Countermeasures: Target Agribusiness, Spirits, Luxury Goods|
|    │                                                                  |
|    ▼                                                                  |
| 3. Corporate Impact: Supply Chain Realignment, Dual-Hub Production    |
+-----------------------------------------------------------------------+
Strategic Playbook for Global Business Leaders
For corporate executive teams and supply chain planners navigating this evolving landscape, the European Union Trade Policy Framework recommends three strategic adjustments:
- Audit State Subsidy Exposure: European subsidiaries of non-EU firms must conduct thorough audits of parent company subsidies, tax credits, and state grants to avoid disqualification under FSR procurement reviews.
- Diversify Critical Mineral Sourcing: Manufacturers reliant on graphite, neodymium, lithium, or cobalt should secure secondary supply contracts outside China ahead of 2027 compliance deadlines.
- Adopt “China + 1” Regionalization: Multinationals serving both European and Asian markets should decouple supply chains into distinct regional hubs to insulate operations from tariff hikes and export controls.
Discover more from The Economy
Subscribe to get the latest posts sent to your email.
Global Trade
Trade Deficit & Terms of Trade Explained: Global Impact, Real-World Examples, and 2026 Insights
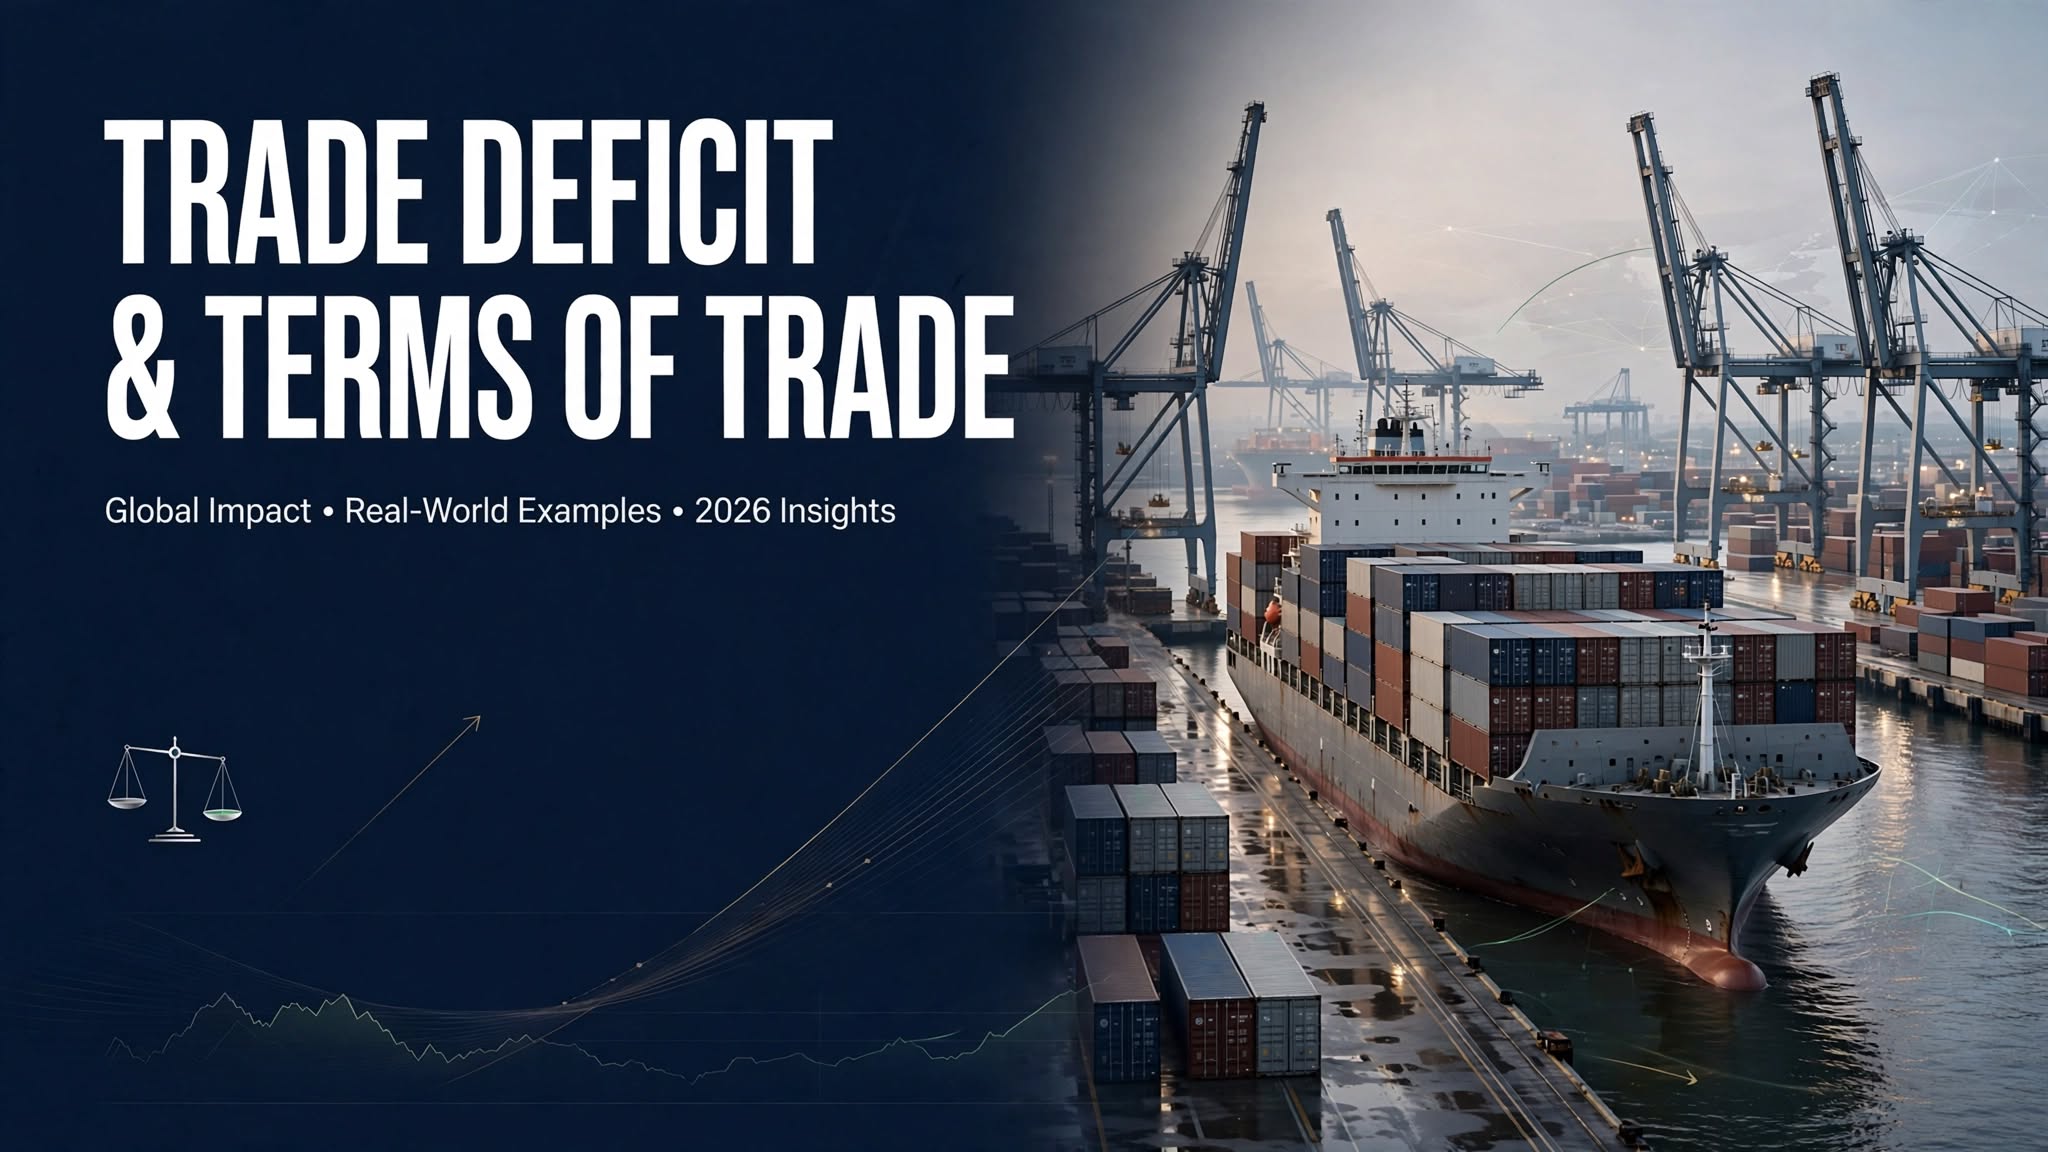
Navigating the Complexities of International Commerce and Value Exchange
International trade is the lifeblood of modern globalization. Within this vast ecosystem, two metrics stand out as vital indicators of a nation’s trading health: the Trade Deficit and the Terms of Trade (TOT).
For platforms like Thefinance.pk and Economy.com.pk, examining these metrics reveals whether a country is building sustainable wealth through global trade or slowly eroding its foreign exchange reserves through unfavorable commerce.
Trade Deficit: When Imports Outpace Exports
A Trade Deficit (specifically a merchandise trade deficit) occurs when the total monetary value of physical goods a country imports from abroad exceeds the total value of the goods it exports over a given period.
- The Nuance of Deficits: A trade deficit is not inherently catastrophic. If a developing nation runs a trade deficit because it is importing heavy industrial machinery, raw steel, and advanced technology required to build domestic manufacturing plants, the deficit represents productive investment in future export capacity.
- The Danger of Consumption Deficits: Conversely, if a trade deficit is driven by a nation gorging on imported luxury vehicles, consumer electronics, and foreign food items while exporting very little, it represents an unsustainable drain on national wealth and foreign exchange reserves. Chronic consumption-driven trade deficits frequently culminate in balance of payments crises.
Terms of Trade (TOT): The Exchange Ratio of Exports to Imports
While the trade deficit measures the volume and value gap, the Terms of Trade (TOT) measures the relative price ratio of a country’s exports to its imports. It is calculated using the following formula:
$$\text{Terms of Trade} = \left( \frac{\text{Index of Export Prices}}{\text{Index of Import Prices}} \right) \times 100$$
- Improving Terms of Trade: If a country’s TOT index rises above 100 (or increases over time), it means the prices of the goods it exports are rising faster than the prices of the goods it imports. For every unit of exports it sells, the country can now buy more imports. This signals a strengthening economic position and rising national income.
- Deteriorating Terms of Trade: If the TOT index drops, the country must export a larger volume of its goods just to buy the exact same amount of imports (such as oil or machinery). This is a common trap for developing nations that export low-value agricultural raw materials while importing high-value manufactured technology and energy.
The Real-World Application
Consider an oil-exporting nation: when global crude oil prices surge, its export prices skyrocket, causing its Terms of Trade to improve dramatically, even if export volumes remain unchanged.
Conversely, an oil-importing developing nation experiences a devastating collapse in its Terms of Trade during an energy crisis; its export earnings remain flat, but its import bill for fuel doubles overnight. This disparity explains why global commodity price fluctuations can instantly devastate an emerging economy’s macroeconomic stability.
Key Takeaways:
- A trade deficit occurs when the value of imported merchandise exceeds export earnings.
- Trade deficits are manageable if funded by capital imports for infrastructure, but dangerous if driven by luxury consumption.
- Terms of Trade measures the ratio of export prices to import prices, determining a nation’s purchasing power on global markets.
- Deteriorating terms of trade force nations to export more physical goods just to pay for essential imports like energy.
Authoritative Sources & Further Reading:
- United Nations Conference on Trade and Development (UNCTAD): Global Trade Statistics
- World Trade Organization (WTO): International Trade Trends and Market Analysis
Discover more from The Economy
Subscribe to get the latest posts sent to your email.

VIX Index Explained: How to Trade Wall Street’s Fear Gauge Today

Commercial vs Residential Real Estate: Which Wins in 2026?

Presidential Stock Market Performance: How Trump’s Second Term Compares to History

2026 Real Estate Market News: Are We Heading for a Correction?

Bitcoin Price Forecast 2026–2027: Will the 4-Year Cycle Hold?

Fidelity Crypto vs. Traditional Brokerages: A Guide for Modern Investors

The 2026 Global Smartphone Market: AI Integration and Competitor Analysis

SpaceX IPO: How Aerospace Is Reshaping Tech Startup News

Fidelity Investments Review: Maximizing Returns in a Volatile Stock Market

How Crypto Transformed the Trump Fortune: A $1.4 Billion Financial Breakdown

Global Pension Systems Ranked: The World’s Best and Worst Retirement Frameworks

Global Supply Chain Vulnerabilities: From Eurasian Trade Corridors to Food Consumer Recalls

Why 5% U.S. Treasury Yields Signal a Global Market Regime Shift.

Federal Reserve Defies White House Pressure: Inside Trump’s Demand for Sub-1% Interest Rates After Historic 2026 Rate Hike

US-China Relations in Q3 2026: Trade Tariffs and Supply Chain Risks

Top 30 Stocks for Investment in PSX for Massive ROI in 2026

SpaceX Starship Flight 14: First Orbital Attempt & Starlink V3 Launch Explained

The 2026 Crypto Regulatory Shift: What It Means for Institutional Investors

AI Chip Stocks 2026: The Best Semiconductor Investments Beyond Marvell

Tween Back-to-School Trends 2026: What’s Driving the $85B Season

AI-Powered Training: The Next Multi-Billion Dollar Ecosystem in Fitness

Oil Prices Break $100 in 2026: Middle East Conflict & Energy Markets

10-Year Treasury Yield Hits 4.80%: What It Means for Rates & Portfolios

Fidelity Investments Review 2026: SPAXX Yields & Zero-Fee Funds

BRICS+ Cross-Border Payments 2026: Interoperability Explained

Shein Clothes Quality & Safety in 2026: What Lab Tests Show

MRVL Earnings 2026: Why Marvell Sank Despite Beating Estimates

China’s US$10.8 Billion Trade Shortcut: Why the Pinglu Canal Matters
-

 Markets & Finance9 months ago
Top 15 Stocks for Investment in 2026 in PSX: Your Complete Guide to Pakistan’s Best Investment Opportunities
-

 Analysis7 months ago
Johor’s Investment Boom: The Hidden Costs Behind Malaysia’s Most Ambitious Economic Surge
-

 Analysis7 months ago
Top 10 Stocks for Investment in PSX for Quick Returns in 2026
-

 Analysis8 months ago
Brazil’s Rare Earth Race: US, EU, and China Compete for Critical Minerals as Tensions Rise
-

 Banks8 months ago
Best Investments in Pakistan 2026: Top 10 Low-Price Shares and Long-Term Picks for the PSX
-

 Investment8 months ago
Top 10 Mutual Fund Managers in Pakistan for Investment in 2026: A Comprehensive Guide for Optimal Returns
-

 Global Economy9 months ago
15 Most Lucrative Sectors for Investment in Pakistan: A 2025 Data-Driven Analysis
-

 Global Economy9 months ago
Pakistan’s Export Goldmine: 10 Game-Changing Markets Where Pakistani Businesses Are Winning Big in 2025