
Analysis
SpaceX Bond Deal: Inside the $20B Debt Play


Wall Street has spent the better part of a decade trying to accurately price the cosmos. Now, fresh off the most capitalized public market debut in history, Elon Musk’s orbital empire is forcing the global debt markets to finally do the math.
The looming SpaceX bond deal—a monstrous $20 billion fixed-income offering whispered through the syndicate desks of Manhattan this Tuesday morning—marks a definitive and permanent shift in aerospace economics. We are no longer talking about venture capital subsidized by billionaire vanity or speculative tech funds. We are talking about utility-scale infrastructure financing, brutally applied to the thermosphere.
The Macroeconomic Gravity of Orbital Debt
To fully grasp the sheer scale of this issuance, one must explicitly zoom out to observe the broader macroeconomic climate of 2026. The Federal Reserve’s benchmark interest rates currently sit in a complex, structurally elevated holding pattern. This dynamic makes corporate debt significantly more expensive than the zero-interest-rate anomaly that originally funded the company’s earliest experimental prototypes.
Yet, institutional appetite for hard, monopolistic space infrastructure remains utterly ravenous. According to recent capital flow data tracked by the Financial Times, corporate debt issuance within the broader aerospace and defense sector surged an astonishing 41% year-over-year in the first quarter alone.
The company’s record-shattering initial public offering late last year established a baseline equity valuation well north of $250 billion, cementing its blue-chip tech status. However, equity is inherently expensive, and continuous share dilution is a founder’s ultimate friction point. Securing $20 billion in corporate debt allows executive management to fully fund capital-intensive mega-projects without surrendering a single ounce of voting power or board control to outside activists.
The Core Development: Syndicating the Cosmos
The complex anatomy of this $20 billion offering reveals a highly strategic framework ripped straight from the historical playbooks of 19th-century railroad barons and 1990s telecom monopolists. Lead underwriters, purportedly a syndicate heavily anchored by Goldman Sachs and Morgan Stanley, are actively structuring the massive debt across multiple distinct tranches.
These sophisticated bond maturities are expected to stretch from five to thirty years, matching the long-term lifespan of the physical assets. The core, explicitly stated objective is bridging the brutal capital expenditure gap strictly required for the next generation of global satellite broadband infrastructure. Deploying the massive Starlink V3 constellation demands an estimated $15 billion in upfront manufacturing and launch costs over the next 36 months alone.
This endeavor isn’t merely about lofting advanced hardware into low Earth orbit; it is fundamentally about total terrestrial telecommunications dominance. According to a recent Bloomberg Intelligence analysis, the Starlink active subscriber base has decisively crossed the 15 million mark globally. That rapidly expanding base generates an annualized recurring revenue stream rapidly approaching a staggering $18 billion.
That highly reliable, monthly cash flow instantly transforms the company from an experimental rocket builder into a de facto telecommunications utility. The high-yield corporate bond market respects predictable cash flow above all else, regardless of whether the physical assets reside in terrestrial server farms or orbital planes.
Still, successfully issuing corporate debt at this unprecedented scale requires a flawless, mathematically bulletproof credit narrative. A preliminary sector report published by S&P Global Ratings explicitly notes that while the commercial space sector remains inherently high-risk, possessing a dominant, near-monopoly market share in orbital lift capacity provides a formidable economic moat.
The company currently controls over 85% of all global commercial launch mass physically originating from Earth. When you literally own the delivery mechanism, the cost structure of rapidly deploying your own proprietary satellite network is fundamentally asymmetric to your closest terrestrial competitors. The $20 billion will essentially act as a giant vendor-financing mechanism for their own internal launch operations heavily concentrated out of Cape Canaveral and Boca Chica.
Fixed-income investors and conservative institutional asset managers are meticulously analyzing the proposed bond yields this week. In a volatile market where traditional safe-haven assets offer respectable, albeit boring returns, corporate credit must offer a highly compelling premium to rationally justify the unique sector risk.
The benchmark 10-year tranche of the debt is currently rumored to aggressively price at approximately 275 basis points above equivalent U.S. Treasuries. For massive pension funds and life insurance companies desperate for long-term duration and fixed yield, that financial spread is utterly intoxicating. It reflects a bizarre, unprecedented market duality: the perceived operational risk of deep space travel perfectly offset by the utility-like monopoly status of the underlying broadband business.
Furthermore, the precise covenants strictly attached to these high-yield bonds will ultimately dictate the company’s long-term operational flexibility. Institutional buyers routinely demand strict debt-to-EBITDA ratios to legally protect their underlying principal from executive overreach. If the heavy-lift engineering development suddenly faces catastrophic delays, or if a highly publicized failure tragically destroys a critical launch pad, those rigid financial covenants could be technically breached.
The elite syndicate underwriters are likely wrestling deeply with how exactly to mathematically define a “material adverse event” in an experimental, bleeding-edge industry. Occasional explosive disassembly is historically just a routine part of the iterative aerospace engineering process. President and COO Gwynne Shotwell is reportedly leading the charge to assure credit rating agencies that operational mishaps are fully compartmentalized from financial solvency.
Recalibrating the SpaceX IPO valuation through debt
The rapid transition from Silicon Valley’s private darling to a fiercely scrutinized publicly traded behemoth forces a harsh, mathematical recalibration of corporate capital allocation. During its long private tenure, the company routinely tapped sovereign wealth funds and ultra-high-net-worth syndicates for rapid equity injections whenever cash balances ran dangerously thin.
The SpaceX IPO valuation, which completely stunned casual retail observers but aligned perfectly with internal Wall Street projections, established a hard floor for public market expectations. But equity markets demand perpetual, explosive quarterly growth, while debt markets demand perpetual, unbreakable financial stability. Reconciling these two opposing financial forces is the central, defining challenge for the company’s financial architects this fiscal quarter.
Why is SpaceX issuing $20 billion in bonds?
The primary purpose of the SpaceX bond deal is to finance the capital-intensive deployment of the Starlink V3 constellation and accelerate Starship commercialization without diluting shareholder equity. This fixed-income capital bridges the immediate cash flow gap required for heavy infrastructure expansion while preserving executive voting control.
That structured, highly disciplined injection of capital fundamentally alters the gravitational pull of the entire global aerospace sector. When a single corporate entity can borrow $20 billion at highly favorable, standardized corporate rates, it forcefully weaponizes its massive balance sheet against legacy competitors. Organizations like United Launch Alliance (ULA) and Arianespace rely heavily on slow-moving government subsidies and politically fraught defense contracts, which are deeply subject to congressional headwinds.
The newly public aerospace giant, conversely, is rapidly building a completely independent, self-funding orbital economy. Here, the aggressive corporate debt actively serves as an insurmountable competitive moat.
We are witnessing the rapid, unprecedented financialization of the cosmos in real time. Historically, space exploration was the exclusive, highly guarded domain of sovereign nation-states, funded entirely by taxpayer dollars and heavily justified mostly by geopolitical posturing.
The aggressive shift to private debt markets signifies that low Earth orbit is now officially recognized by Wall Street as a prime commercial real estate zone. The underlying, highly bankable asset isn’t physical land or raw materials; it is highly regulated electromagnetic spectrum rights and globally recognized orbital slots.
To permanently secure this debt, the company must effectively convince conservative creditors that its broadband revenue streams are entirely uncorrelated with earthly economic cycles or consumer recessions. Broadband connectivity is increasingly viewed by global economists as a non-discretionary, fundamental consumer expense, completely akin to municipal electricity or water.
If the consumer network can rigorously maintain its global subscriber churn rate below 2%, the resulting cash flows heavily servicing this massive debt load become remarkably predictable. That pure mathematical predictability is exactly what officially transforms an experimental, heavily publicized rocket company into a heavily sought-after, blue-chip credit profile for institutional buyers.
Second-Order Effects on Global Telecom and Defense
The profound economic ripple effects of this historic capital injection will be felt far beyond the concrete launchpads of South Texas. The immediate, high-profile casualty may very well be the legacy terrestrial telecommunications industry.
Armed with $20 billion in fresh, highly liquid capital, the company can aggressively subsidize the upfront consumer hardware cost of home receivers. This could potentially drop the retail entry price to absolute zero for users who sign long-term service contracts. This brutally effective tactic mimics the classic terrestrial cell phone carrier model but operates instantly on a truly planetary scale, actively bypassing local zoning laws and municipal fiber-optic monopolies entirely.
The precise capital allocation of the $20 billion debt facility is expected to aggressively target three core infrastructural pillars:
- Accelerated Raptor Engine Production: Scaling the manufacturing base to rapidly produce engines at a rate that mathematically supports a daily, commercial launch cadence.
- Next-Generation Receiver Hardware: Subsidizing the costly internal development of smaller, highly efficient consumer satellite dishes to drastically lower the financial barrier to entry in emerging markets.
- Orbital Refueling Infrastructure: Designing and rapidly deploying the complex orbital tank farms strictly necessary to smoothly execute deep-space logistical missions under existing federal defense contracts.
Rural and maritime connectivity markets will undoubtedly face instant, severe deflationary pricing pressure. Legacy satellite operators, already struggling deeply with the unyielding physics of high-latency geostationary orbits, will find their aging business models functionally obsolete overnight.
The Organisation for Economic Co-operation and Development (OECD) conservatively projects that the global space economy will comfortably exceed $1 trillion by 2030, but that growth will be wildly, ruthlessly asymmetric. A massively disproportionate share of that trillion-dollar market value will accrue directly to the single corporate entity that successfully controls the absolute cheapest freight costs to orbit.
For international policymakers, this unprecedented concentration of commercial power presents a thorny, incredibly complex antitrust dilemma. The Federal Communications Commission (FCC) and equivalent regulatory bodies in Europe and Asia will soon have to grapple with a single corporate entity directly controlling the vast majority of active satellites in human history.
When an essential global utility is heavily financed by aggressive Wall Street debt, the strict fiduciary duty to fiercely maximize shareholder return inevitably clashes with the public interest of equitable, fair spectrum access.
Small and medium enterprises (SMEs) tightly woven into the aerospace supply chain, however, are actively bracing for an unprecedented financial windfall this year. The $20 billion must ultimately be spent, and a highly significant portion will immediately flow into specialized tier-two domestic manufacturing.
Machine shops and hyper-specialized suppliers that can actually meet the ruthless, iterative manufacturing cadence of Starship production will quickly see their own corporate valuations soar. It is a modern, high-tech industrial renaissance, quietly but powerfully subsidized by high-yield corporate bonds.
That said, this immense debt load also introduces a genuinely novel form of systemic risk to the global financial market. If a catastrophic Kessler syndrome event—a cascading, uncontrolled chain of physical orbital debris collisions—were to physically disable a significant, core portion of the constellation, the monthly revenue strictly required to service the debt would instantly evaporate.
The global space insurance market currently lacks anywhere near the necessary capital capacity to fully underwrite a commercial loss of that astronomical magnitude. Bondholders are implicitly, perhaps completely unknowingly, self-insuring against the complex astrophysics of orbital mechanics.
The Bear Case for Orbital Leverage
Not everyone working on Wall Street is eagerly rushing to blindly finance humanity’s multi-planetary ambitions. Deep skeptics actively argue that the underlying unit economics of the heavy-lift program remain entirely unproven at a true, profitable commercial scale.
While the raw engineering achievements captured on high-definition video are undeniably spectacular, the difficult transition from successful, isolated test flights to a highly reliable, bi-weekly commercial launch cadence involves exponential, deeply compounding operational friction.
A prominent, highly vocal dissenting voice emerges directly from the traditional aerospace analyst community. According to a scathing research note detailing the U.S. Securities and Exchange Commission’s historical corporate filings on telecommunications debt defaults, capital-intensive satellite ventures have a historically brutal, highly unforgiving track record.
Legacy projects like Iridium and Globalstar both famously filed for catastrophic bankruptcy in the late 1990s and early 2000s after miserably failing to secure enough retail subscribers to properly service their massive, crippling debt loads. The harshest industry critics heavily argue that financial history is simply repeating itself today, albeit with substantially better public relations marketing and highly reusable rockets.
The fundamental crux of the institutional bear argument heavily hinges on calculating the true terminal market size. While there are undeniably billions of completely unconnected people globally, the vast majority of those individuals unfortunately reside in emerging economic markets with severely limited household purchasing power.
Consistently earning $120 a month from a rural North American household is a highly viable, deeply lucrative business. Successfully extracting an equivalent average revenue per user (ARPU) from rural Sub-Saharan Africa requires mathematically impossible, perpetual hardware subsidies. If the total addressable market for high-margin, low-latency broadband is significantly smaller than management’s aggressive internal projections, the entire cash flow waterfall quickly breaks down.
Furthermore, the geopolitical regulatory risk is definitively non-trivial and actively escalating on the global stage. Foreign sovereign governments, acutely aware of the severe strategic and military implications of an American-dominated low Earth orbit, are rapidly accelerating their own competing state-sponsored constellations.
Should rapidly escalating geopolitical tensions eventually result in intentional electromagnetic spectrum jamming or direct physical orbital interference, the company’s core revenue could suffer massive, unpredictable exogenous shocks. Fixed-income investors inherently detest geopolitical unpredictability above all other risk factors. Loaning $20 billion to a technology company whose primary revenue-generating assets orbit directly over hostile sovereign airspace at 17,000 miles per hour requires a profound leap of faith that traditional, terrestrial credit models severely struggle to quantify.
Even the absolute physics of the operation present unyielding, hard constraints that absolutely no amount of clever financial engineering can easily bypass. The Earth’s atmosphere constantly acts as a ruthless filter for corporate ambition.
Every single launch window is highly susceptible to the unpredictable chaos of coastal weather patterns, and the long-term metallurgical fatigue experienced by rapidly reusable booster engines remains a fiercely guarded corporate secret. If the physical refurbishing costs for the core booster fleet silently creep higher than internally modeled by the engineering teams, the projected profit margins required to easily cover the semi-annual bond coupon payments will thin out dangerously.
Debt investors, completely unlike optimistic venture capitalists, do not care whatsoever about the inspirational mission to colonize Mars or advance human consciousness. They only care about the absolute, ironclad certainty of the next interest payment successfully clearing the financial clearinghouse strictly on time.
Commercializing the Void
The imminent collision of high-stakes global finance and deep space engineering represents the absolute final frontier of modern, hyper-scaled capitalism. Issuing $20 billion in highly structured corporate debt is an audacious, historically unprecedented financial maneuver that forcefully compels the global capital markets to explicitly price the core infrastructure of the future.
It is a massive, carefully calculated gamble that the insatiable human demand for ubiquitous, low-latency data will consistently and profitably outpace the immense, unforgiving operational costs of continuously defying Earth’s gravity. If executive management successfully executes this highly complex capital deployment, they will have seamlessly constructed an insurmountable, planet-spanning economic fortress, fundamentally rewriting the deeply entrenched financial rules of the global aerospace industry forever. The institutional bond market is clearly no longer just passively funding terrestrial expansion; it is actively underwriting the brutal commercialization of the void.
Discover more from The Economy
Subscribe to get the latest posts sent to your email.


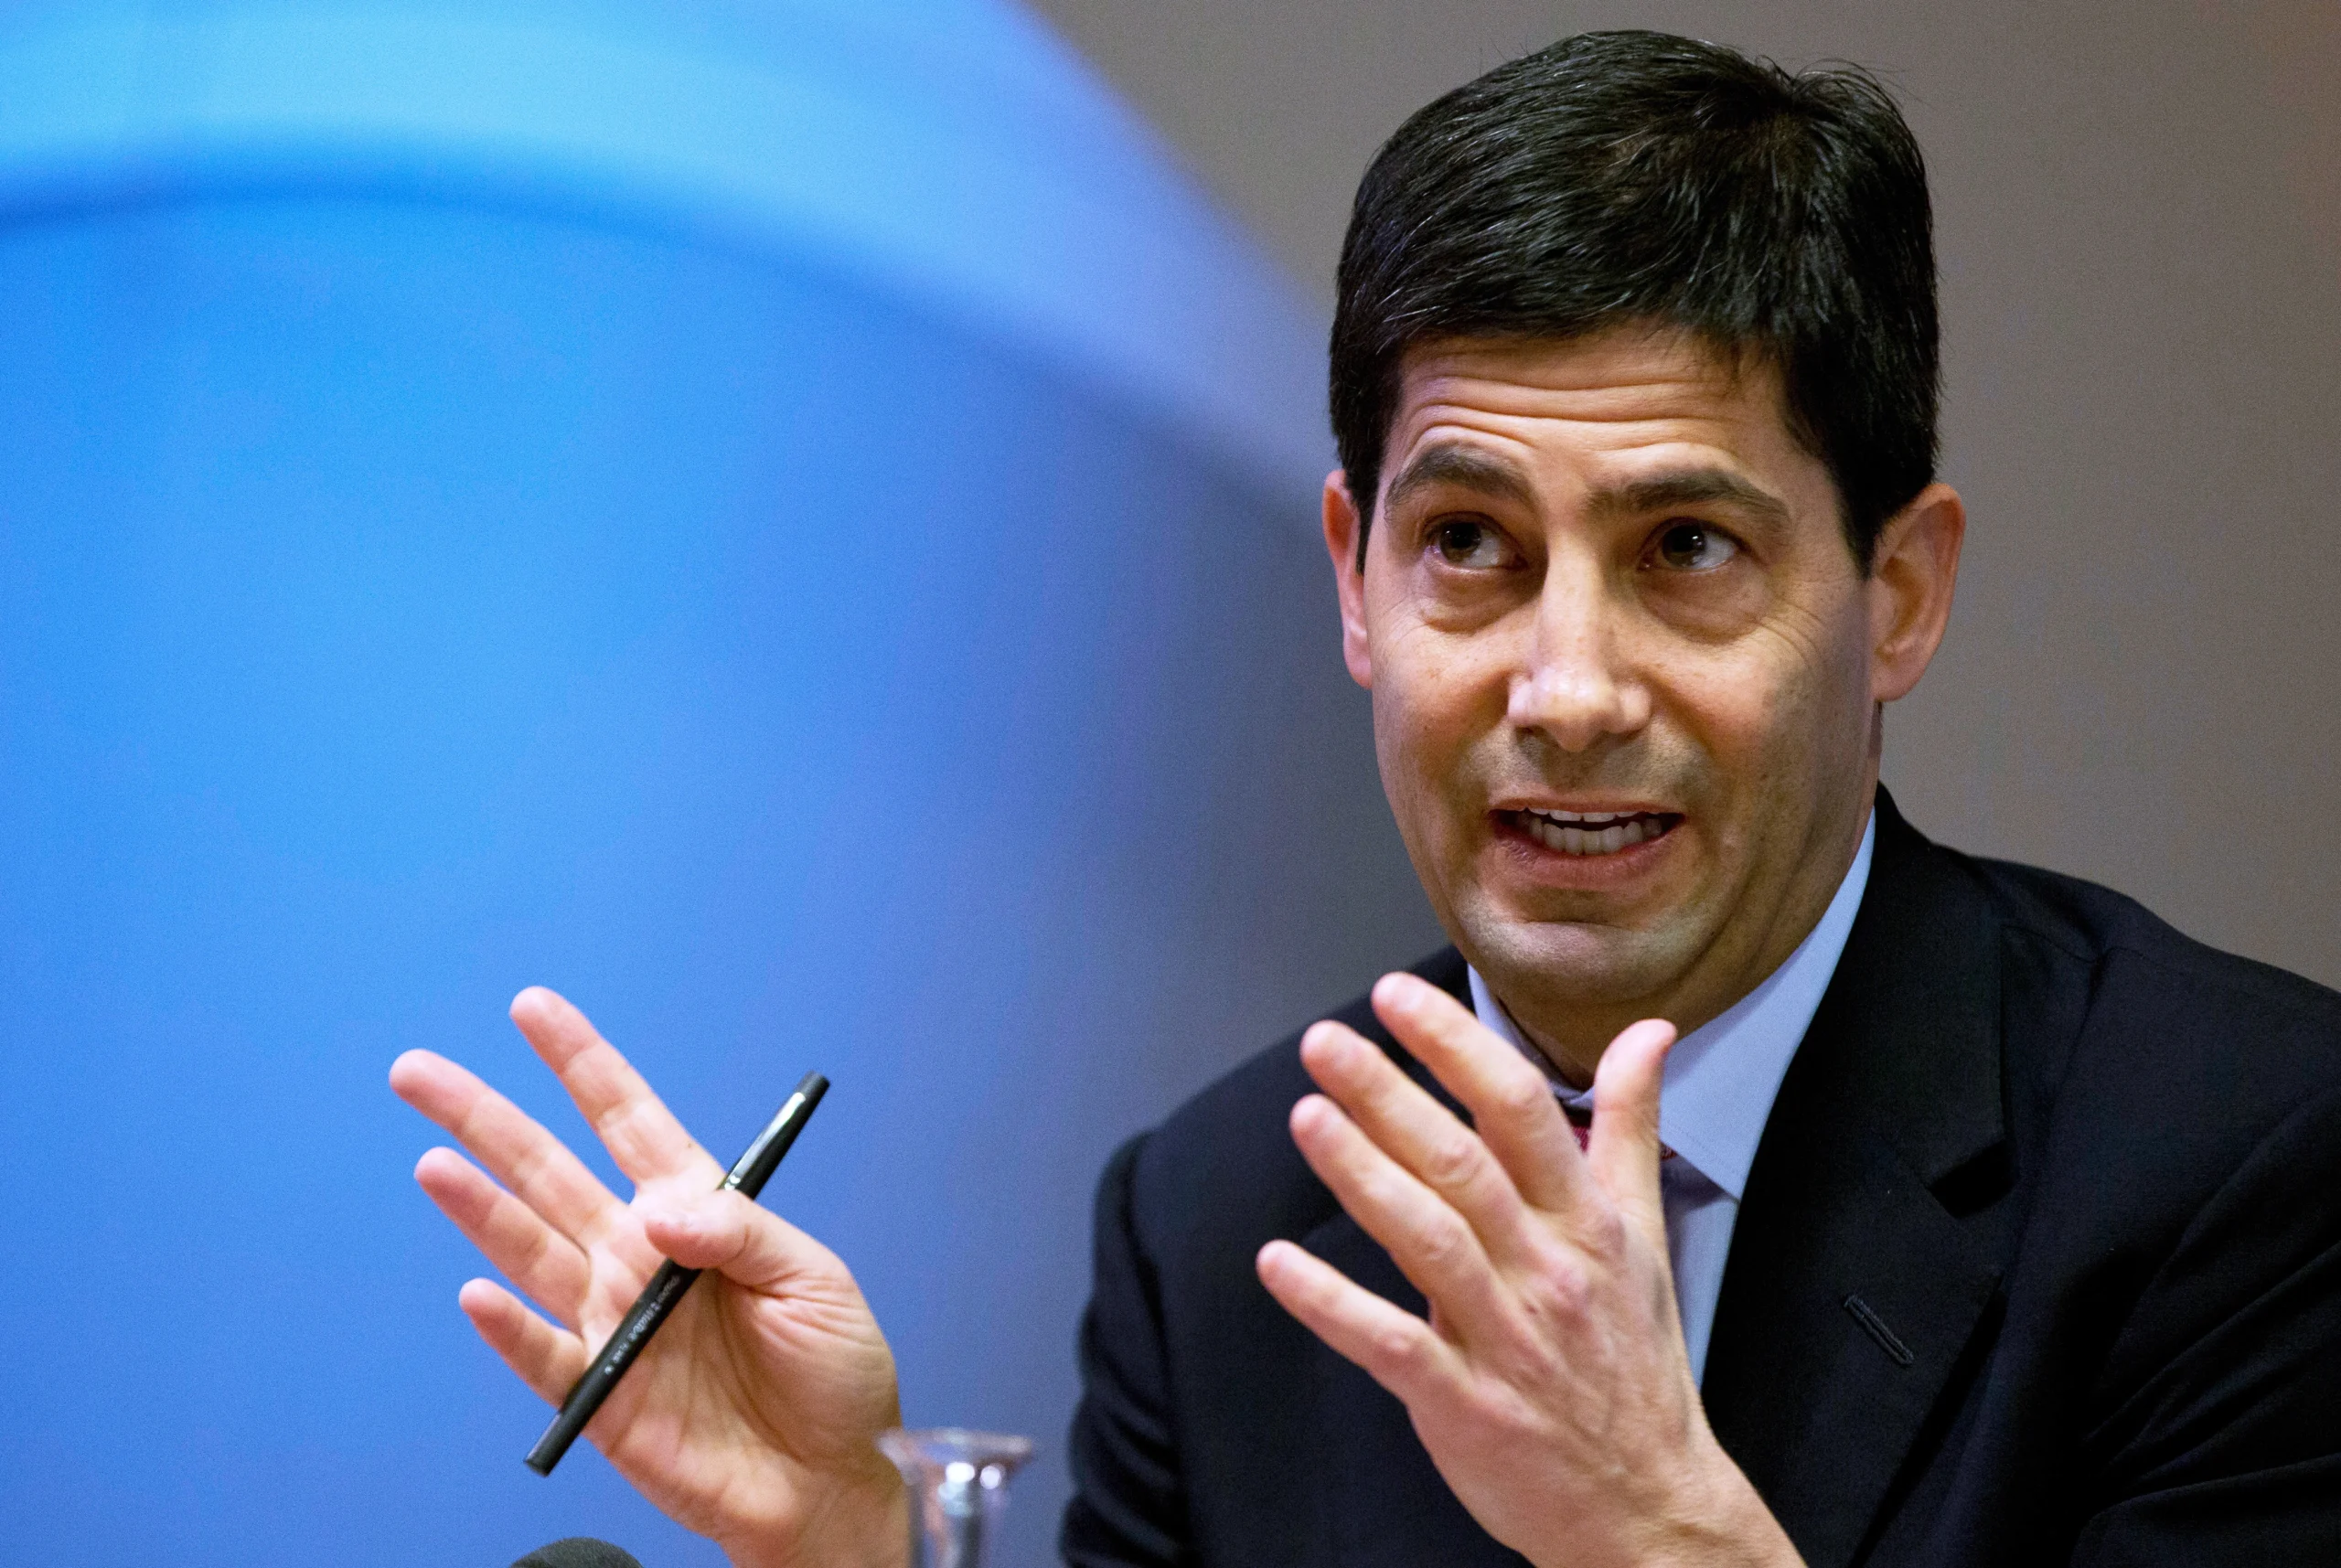
The Federal Reserve’s rate-setting committee held its benchmark borrowing rate steady on July 29, keeping it in a range of 3.5% to 3.75% — but the calm on the surface masked one of the most contested votes of the post-pandemic era. The Federal Open Market Committee split 9 to 3, with three members pushing to raise rates rather than hold, according to NPR’s coverage of the decision.
Chair Kevin Warsh, who took over the Eccles Building earlier this year after a nomination process that rattled bond markets, used his post-meeting press conference to make a point of not making a point. Rather than signal where rates are headed next, Warsh told reporters the Fed would judge market reaction “direct and unfiltered” instead of offering the rolling forecasts investors have come to expect, a stance detailed in CNBC’s meeting recap.
A rate hike was genuinely on the table
What made this meeting unusual wasn’t just the dissent — it was how close markets came to pricing in a hike rather than a cut. Fed funds futures tracked by CME Group put the odds of a rate increase at roughly 35% heading into the decision, up sharply from 26% a week earlier, according to CNBC’s markets analysis. That is a striking reversal from the rate-cutting cycle many investors had expected when Warsh’s nomination was first floated as a “productivity-led growth” pivot away from his predecessor’s caution.
The market reaction told its own story. The S&P 500 slid roughly 0.6% during Warsh’s press conference, the Dow shed more than 840 points intraday, and the 10-year Treasury yield rose to 4.657%, even as the Fed opted for a hold rather than a hike.
Why Warsh is playing it differently
Warsh’s approach reflects both economic and political calculus. Treasury yields have climbed since the Fed’s prior meeting despite the hold, a dynamic Warsh acknowledged directly. And unlike his predecessor, Warsh has been explicit that he intends to set policy independent of the White House’s preferences — even as he awaits a possible additional ally on the Board once a pending internal review concludes, according to CNBC’s analysis of the political backdrop.
Why this matters beyond Washington
A genuinely undecided Fed has knock-on effects well past US borrowers. Higher-for-longer Treasury yields pull global capital toward dollar assets, complicating rate paths in London, Ottawa, and emerging markets alike — a dynamic playing out in parallel with the UK’s own fiscal squeeze (see our companion report on the Autumn Budget) and China’s deflationary drag on global demand. For businesses and investors across the Gulf, Southeast Asia, and South Asia weighing dollar-denominated debt or dollar-pegged currencies, an unpredictable Fed chair is arguably a bigger variable than the rate level itself.
Discover more from The Economy
Subscribe to get the latest posts sent to your email.

The IMF’s Executive Board completed Pakistan’s third review of its 37-month Extended Fund Facility (EFF) and second review of its Resilience and Sustainability Facility (RSF) on May 8, 2026, unlocking roughly $1.1 billion under the EFF and $220 million under the RSF, according to the IMF’s official statement. Total disbursements under both arrangements now stand at roughly $4.8 billion. Acting Chair Nigel Clarke credited Pakistan’s “strong program implementation” for supporting macroeconomic recovery and building resilience to shocks.
The Genuinely Good Numbers
By the IMF’s own account, the underlying data supports the assessment. GDP growth accelerated to an average of 3.8% year-on-year in the first half of FY26, driven by the auto, construction and garment industries, even accounting for flood disruption in July-August, according to the IMF’s staff report. Inflation, while ticking up to 7.3% year-on-year in March as commodity price pass-through hit domestic energy prices, remained within a broadly contained range, with core inflation at 7.6%. The current account was described as broadly balanced, and reserve rebuilding exceeded earlier projections — the State Bank of Pakistan projects reserves continuing to climb to roughly $18 billion by June 2026, according to analysis from the Islamabad Policy Research Institute.
The State Bank confirmed receipt of $1.3 billion from the IMF on May 12, 2026, according to CSS Prep’s policy analysis, which notes reserves had fallen to dangerously low levels in 2022-2023 before this recovery.
The External Risk the IMF Flagged Explicitly
The Fund’s own report is notably candid about downside exposure: under its April 2026 World Economic Outlook adverse scenario, the cumulative hit to Pakistan’s GDP from continued Middle East conflict could rise to around 1.5 percentage points by FY27, with inflation and the current account deficit each worsening by roughly 1.5-2.5 percentage points of GDP, according to the IMF’s staff country report. Given Pakistan’s reliance on imported energy, oil price volatility discussed in the IMF’s global outlook feeds directly into this specific country risk.
The Reform Question That Keeps Recurring
The structural policy conditions attached to this review read as familiar territory: sustaining fiscal consolidation, broadening the tax base, maintaining tight monetary policy to keep inflation within the State Bank’s target range, and advancing energy-sector reform — commitments the IMF’s own end-of-mission statement described as still “ongoing” rather than complete, per the IMF’s March 2026 mission statement.
A sharper framing comes from Pakistani policy analysts themselves: reforms that would genuinely break the IMF-program cycle — broadening the tax base to include agriculture and retail, ending energy subsidies, privatizing loss-making state-owned enterprises — impose concentrated, visible costs on politically organized interest groups, while the benefits of reversing those costs are diffuse and delayed, according to CSS Prep’s analysis. That political-economy imbalance, the analysis argues, consistently favors populist continuation of stabilization support over the structural reform that would end the need for it — a pattern this third review’s genuine macroeconomic progress doesn’t yet break.
Social Cost of the Adjustment
Pakistan’s poverty headcount rate rose to 25.3% in FY24, up sharply from 18.3% in FY22, driven by overlapping shocks from COVID, floods and inflation, according to the IMF’s staff report. The Benazir Income Support Programme (BISP) remains the primary social protection mechanism absorbing the distributional cost of IMF-mandated energy price increases and fiscal tightening — whether its scale is adequate remains, in the IMF’s own words, a live policy question rather than a settled one.
Discover more from The Economy
Subscribe to get the latest posts sent to your email.
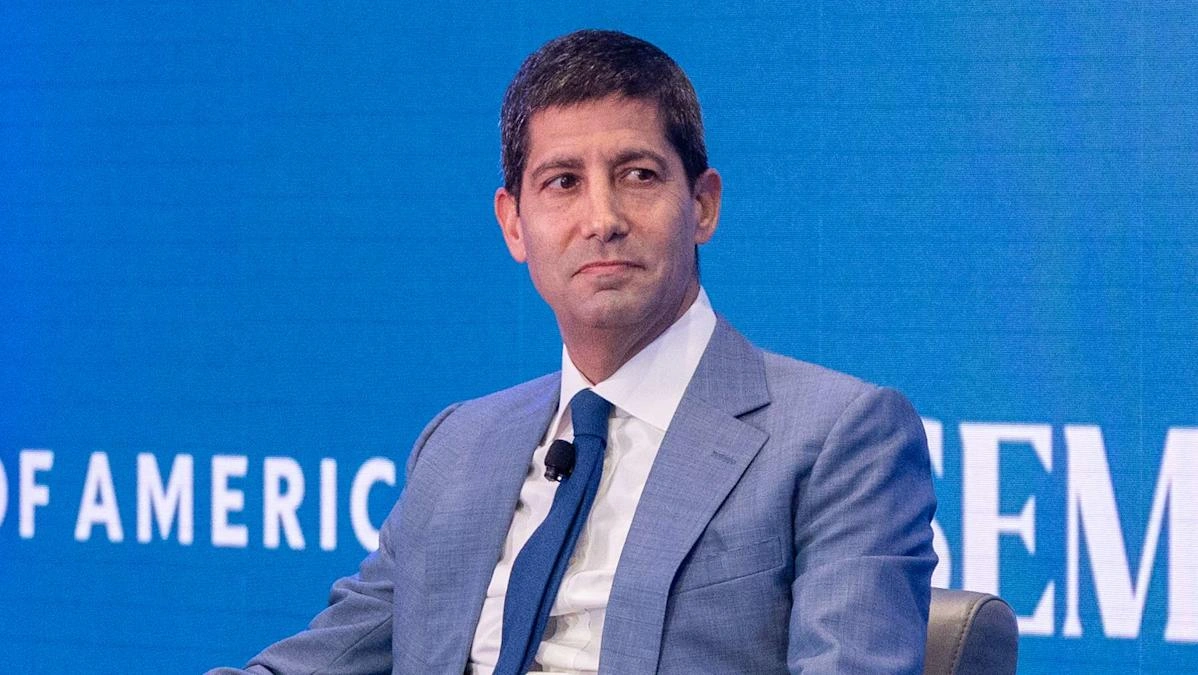
The Federal Reserve held its benchmark interest rate steady at 3.5%-3.75% on July 29, 2026, but the more consequential detail was the vote itself: 9-3, with three regional Federal Reserve Bank presidents — Cleveland’s Beth Hammack, Minneapolis’s Neel Kashkari, and Dallas’s Lorie Logan — dissenting in favor of a rate hike, according to CNBC’s coverage of the meeting. Inflation has remained above the Fed’s 2% target for more than five years, the underlying tension driving the split.
A New Chair, A Different Communication Style
The decision was the latest under Fed Chair Kevin Warsh, who took over after Jerome Powell’s term expired on May 15, 2026, according to iShares’ 2026 Fed outlook. Warsh has deliberately shortened the Fed’s post-meeting statements and pulled back on the kind of explicit forward guidance markets had grown accustomed to under his predecessors — he has reportedly dedicated one of five internal task forces specifically to rethinking how the Fed communicates, according to CNBC’s reporting. Warsh has publicly called inflation “a choice,” repeatedly emphasizing the importance of getting prices under control in recent congressional testimony.
At his post-meeting press conference, Warsh pushed back on characterizing the decision as a “pause,” instead describing it as “a rigorous review of the economic situation” and “a view of what our own homework is to try to resolve those questions in the period ahead,” according to a separate CNBC recap. Warsh has reportedly used the phrase “family fight” 13 times across five public appearances to acknowledge the committee’s internal divisions — an unusually candid framing for a sitting Fed Chair.
Why the Split Exists
Governor Christopher Waller has separately voiced concern that higher rates could become necessary without more inflation progress, even though he voted for the hold at this meeting. The full committee’s June projections penciled in one quarter-point increase by the end of 2026 — a notable shift from the rate-cutting path markets had priced in earlier in the year, according to the Fed’s own June 2026 Summary of Economic Projections, which explicitly flags that the federal funds rate outlook “is subject to considerable uncertainty” given how sensitive each participant’s view is to how inflation and employment data evolve from here.
Complicating Factors
Renewed U.S.-Iran tensions have already pushed mortgage rates near a one-year high independent of the Fed’s own decisions, since longer-term rates track Treasury yields and inflation expectations rather than the Fed funds rate directly, according to CNBC’s analysis. Separately, iShares had earlier projected that once a new Chair was confirmed, the Fed might seek one or two rate cuts to bring rates closer to a 3%-3.25% range — a path the July hold and hawkish dissents now put in serious doubt.
The next FOMC meeting is scheduled for September 15-16, 2026, and will include a fresh Summary of Economic Projections, according to Forbes’ Fed tracker — the next real test of whether Warsh’s committee can narrow its internal divide or whether the “family fight” framing becomes the defining feature of Fed policy through the rest of 2026.
Discover more from The Economy
Subscribe to get the latest posts sent to your email.

Rachel Reeves’s £25 Billion Problem: What the Autumn Budget Gap Means for Britain

Inside the Fed’s Most Divided Vote in Years: Why Warsh Held the Line on Rates

Pakistan Passed Its Third IMF Review

The Fed Is Fractured — And a New Chair Just Made It Louder, Not Quieter

The UK Economy in 2026 Is Neither Recession Nor Recovery :Stagflaton

Indonesia’s $121 Billion Nickel Bet Is Facing a Battery Chemistry

Why Ultra-Wealthy Families Are Splitting Between Singapore and Dubai inmarkets 2026

China Chose Political Control Over Fixing Its Deflation Trap in 2026

Oil Markets Are Oversupplied and Geopolitically Explosive at the Same Time

Russia’s Budget Deficit Blew Past Its Full-Year Target in Three Months

Malaysia’s Rare Earth Bet: Six Powers Are Negotiating for Kuantan at Once

Gulf Sovereign Capital Bypasses Pakistan Despite Record 2026 Spending Spree

Pakistan’s $10bn US Facility Request: Inside the New Gulf Capital Triangle

China Criticizes US Bill Targeting Russian Oil Buyers — Why It Matters

AI Bubble Warning 2026: Why BIS, IMF and Bank of England Fear a Market Crash

Russia Bans Diesel Exports 2026: Global Fuel Market Impact Explained

Gold Price Forecast 2026: Fed’s July 29 Decision and Record Central Bank Buying Explained

Strait of Hormuz Blockade 2026: Oil Prices Surge 9% as US-Iran Conflict Reignites

Strait of Hormuz 2026: Why Markets Still Don’t Trust It’s Open

Down But Not Out: Inside the Slow Sinking of Russia’s War Economy

Gulf Capital Retreat From Pakistan 2026: UAE Loan Freeze & What It Means

China Politburo July 2026: Stimulus Signals Explained

Pakistan IMF Deal 2026: Third Review Cleared, Budget 2026-27 and Inflation Outlook

Pakistan Economy 2026: GDP Grows 3.7% as IMF Completes EFF Review Amid Middle East Risk

Global Stock Market Selloff 2026: Stagflation Fears Return as Iran Conflict Reignites

Apple vs OpenAI Lawsuit: The Economic Story Behind the Headline

The Yuan Now Settles 67% of Russian Oil Payments — Quiet De-Dollarization in Action

Indonesia Russian Oil Imports 2026: Why Jakarta Is Diversifying Crude Supply
-

 Markets & Finance7 months ago
Top 15 Stocks for Investment in 2026 in PSX: Your Complete Guide to Pakistan’s Best Investment Opportunities
-

 Analysis5 months ago
Johor’s Investment Boom: The Hidden Costs Behind Malaysia’s Most Ambitious Economic Surge
-

 Analysis6 months ago
Top 10 Stocks for Investment in PSX for Quick Returns in 2026
-

 Analysis6 months ago
Brazil’s Rare Earth Race: US, EU, and China Compete for Critical Minerals as Tensions Rise
-

 Banks7 months ago
Best Investments in Pakistan 2026: Top 10 Low-Price Shares and Long-Term Picks for the PSX
-

 Investment7 months ago
Top 10 Mutual Fund Managers in Pakistan for Investment in 2026: A Comprehensive Guide for Optimal Returns
-

 Global Economy7 months ago
15 Most Lucrative Sectors for Investment in Pakistan: A 2025 Data-Driven Analysis
-

 Global Economy7 months ago
Pakistan’s Export Goldmine: 10 Game-Changing Markets Where Pakistani Businesses Are Winning Big in 2025