
Oil Markets
Russia Bans Diesel Exports 2026: Global Fuel Market Impact Explained

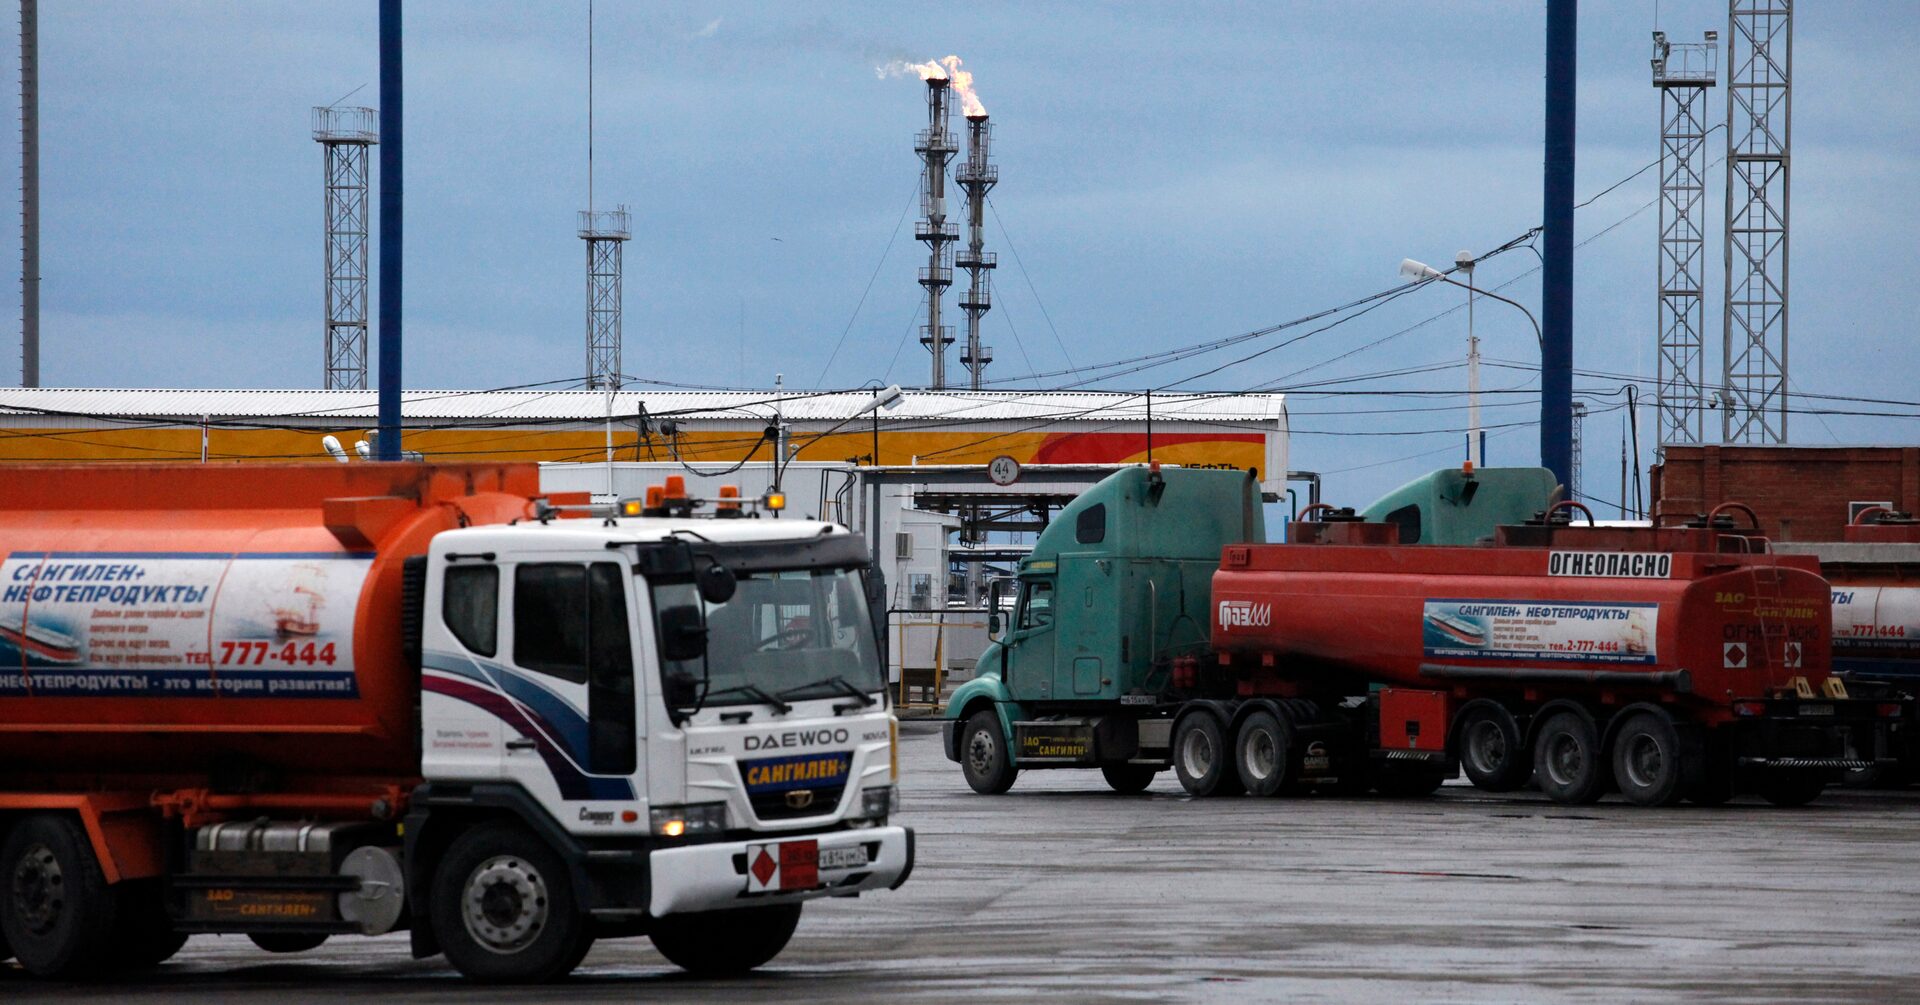
For months, the story of the global fuel market has been the Strait of Hormuz. Now there’s a second front, and it’s coming from a completely different direction: Ukrainian drones over Russian refineries.
On July 8, 2026, Russian Deputy Prime Minister Alexander Novak announced a full ban on diesel exports, telling officials the move was needed “to increase supplies to the domestic market,” as reported by Reuters via TFTC. What makes this ban different from earlier restrictions is scope: it now covers producers, not just non-producing intermediaries, closing a loophole that had previously let oil companies keep selling fuel abroad, according to The Deep Dive.
The strikes behind the shortage
This isn’t a policy choice made from a position of strength. It’s triage. Ukraine’s drone campaign has hit more than 16 major Russian refineries and fuel terminals, according to OilPrice.com, knocking out over 30% of the country’s refining capacity. The single most damaging strike hit Gazprom Neft’s Omsk refinery, Russia’s largest, where upgraded Fire Point FP-1 drones — flying more than 2,500 kilometers — disabled the plant’s primary crude distillation unit, which normally handles up to 40% of the facility’s output.
The domestic fallout is visible at the pump. Russia is facing roughly a 20% shortfall in gasoline production, and more than 20 regions have imposed fuel-rationing measures, limiting sales to 20 liters per vehicle and banning canister refills, per reporting from United24 Media. Farmers mid-harvest are reporting diesel shortages, and Moscow has begun importing fuel — including from India’s Nayara Energy refinery in Gujarat — to plug the gap.
Why this matters well beyond Russia
Russia accounted for about 11% of global diesel supply in 2025, according to Bloomberg. Losing that volume from the export market at the same moment the Iran war has already squeezed Gulf supply chains is, in market terms, a double hit. European diesel margins have already jumped to a record $60.17 a barrel, and seaborne diesel and gasoil exports from Russia collapsed 39% month-on-month even before the full ban took effect, according to The Moscow Times.
There’s a second-order effect that matters for anyone watching central banks. As one analysis from TFTC puts it, the diesel squeeze compounds the dilemma facing the US Federal Reserve: energy-driven inflation prints give hawks cover to hold rates higher, even as the broader economy shows signs of softening. That’s the same paralysis that defined 2022–23 — and it’s reassembling just as new Fed leadership is trying to rebuild its policy framework from scratch (more on that below).
Who benefits, and who’s exposed
Turkey and Brazil absorbed at least half of Russia’s available diesel cargoes in June, with Morocco, Egypt and Senegal also emerging as buyers before the restrictions kicked in, per Ground News. Those buyers will now need to look elsewhere, adding competitive pressure to a market already strained by Hormuz-related disruption.
The ban is scheduled to run through July 31, 2026, but few analysts expect it to lift cleanly on that date. Russian economist Kirill Rodionov, cited by The Moscow Times, has noted that diesel carries a higher margin than gasoline and is more heavily exported — meaning Moscow has stronger incentives to lift this particular ban quickly than it did with the gasoline restriction, which has effectively become permanent.
For importers across Asia and Africa already grappling with elevated energy costs from the Iran conflict, the message is blunt: the world’s fuel supply chain is now being squeezed from two directions simultaneously, and neither pressure point looks likely to ease before autumn.
Discover more from The Economy
Subscribe to get the latest posts sent to your email.


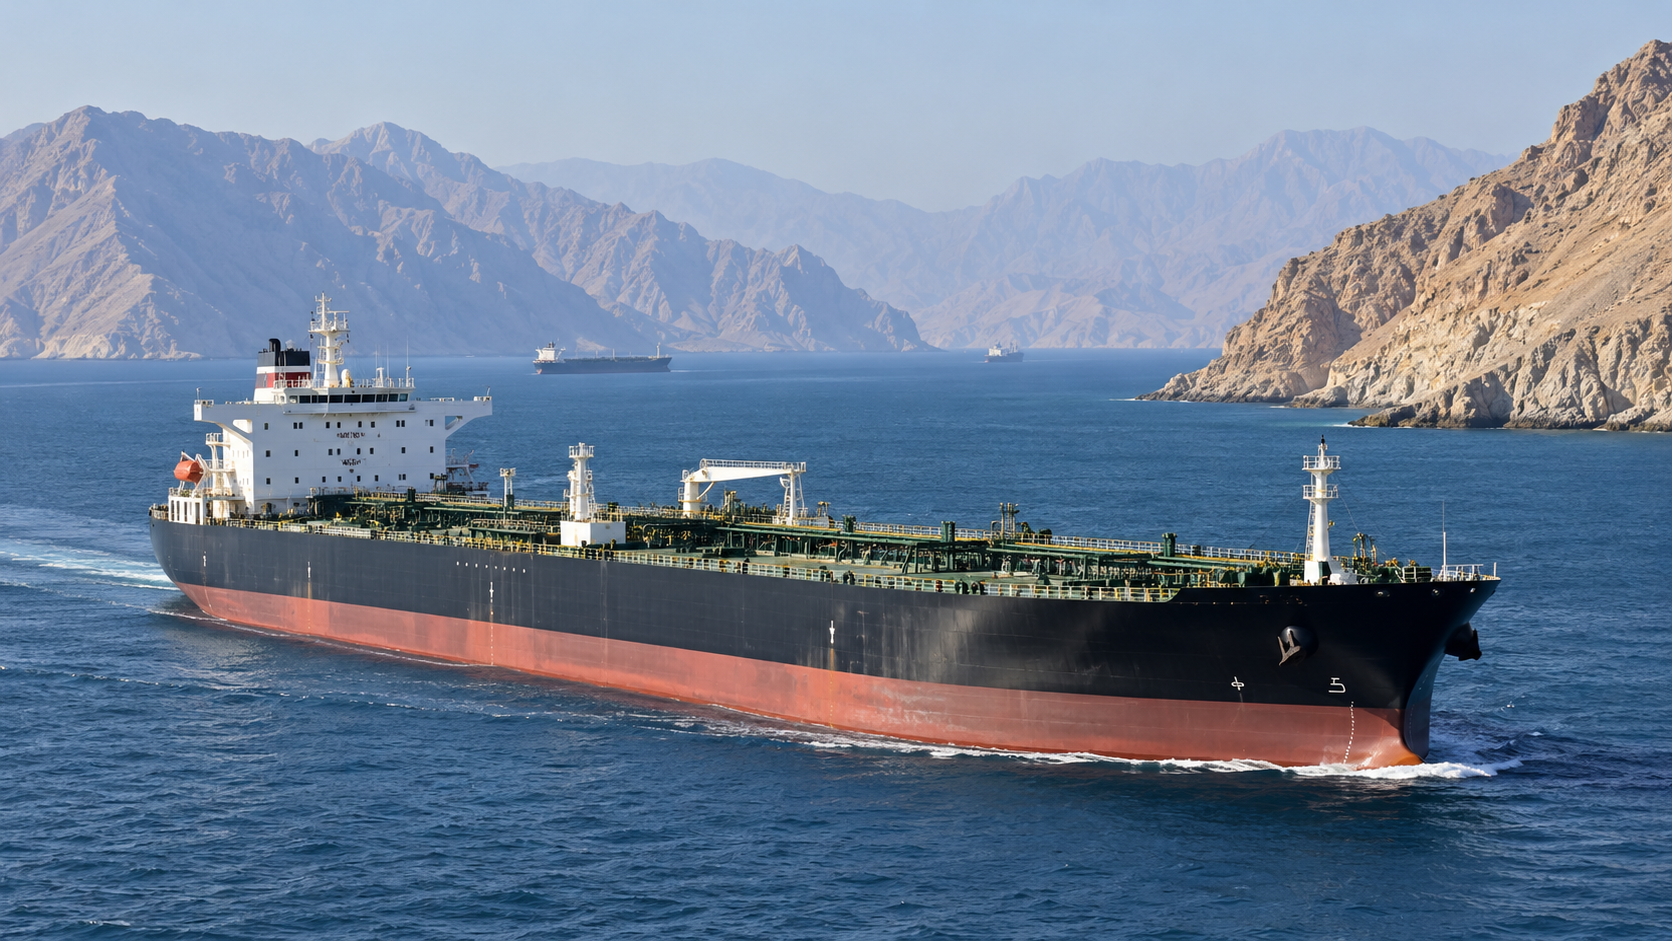
The diplomatic dispute between the United States and Iran has direct consequences for energy markets, commercial shipping and household costs around the world. A proposal to reopen the Strait of Hormuz could reduce pressure if implemented, but an offer is not the same as an agreement, and an agreement is not the same as vessels returning safely to normal routes.
On October 18, Reuters reported Iran’s reiteration of a conditional proposal for reopening the waterway and continuing negotiations. The report described unresolved differences between the parties. Readers should treat the proposed timeline as a diplomatic claim contingent on acceptance and implementation, not an accomplished reopening.
Why Hormuz matters
The Strait of Hormuz links the Persian Gulf with wider maritime trade routes. Disruption can affect flows of crude oil, refined products and other cargo, while insurance and freight costs can rise even for shipments that are still moving. The economic impact depends on the duration of disruption, the ability of producers to reroute exports and the availability of substitute supplies.
One of the most common mistakes in energy reporting is to assume that every barrel of oil diverted or released immediately replaces the same amount of diesel, gasoline or jet fuel. Refining configuration, product inventories and transport capacity affect what consumers can actually buy.
Diplomatic offers contain conditions
A reopening proposal needs examination of who controls access, what sanctions might change, how hostilities would pause and what verification arrangements exist. According to Reuters, Iran’s October proposal was tied to a list of conditions and the United States had not accepted them in full. That explains why a headline about talks should not be framed as a completed peace agreement.
The nuclear issue introduces another dimension. Differences over uranium enrichment and security assurances affect trust and sequencing. Analysts should distinguish confirmed public statements from unattributed negotiating leaks and describe any remaining uncertainties.
Oil prices transmit the conflict globally
Higher oil prices alter transport costs, manufacturing costs and inflation expectations. Reuters coverage of Gulf markets illustrates how markets can react differently to the same regional tensions: some exporters may benefit from elevated prices while importers and financial markets face stronger pressures.
For airlines, higher jet fuel prices can feed into fares with a lag. For farms and supermarkets, diesel and fertilizer expenses can affect the food supply chain. For governments, imported energy may widen trade deficits and complicate efforts to reduce inflation.
Why a ceasefire would not end every economic problem
Even a verified de-escalation would leave practical questions about ship insurance, port operations, damaged infrastructure and commercial confidence. Companies may require weeks or months to restore normal schedules and rebuild inventory. Markets can anticipate a diplomatic breakthrough faster than logistics systems can deliver one.
The IMF’s October outlook identifies conflict escalation and energy effects among global downside risks. Those risks have especially uneven effects across countries.
Three scenarios to watch
In a negotiated reopening, shipping traffic and risk premiums could gradually ease, subject to verification. In a prolonged stalemate, supply chains may continue operating under elevated costs and uncertainty. In an escalation, disruptions could spread or intensify, adding inflationary pressure and financial volatility. None is guaranteed; each depends on military and diplomatic decisions that can change rapidly.
Readers should follow official government statements, shipping data and independently reported market developments. Avoid live-timing claims based on rumors and separate scheduled negotiations from signed agreements.
How to assess the actual shipping recovery
One useful sign of reopening would be sustained increases in verified commercial transits, not merely a single vessel passage. Analysts would also watch marine-insurance premiums, freight rates, tanker queues, port congestion and the ability of importers to receive cargo on time. Some vessels may need new clearances or voyage plans. Others may remain unwilling to transit despite a diplomatic announcement. Price movements can anticipate these changes, but forecasts of normal shipping should be tested against operational data. A reopening is most meaningful when it is safe, repeatable and commercially viable—not just diplomatically declared.
Frequently asked questions
Has the Strait of Hormuz fully reopened?
The cited October 18 report described a conditional proposal and unresolved negotiations, not a verified full reopening.
Why does the conflict affect food prices?
Fuel, freight and fertilizer costs move through production and distribution chains, potentially raising consumer prices later.
Can energy prices fall quickly after a deal?
Market prices may respond rapidly, but physical supply and retail prices can adjust more slowly.
Discover more from The Economy
Subscribe to get the latest posts sent to your email.

Ukraine’s expanding campaign against Russian oil infrastructure is revealing vulnerabilities in Vladimir Putin’s war economy. Yet damaging refineries is only the beginning. The real challenge is converting industrial disruption into sustained economic and diplomatic leverage.
A New Front in the War of Attrition
Wars are often decided not simply by what armies capture, but by what governments can continue to afford. Ukraine appears increasingly determined to test that proposition against Russia’s oil industry.
On October 15, Ukrainian drones struck a refinery in Russia’s Ryazan region, roughly 300 kilometres southeast of Moscow. The attack followed a short-lived pause in strikes on energy infrastructure, which Kyiv said it had observed despite continued Russian attacks. The Associated Press reported that Russian authorities acknowledged the strike, while Reuters documented its growing diplomatic significance.
The episode illustrates an uncomfortable reality for Moscow: Russia’s enormous geographical depth no longer guarantees the security of its industrial heartland.
But it also reveals Ukraine’s dilemma. The more effectively Kyiv disrupts Russian refining, the more it risks upsetting international petroleum markets and frustrating governments anxious about fuel prices.
The distinction matters. Ukraine is not physically destroying Russia’s vast underground oil reserves. Its campaign primarily targets the infrastructure that transforms crude into usable fuels, stores petroleum products and moves energy supplies.
Ukraine’s strategic achievement will therefore not be measured by the number of refineries hit, but by whether their disruption changes Russia’s capacity and willingness to continue the war.
That is a much more demanding test.
Why Oil Remains Central to Russia’s War Economy
Russia’s dependence on hydrocarbons is one of the enduring contradictions of its geopolitical position.
Energy exports provide Moscow with international revenues, fiscal resources and relationships with countries that have declined to join Western sanctions. At the same time, the concentration of valuable industrial facilities creates vulnerabilities that military spending alone cannot eliminate.
The scale of the industry is considerable. According to a September 2026 International Energy Agency assessment, Russia operates 32 major refineries with approximately 6.5 million barrels per day of installed processing capacity.
Yet the country’s oil wealth is not interchangeable with its refining capacity.
A barrel of crude underground is a geological resource. A barrel extracted is a marketable commodity. A barrel refined into diesel, aviation fuel or gasoline serves a different economic purpose.
Disrupting one stage does not automatically eliminate the others.
That distinction becomes especially important when considering the Russian treasury.
On October 15, Reuters calculated that Russian federal oil and gas tax receipts were expected to reach approximately one trillion roubles in October, an increase of 10 percent from a year earlier.
The projected rise largely reflected scheduled tax payments, while elevated global petroleum prices provided further support.
Yet Reuters also estimated that cumulative oil and gas revenue from January through October would be 14 percent lower than in the corresponding period of 2025.
The apparently contradictory figures point to a central challenge in evaluating Ukraine’s campaign: Russia can suffer industrial losses while still collecting substantial revenues.
A financially strained war economy is not necessarily a financially defeated one.
Ukraine’s Drone Campaign Is Changing the Industrial Battlefield
The expansion of Ukraine’s long-range drone operations represents one of the war’s most consequential technological developments.
For a country facing an adversary with substantially greater territory, industrial resources and conventional military power, relatively inexpensive unmanned aircraft offer a means of imposing costs far beyond the immediate battlefield.
The consequences are increasingly measurable.
The IEA’s September analysis found that Russian refinery throughput fell to approximately 3.8 million barrels per day in June 2026, roughly 30 percent below its level a year earlier and the lowest in more than two decades.
Reported gasoline output had declined by about 20 percent compared with 2025 levels, while estimated diesel production was down nearly 30 percent.
The agency also reported that a Russian refinery was struck, on average, once every three days during the first eight months of 2026.
These findings from the IEA’s detailed refinery assessment are important because they describe an increasingly persistent problem rather than a collection of isolated attacks.
There is a difference between damaging an installation and repeatedly preventing it from operating normally.
When refineries are forced into recurring cycles of shutdown, repair and restart, the economic burden extends beyond lost fuel production. Maintenance schedules become unreliable, replacement equipment becomes more valuable, and operators must devote greater resources to protection.
The IEA reports that damage to complex secondary processing units can require six to eight months to repair, compared with considerably shorter periods for some less complicated refinery equipment.
The effects of such damage are not necessarily limited to the individual facility. Even if Russia can continue extracting and exporting crude, its ability to supply refined petroleum products domestically and internationally may deteriorate.
This helps explain why Moscow has repeatedly restricted fuel exports in an effort to preserve domestic supplies.
The tactical appeal to Ukraine is evident: sustained disruption can force Russia to defend industrial assets hundreds or even thousands of kilometres from the front.
As the Center for Strategic and International Studies has argued, the conflict increasingly involves competing strategies of long-range attrition, with Ukraine seeking to expose Russian economic vulnerabilities while Moscow continues to attack Ukraine’s infrastructure.
Neither side can assume that success against infrastructure automatically produces success in negotiations.
The Problem With Trying to Bankrupt an Oil Power
The economic logic of Ukraine’s strategy is powerful, but its limitations are frequently underestimated.
It is tempting to assume that every damaged Russian refinery represents a proportional reduction in Moscow’s ability to finance its military operations.
Oil markets do not operate so conveniently.
Consider three separate effects.
First, reduced refining capacity can diminish Russia’s production of diesel, gasoline and aviation fuel, creating domestic shortages and reducing the availability of exportable petroleum products.
Second, Moscow may attempt to redirect some crude that can no longer be processed domestically toward international buyers, provided extraction, storage, transport and export capacity allow it.
Third, disruptions to global petroleum supplies may increase prices, helping Russia earn more on barrels it continues to sell.
The third possibility is particularly uncomfortable for those hoping that infrastructure attacks will rapidly exhaust Russia’s finances.
If world prices rise sufficiently, a producer can sometimes earn more from fewer exported barrels. The outcome depends on discounts, freight costs, sanctions, taxes, volumes and buyers’ willingness to continue trading.
Russia’s ability to take advantage of that mechanism is constrained, however.
On October 13, Reuters reported that shipping costs for Russian Urals crude from western ports to India had reached record levels. Some one-way voyages from the Black Sea were costing between $27 million and $30 million, compared with about $19 million in September.
Those costs illustrate another source of pressure on Moscow: high oil prices do not necessarily translate into equally high net export earnings.
Still, the distinction between damage to refining assets and losses to government finances must remain at the center of the argument.
The decisive economic question is not how much refining capacity Ukraine can temporarily disable, but how much sustained revenue, productive capacity and strategic flexibility Russia ultimately loses.
An effective assessment would track refinery throughput, petroleum-product exports, repair durations, crude export volumes, domestic fuel availability, tax receipts and transport costs over several months.
Judged against those measures, the campaign has already imposed meaningful disruption. It has not yet demonstrated that energy strikes alone can force an end to Russia’s military campaign.
The Global Energy Dilemma: When Pressure on Russia Hurts Everyone
Ukraine’s oil strategy now operates within a global energy market already destabilized by conflict in the Middle East.
The IEA’s October 2026 Oil Market Report described severe pressure on diesel markets as disruptions in Russian and Middle Eastern supplies compounded one another.
The agency reported that global diesel exports in September were approximately 700,000 barrels per day lower than a year earlier.
That decline cannot be attributed entirely to Ukraine’s strikes. Middle Eastern disruptions, shipping constraints and refinery problems elsewhere have played major roles.
Indeed, this distinction is essential to understanding the diplomatic controversy.
Some political leaders may find it expedient to blame expensive fuel on Ukrainian attacks. But the market evidence points to multiple interacting causes rather than a single campaign.
The wider economic consequences are substantial.
Diesel powers freight transport, agricultural equipment, construction machinery and important industrial activities. When it becomes scarce or expensive, the effects spread into food prices, business costs and household budgets.
Oil-importing economies are particularly vulnerable. Countries with limited fiscal capacity may struggle to protect consumers from sustained increases in fuel prices.
The geopolitical consequences also reach India and China, major destinations for Russian crude exports.
For New Delhi, access to Russian petroleum must be balanced against international sanctions exposure, shipping costs and domestic energy security. Beijing similarly has commercial incentives to maintain supply diversity while avoiding excessive dependence on any single geopolitical relationship.
These countries are not merely observers of Ukraine’s campaign. Their purchasing decisions influence how effectively economic pressure on Russia can be sustained.
Europe faces its own dilemma: maintaining support for Ukraine while controlling energy costs that can weaken industrial competitiveness and political confidence.
For Kyiv, the danger is that the success of its operations may become an argument used by others to restrain them.
A strategy designed to increase Russia’s economic pain could also create political pressure on Ukraine if its perceived contribution to global fuel scarcity becomes substantial.
That does not automatically make the strategy misguided. It means its economic effects must be judged globally, not only within Russia.
Washington’s Changing Position Complicates Kyiv’s Calculations
The most immediate strategic risk may not lie in Russian retaliation, but in the uncertain position of the United States.
The October 2026 controversy over refinery strikes has exposed the extent to which energy policy and diplomacy are becoming intertwined.
President Donald Trump has criticized Ukraine’s renewed attacks on Russian refineries and sought arrangements to increase Russian diesel supplies.
The Financial Times reported Zelenskyy’s rejection of pressure to abandon the campaign, while Reuters on October 17 detailed the broader deterioration in relations between Washington and Kyiv.
The dispute extends beyond rhetoric.
Ukraine remains dependent on external military equipment, intelligence cooperation and technological systems. Diplomatic confrontation with a major security partner therefore carries practical risks.
On October 18, Reuters reported that U.S. Secretary of State Marco Rubio had outlined a period of up to 60 days for reviewing the economic implications of Russia-related sanctions and tariffs temporarily waived by Washington.
The same report discussed a separate arrangement intended to increase Russian diesel supplies to international markets.
For Ukraine, these developments create a paradox.
Kyiv is trying to raise the economic cost of Russia’s invasion at a moment when Washington is seeking additional Russian fuel supplies to relieve market pressure.
Europe’s willingness to maintain sanctions, financial assistance and military support consequently becomes even more important.
Yet Ukraine should not confuse political frustration with strategic independence.
An effective campaign must consider not only what can be damaged inside Russia, but also what diplomatic support could be endangered outside it.
The objective should be to preserve the greatest possible pressure on Moscow while maintaining the international coalition necessary to sustain Ukraine’s defense.
That requires political judgment as well as military capability.
The Question of Legality and Civilian Harm
Any serious examination of energy warfare must confront a question that strategic calculations often neglect: when does an industrial facility become a lawful military target?
The answer is not that every installation contributing economically to an enemy state may automatically be attacked.
Under international humanitarian law, civilian objects are protected unless they qualify as military objectives under the applicable rules.
The International Committee of the Red Cross explains that a facility’s contribution to an adversary’s general economic strength is not, by itself, sufficient to establish that it is a lawful military target.
A specific facility must make an effective contribution to military action, and its destruction, capture or neutralization must offer a definite military advantage in the circumstances.
Even when infrastructure qualifies as a military objective, the rules governing distinction, proportionality and precautions remain applicable.
Refineries and fuel depots may have both civilian and military functions. Their legal status cannot therefore be determined simply by describing them as components of the Russian economy.
The foreseeable effects on workers, nearby communities and essential civilian services must also be considered.
Oil facilities carry environmental hazards that can extend beyond the immediate site of an attack. Fires, spills and contamination may create consequences lasting much longer than the military operation itself.
The ICRC’s guidance on the environment and warfare emphasizes that environmental harm is relevant to the legal assessment of military operations.
These principles must apply consistently.
Russia’s long-running attacks on Ukraine’s electricity and heating infrastructure have exposed civilians to severe humanitarian risks. Kyiv’s own operations must nevertheless be assessed under the same applicable humanitarian protections.
On October 18, Zelenskyy alleged that Russian forces had attacked Ukraine’s energy and oil-and-gas sectors 76 times in the preceding week, according to Reuters. The figure was presented as the Ukrainian president’s account, not as an independently established count.
Russia’s responsibility for launching the full-scale invasion in 2022 remains a fundamental part of the conflict’s context. But that responsibility does not eliminate the legal obligations governing individual attacks by either belligerent.
Ukraine’s international standing is strengthened, not weakened, when its military strategy is accompanied by a credible commitment to civilian protection.
Why Even Successful Strikes May Not Produce a Strategic Breakthrough
Ukraine’s approach contains an understandable assumption: economic pressure can alter the incentives of a government engaged in a prolonged war.
History suggests that such pressure can matter. It does not establish that disruption will necessarily bring concessions.
Authoritarian governments may shift economic burdens onto households, ration scarce supplies, redirect resources from civilian consumption and suppress political opposition.
Russia also retains considerable adaptation capacity.
The IEA reports that Russian refiners have responded to repeated damage through accelerated repairs, postponed maintenance and the reactivation of idle processing equipment.
Sanctions may complicate the replacement of specialized machinery, but they do not make all repairs impossible.
Nor does public inconvenience necessarily translate into political opposition capable of changing Kremlin decisions.
There is another complication: Ukraine itself is acutely vulnerable to energy disruption.
According to Reuters reporting on October 12, the country relies almost entirely on imported fuel because its own refineries have been destroyed or seriously damaged during the war.
Logistical difficulties, rising prices and interruptions to transport routes have consequently created additional risks for Ukraine’s domestic diesel supplies.
The result is a conflict in which both countries are attempting to impose costs on the other’s energy system while remaining vulnerable to the same international markets.
An energy truce could, in principle, reduce those mutual losses. But it would require credible commitments, verification and enforcement mechanisms.
As a recent CSIS assessment examines, the effectiveness of reciprocal restraint depends on the broader military and bargaining environment.
A ceasefire that removes Ukraine’s leverage while leaving Russian attacks or other coercive capabilities intact would be strategically unbalanced.
Equally, an unlimited campaign of mutual infrastructure destruction could deepen civilian suffering without bringing either side closer to a negotiated settlement.
A sustainable strategy must therefore be capable of both imposing costs and supporting diplomacy.
The Real Test: Converting Disruption Into Leverage
Ukraine’s attacks on Russian oil facilities have demonstrated an important reality: even a major energy power cannot assume that its industrial infrastructure is insulated from a technologically adaptable opponent.
Russia’s refineries are under pressure. Domestic fuel supplies have been disrupted. Repair and protection costs are rising. Moscow is being forced to devote attention and resources to threats far from the conventional front.
Ukraine does not need to exhaust Russia’s oil reserves to expose the vulnerabilities of its war economy. But it does need to turn temporary disruption into durable strategic advantage.
These are genuine strategic gains.
But Ukraine should resist the illusion that economic warfare offers a rapid substitute for military endurance, effective sanctions, dependable alliances or a credible diplomatic settlement.
The most effective approach would combine pressure on militarily relevant energy infrastructure with international economic restrictions, careful monitoring of Russia’s fiscal condition and sustained diplomatic coordination.
Success should be measured against a clear standard: whether the campaign reduces Moscow’s ability to sustain aggression and improves Ukraine’s prospects for a secure peace.
If disruption merely rearranges Russian export flows while high oil prices protect Kremlin revenues, the strategic gains may prove smaller than the physical damage suggests.
If, however, sustained attacks increase repair costs, constrain critical fuel supplies, reduce Russia’s net energy earnings and reinforce international diplomatic pressure, the cumulative effect could become significant.
The danger is mistaking the visibility of an explosion for the permanence of an economic loss.
That is the difference between attacking an industry and changing the course of a war.
Discover more from The Economy
Subscribe to get the latest posts sent to your email.
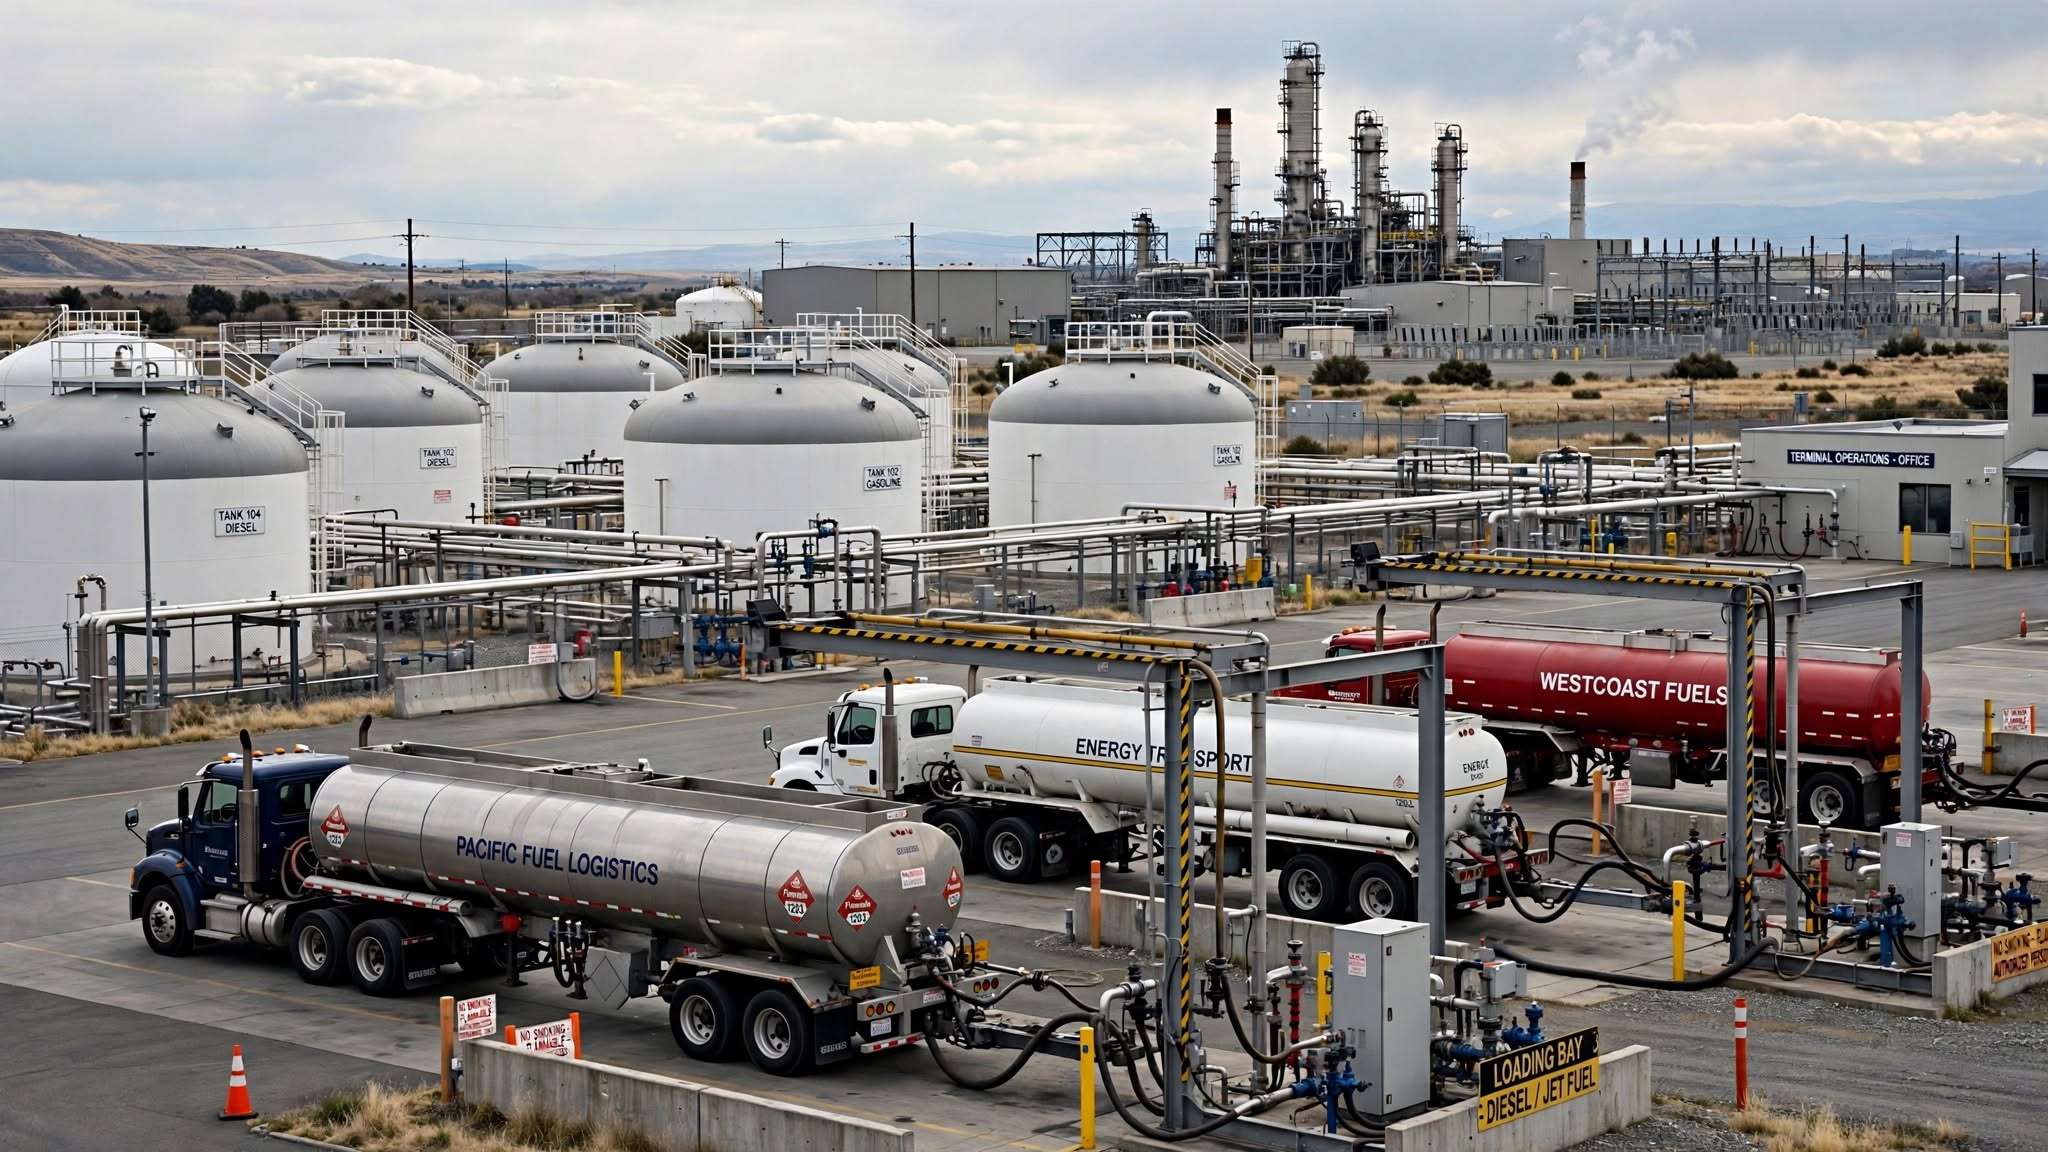
Crude prices and diesel prices follow related but different supply chains. Refinery capacity, transport and product inventories help explain the gap. Original research October 12; updated October 15, 2026. Verify newer developments before publication.
Reuters reported on October 15 that ongoing conflict and maritime disruptions continue to influence oil and energy prices. Avoid equating a crude price change with an identical movement in retail diesel prices. Source. Historical material further below is contextual and must not be mistaken for a live quotation or price.
What changed since the original research cutoff
Reuters reported on October 15 that ongoing conflict and maritime disruptions continue to influence oil and energy prices. Avoid equating a crude price change with an identical movement in retail diesel prices. The publication date and observation time are crucial: market prices, competition results and government announcements cannot be extrapolated from an earlier snapshot. A more useful reader question is what remains current today and what requires verification at the moment of a financial or travel decision. The new development should be checked against the primary or contemporary reference rather than assumed from an older headline.
What is happening and why readers are searching
Energy prices are back near the center of the inflation debate in October 2026. Associated Press reporting on October 12 described elevated crude prices and market reactions to proposed Russian diesel purchases against the backdrop of international tensions. The existence of political announcements does not establish that contracted volumes have already arrived or reduced retail pump prices. Sources: Associated Press energy coverage and International Monetary Fund.
The important context competitors can overlook
Crude oil and diesel are related but different markets. Refineries need the right feedstock, sufficient capacity, suitable shipping routes and compliance with regulations. A region can have adequate crude yet experience tight middle-distillate supply because of refinery disruptions, inventory shortages or freight bottlenecks. Trucking, agriculture and industrial logistics transmit fuel costs into goods prices with different time lags. For primary-source checks and current reporting, see Associated Press energy coverage and World Trade Organization. The key distinction is separate crude headlines from finished fuel supply.
A practical way to use this information
Follow refinery output, diesel inventories, freight costs and wholesale spreads alongside Brent and WTI. For consumers, compare a weekly average fuel price with the prior month rather than inferring national inflation from one service station. For businesses, test whether fuel surcharges are formula-based or discretionary. The honest answer to “will diesel get cheaper?” depends on both delivered product supply and demand.
Why lower crude does not always mean cheaper diesel
| Link in the chain | Potential bottleneck | What to watch |
|---|---|---|
| Crude extraction | Disruption or policy limits | Delivered crude availability |
| Transportation | Tanker capacity and insurance | Freight and route costs |
| Refining | Unit outages and product mix | Diesel output and margins |
| Distribution | Storage, taxes and local supply | Wholesale-to-retail lag |
A political agreement may improve expectations before physical shipments change inventories. This is why fuel inflation coverage should distinguish a possible future supply release from barrels or diesel cargoes actually received.
What to verify before making a decision
The right next step is to identify the source, timestamp and applicable market or jurisdiction. Check whether a number is a historical observation, official announcement, target, forecast or scenario. If you intend to act financially, legally or commercially, use the relevant provider’s current terms and obtain professional advice where appropriate. The sources cited here establish context; they are not a substitute for live prices, individual eligibility checks or binding agreements.
Reader questions
Is diesel price the same as oil price? No. Refining capacity, product inventories, shipping and local taxes create substantial differences.
Do policy announcements lower pump prices immediately? Not necessarily; delivery timing and wholesale markets determine pass-through.
Crude oil and diesel are connected—but not the same commodity
Crude oil is a refinery input, while diesel is one of several refined fuels that emerge from processing it. A change in the crude benchmark affects refiners’ input costs, but the price of diesel also depends on local refinery capacity, maintenance, fuel specifications, product inventories and transport availability. A refinery can have access to crude and still be unable to produce enough diesel for its market. Conversely, a region with healthy diesel inventories may see pump prices respond more slowly to an international crude rally. This is why headlines about a political agreement to increase crude supply should not automatically promise immediate relief to truck drivers.
The difference between the selling price of a refined product and its crude input cost is often discussed through a refining margin or crack spread. These spreads fluctuate as product demand and refinery utilization change. They can rise sharply when product supply is constrained even if crude prices soften. For readers, a graph of Brent oil alone cannot explain every regional diesel price move. Look for product-level benchmarks and inventory data alongside the crude quotation.
How a fuel shock enters broader inflation
Fuel costs affect more than motorists. Trucks carry food, building materials and consumer goods; farm machinery uses diesel; ships and industrial users depend on related refined energy products. Higher transport costs can flow into freight contracts and eventually shelf prices, but the timing depends on contract terms, profit margins and competition. Airlines typically face jet-fuel costs rather than road-diesel costs, so a service article should not present every transport sector as using the same product. Households also respond differently depending on commuting needs and heating arrangements.
An energy shock can affect headline inflation quickly through direct fuel prices, while broader price pressure may take longer. Central banks often distinguish volatile energy components from measures intended to capture underlying inflation, but persistent energy increases can influence expectations and wage negotiations. Reporting should describe the channels without claiming a specific change in CPI before the statistics agency releases its measured result.
Four scenarios for October’s energy market
First, an announced supply deal may be implemented and deliver usable fuel after shipping, payment and compliance arrangements are complete. Second, the deal may be delayed or revised, leaving near-term product shortages unresolved. Third, refinery disruptions or shipping bottlenecks may offset additional crude availability. Fourth, weakening economic demand could reduce consumption even while geopolitical risks remain elevated. In each case, the direction of the crude price, diesel price and pump price may differ. A scenario is a tool for reasoning, not an assertion that an event has occurred.
The distinction is especially important when headlines mention a government statement or preliminary agreement. A political declaration is not physical delivery; a cargo nomination is not necessarily a completed arrival; and the arrival of crude is not itself the production of road-ready diesel. For verification, identify the party making the statement, the product and volume involved, the destination, the delivery window and any relevant sanctions or trade restrictions.
What businesses can do about fuel exposure
A delivery company can examine route optimization, fleet efficiency and whether fuel surcharges fairly reflect current costs. A manufacturer can review freight contracts, supplier concentration and inventory policies. A small retailer should calculate how much of total expense is actually fuel-sensitive before raising prices across the board. Households may compare total travel costs, not just the pump-price sign. All these responses have tradeoffs: extra inventory ties up cash, and hedging instruments can create their own financial risks.
For investors, energy producers, refiners and transport companies can react very differently to the same headline. An oil producer may benefit from higher crude prices while an airline faces higher fuel costs. A refiner’s profitability can depend more on product margins than on crude’s absolute level. Sector labels should never substitute for analyzing actual business exposure.
A practical fuel-price monitoring dashboard
Compare Brent and WTI crude with regional diesel benchmarks, refinery utilization, relevant inventories, transport constraints and local tax structures. Date each observation and note whether figures are daily prices, weekly averages or monthly reports. The U.S. Energy Information Administration is a useful primary source for U.S. energy data. Official inflation releases help distinguish the impact on consumer prices from speculative claims about a future inflation wave.
A good oil-and-diesel article protects readers from two oversimplifications: that every supply announcement immediately changes retail prices, and that every increase in crude produces an identical change in diesel. The market has multiple stages, each with its own constraints and lags.
Discover more from The Economy
Subscribe to get the latest posts sent to your email.

AI Investment Boom 2026–2027: Can Pakistan Capture the Upside?

Global Economy 2026–2027: What Slower Growth Means for Pakistan

Why Global Inflation Is Rising Again in 2026, and What It Means for Pakistan

Raast Pakistan 2026: Digital Payments, Fintech

Pakistan Real Estate Tax 2026: What Buyers, Sellers and Investors Must Check

SME Finance Pakistan 2026: Why Small Businesses Still Struggle for Credit

Pakistan IMF Programme 2026: Why Bailouts Keep Returning

Agri-Tech Pakistan 2026: Where Farming Innovation Could Actually Pay

Pakistan Tax Net: Why Agriculture, Retail and Property Are So Hard to Tax

KSE-100 Index 2026: Is Pakistan’s Stock-Market Recovery Sustainable?

Pakistan IT Exports 2026: What Would It Take to Reach $10 Billion?

Pakistan AI Policy 2025: Can It Raise Productivity and Create Jobs?

Pakistan Remittances 2026: How Overseas Workers Support the Economy

Can Pakistan Reach $34 Billion in Exports? The Real Barriers and Fastest Fixes

Crude Oil & Petroleum Market Analysis: OPEC+ Decisions and Price Forecasts

World’s Largest Economies: Ranking the Top Global Powers

Pakistan Economy 2026: Inside the SBP’s Balancing Act

Asian Stock Markets 2026: Japan, China, Pakistan & More

Silver Price Today: Why the Xi-Trump AI Standoff Is Fueling a Safe-Haven Rally

SpaceX IPO 2026: History’s Biggest Stock Debut?

Oil Prices 2026: Inside the Hormuz Crisis That Won’t End

Algorithmic Dogfights: Why the U.S. and China Must Establish Rules of Engagement for Autonomous Air Power

Top US Convenience Store Chains: Store Counts, EV Charging, and Sales Trends

Who Is Shivon Zilis? The Neuralink Executive at the Center of the Musk–OpenAI Trial

Business Insurance: What Coverage You Actually Need and What It Costs in 2026

Global Economic Outlook 2026: 7 Forces Reshaping Markets, Trade and Business

Corporate America Faces a New Debt Test as US Borrowing Costs Surge

Is AI a Stock Bubble in 2026? What the Data Shows
-

 Markets & Finance10 months ago
Top 15 Stocks for Investment in 2026 in PSX: Your Complete Guide to Pakistan’s Best Investment Opportunities
-

 Analysis8 months ago
Johor’s Investment Boom: The Hidden Costs Behind Malaysia’s Most Ambitious Economic Surge
-

 Analysis8 months ago
Top 10 Stocks for Investment in PSX for Quick Returns in 2026
-

 Banks9 months ago
Best Investments in Pakistan 2026: Top 10 Low-Price Shares and Long-Term Picks for the PSX
-

 Analysis9 months ago
Brazil’s Rare Earth Race: US, EU, and China Compete for Critical Minerals as Tensions Rise
-

 Investment9 months ago
Top 10 Mutual Fund Managers in Pakistan for Investment in 2026: A Comprehensive Guide for Optimal Returns
-

 Global Economy10 months ago
15 Most Lucrative Sectors for Investment in Pakistan: A 2025 Data-Driven Analysis
-

 Global Economy10 months ago
Pakistan’s Export Goldmine: 10 Game-Changing Markets Where Pakistani Businesses Are Winning Big in 2025