
Oil Markets
Dropping Oil & Surging Gold: Navigating Safe-Haven Investments in Q3


Gold traded above $4,500 an ounce in mid-to-late August 2026, marking a third consecutive weekly gain, while oil continued to soften on oversupply signals — a divergence that, on the surface, looks contradictory, according to Trading Economics. It isn’t. The two moves are mechanically linked, and understanding that link is the difference between reactive trading and a genuine safe-haven strategy for Q3 and Q4 2026.
The Transmission Mechanism: Why Oil and Gold Are Moving in Opposite Directions
The connection runs through three steps, as explained by GoldSilver’s August 2026 market analysis:
- Cheaper oil reduces energy-driven inflation. When crude prices fall, headline inflation pressure eases.
- Lower inflation reduces the urgency for Federal Reserve rate hikes. Markets reprice the probability of tightening downward.
- Falling rate-hike expectations ease real yields, and gold — which pays no yield — becomes comparatively more attractive against Treasuries.
This is precisely what played out after a de-escalation in US-Iran tensions in early August 2026: Brent crude fell more than 5% to roughly $83 a barrel and West Texas Intermediate dropped over 6% to around $79, while gold moved higher in response, per GoldSilver’s reporting. OPEC+’s approval of a September production increase of 188,000 barrels per day added further downward pressure on crude.
Gold’s Round-Trip Year: The Chart Most Coverage Misses
Most single-day commodity coverage misses the full-year arc. Gold’s 2026 story is a round-trip, not a straight line, according to drawpie.com’s August 2026 price analysis:
| Date | Event | Approx. Gold Price |
|---|---|---|
| Jan 29, 2026 | Record close | $5,318/oz |
| Jan 28, 2026 (intraday) | All-time intraday record | ~$5,589/oz |
| Late Jan 2026 | Single-session correction | -11.4% (largest single-day drop of the year) |
| Jul 16, 2026 | Cycle low after 5-month grind | $3,986/oz |
| Aug 5, 2026 | Sharp single-day rally | +3.7% |
| Mid-Aug 2026 | Third consecutive weekly gain | Above $4,500/oz |
Despite the record-high headlines in January and the correction headlines that followed, gold spent most of 2026 essentially flat to slightly below where it started the year before this August rally, per drawpie.com — a fact that gets lost in both the bullish and bearish framing competitors reach for.
Who’s Actually Buying: The Central Bank Signal
Retail and ETF flows have been volatile — US-listed gold ETFs saw roughly $5.3 billion in monthly redemptions during the summer correction, according to Yahoo Finance’s gold prediction coverage — but the more telling signal for institutional allocators is central bank demand. Central banks purchased a record 289 tonnes of gold in Q2 2026 alone, a 74% year-on-year jump, according to the World Gold Council’s Gold Demand Trends report cited by GoldSilver. A World Gold Council survey found 45% of central banks plan to add further to reserves, per Yahoo Finance — a structural demand floor that retail sentiment swings don’t erase.
Key Drivers to Watch Through Q4 2026
- Federal Reserve rate decisions: Markets have oscillated between pricing a hold and a hike at recent FOMC meetings; each print reprices real yields and gold in tandem.
- US-Iran and broader Middle East developments: Any escalation reverses the oil-down/gold-up dynamic described above.
- OPEC+ supply decisions: Additional production increases extend the oversupply narrative pressuring crude.
- US Treasury debt-management moves: A Treasury announcement to expand long-term debt buybacks reportedly drove a same-day gold jump of more than 4%, per Trading Economics, by pulling yields and the dollar lower.
A Safe-Haven Allocation Framework for Q3–Q4 2026
Wealth managers structuring client portfolios around this divergence should think in tiers rather than a single “buy gold” call:
- Core hedge (all risk profiles): A strategic 5–10% allocation to physical gold or gold-backed ETFs as a permanent inflation and currency hedge, independent of short-term price swings.
- Tactical overlay (active/balanced portfolios): Incremental additions timed around Fed meeting cycles and geopolitical flashpoints, using the transmission mechanism above as the entry signal rather than headline price alone.
- Energy underweight (Q3 2026 specific): Given the OPEC+ supply increase and de-escalation dynamics, tactical underweight positioning in pure upstream energy exposure, offset by overweight in refiners or energy-adjacent infrastructure less sensitive to crude-price direction.
- Silver as a levered gold proxy: Silver has moved even more sharply than gold in both directions in 2026 and remains in a structural, multi-year supply deficit, per GoldSilver — appropriate for investors with higher volatility tolerance seeking amplified safe-haven exposure.
The Bottom Line
The oil-gold divergence of Q3 2026 is not two unrelated commodity stories — it is one macro trade expressed through two assets connected by inflation expectations and Fed policy. Investors who treat gold and oil as separate headlines will consistently misread the signal; those who track the three-step transmission mechanism will be positioned ahead of the next Fed-driven repricing.
Discover more from The Economy
Subscribe to get the latest posts sent to your email.



Energy prices can move quickly through transportation costs, consumer inflation, political debate and expectations for interest rates. That is why an announcement about diesel shipments from Russia can matter far beyond the oil industry. On October 9, U.S. President Donald Trump announced an arrangement under which Russia would provide diesel to U.S. and global markets, with an initial amount reported as more than 300,000 metric tons and additional volumes proposed for later delivery. Reuters reporting.
The announcement is consequential, but editors must separate agreed or promised supplies from cargoes that have actually arrived and been processed. The arrangement is also politically contentious because it involves easing restrictions on Russian energy revenue while Russia continues its war in Ukraine. Understanding both parts is essential; a pure pump-price article would miss the diplomatic stakes, while a pure geopolitical article could overlook how households and manufacturers feel a fuel shock.
What has been announced—and what remains uncertain
Reuters reported an initial quantity exceeding 300,000 metric tons, with 500,000 tons in November and 1 million tons thereafter discussed as additional supplies. The exact rollout, cargo destinations and future deliveries depend on logistics and policy implementation. The Associated Press reported that the U.S. Treasury issued a temporary license easing relevant sanctions for the arrangement. A license is not the same thing as a permanent, unrestricted return to normal trading. Reuters; Associated Press.
The most useful next questions are practical. Which grades of diesel are eligible? Which ports and refineries can receive shipments? What insurance, shipping and payment channels will be used? Could other fuel trade be displaced rather than global supply increased? Without answers, it is premature to calculate a permanent reduction in pump prices from announced tonnage alone.
Why diesel prices are different from crude-oil prices
Crude oil is a raw feedstock; diesel is a refined product. Diesel availability depends on crude supply, refinery configuration, maintenance, fuel standards, transportation infrastructure and regional inventories. Diesel and crude prices often move together, but refining margins can expand or contract independently. A disruption to refineries or fuel exports may produce a sharp diesel-price shock even if crude prices move less dramatically.
Diesel is essential for commercial trucking, agriculture, heavy equipment and some industrial processes. Higher diesel costs can feed into freight rates and food-delivery expenses, though the timing and degree of pass-through depend on contracts and competition. Household inflation may also be affected indirectly through goods prices, making diesel a politically sensitive indicator even for people who never personally buy the fuel.
The market’s immediate response isn’t a long-term forecast
Reuters said U.S. diesel futures fell nearly 5% following the announcement. A futures move shows how traders adjusted near-term expectations; it does not prove the eventual physical shipments will achieve the stated pricing objective. Reuters October 9.
Markets move on surprises relative to what investors had expected. If traders had anticipated even more supply, prices could still rise despite the announcement. Conversely, an unexpected license can depress futures before a single new cargo is loaded. A fair article reports the change in futures separately from retail diesel prices, which are influenced by local taxes, inventories, refining margins and distribution conditions.
Iran adds a second layer of energy uncertainty
Regional instability involving Iran has intensified concerns about energy routes and supply availability. Risk to strategic waterways, shipping costs, tanker insurance and refinery operations can feed into global prices. But forecasts that any particular route will remain closed, reopen at a specified time or cause a precise percentage increase in inflation require reliable, current verification.
The October diesel plan has been discussed against the backdrop of high fuel prices and broader conflict-related disruptions. Reuters. These events should not be reduced to a single causal statement such as “Iran caused all fuel inflation.” Refinery outages, industrial demand, inventories, government policy and seasonal factors also matter. A successful news explainer distinguishes contributing factors rather than presenting an exclusively geopolitical cause.
Ukraine’s refinery strikes complicate the diplomacy
Ukrainian attacks on Russian energy infrastructure have become an important part of the conflict and the diplomatic debate over the diesel arrangement. Axios reported claims from a U.S. official about disagreements with Kyiv over those attacks and Washington’s decision to pursue a deal with Moscow. The report attributed its characterization of the president’s motives to that official; it should not be presented as an uncontested account of every participant’s intentions. Axios investigation.
Ukraine’s government has objected to measures it sees as providing Russia additional revenue during the war. AP and Reuters reported strong criticism of the sanctions relief. The administration’s stated rationale emphasizes lowering fuel costs. These are distinct policy positions, and a responsible treatment can explain both without treating an announced supply transaction as a negotiated peace settlement. Associated Press.
The sanctions trade-off is economic as well as strategic
Sanctions can restrict access to buyers, financing, shipping and technology. Easing them may improve market liquidity and encourage new fuel flows. But it may also reduce economic pressure on the sanctioned country and alter bargaining incentives. The relevant evaluation must include what was licensed, for how long, and whether the transaction can be reversed if conditions change.
Policy effects are not always immediate. A temporary legal authorization could unlock inventories already available elsewhere, making market prices react sooner than actual shipping. On the other hand, operational barriers can still slow delivery despite a license. Reporting should distinguish market permission from physical production capacity and avoid making unsupported claims about how revenue will be used by a government.
How fuel prices reach headline inflation
A fuel shock has direct and indirect channels. Direct effects show up in categories such as diesel and gasoline purchases. Indirect effects travel through freight, agricultural machinery, heating and the cost of distributing goods. For firms with thin margins, a prolonged fuel-price rise can reduce profitability before consumer prices fully adjust.
The macroeconomic response is more ambiguous. High energy costs can weaken demand, while simultaneously pushing measured inflation upward. Central banks must judge whether the shock will persist and influence broad wage and price expectations. The Fed’s September 2026 statement described inflation as elevated and raised the policy rate to 3.75%–4.00%, underscoring the importance of future energy outcomes for monetary conditions. Federal Reserve policy statement.
A balanced scenario framework
In an easing scenario, announced shipments arrive, existing inventories are accessible, and shipping disruptions diminish. Diesel prices could soften, with some relief passing into freight costs. In a stress scenario, logistics fail, sanctions arrangements face reversal or regional conflict interrupts supply, extending the inflation problem. A mixed scenario is also possible: near-term futures soften but consumer prices remain stubborn because local markets are slow to adjust.
These are scenarios, not verified outcomes. Publishing a precise fuel-price forecast without a model, input assumptions and uncertainty range would be misleading. A stronger publication follows actual cargo movements, inventory reports, refinery output, wholesale crack spreads and retail price data to see which scenario is materializing.
What journalists and readers should verify next
First, read the exact terms and expiration of the relevant U.S. Treasury license. Second, compare company and government announcements with cargo-tracking or customs evidence when available. Third, distinguish oil benchmarks from diesel futures and average retail pump prices. Fourth, update reporting on conditions affecting Iran-linked maritime routes. Fifth, document the responses of Ukraine, Russia and U.S. lawmakers with accurate attribution.
A brief daily update can be more useful than a speculative “end of the energy crisis” headline. It should state what changed since yesterday and what remains unknown. That discipline also helps readers distinguish temporary market relief from a lasting normalization of energy trade.
Frequently asked questions
Did the United States announce a Russian diesel arrangement in October 2026?
Yes. Reuters and AP reported the October 9 announcement and temporary sanctions relief. The delivery schedule still requires verification as supplies move.
Did diesel futures fall after the news?
Reuters reported an initial decline of nearly 5%. Retail prices will not necessarily change by the same amount or on the same day.
Why does Ukraine object?
Ukrainian officials have argued that easing restrictions could generate revenue benefiting Russia while the war continues.
Can a diesel agreement reduce inflation permanently?
Not on its own. Lasting effects depend on supply, demand, logistics, refinery conditions and broader inflation pressures.
Discover more from The Economy
Subscribe to get the latest posts sent to your email.
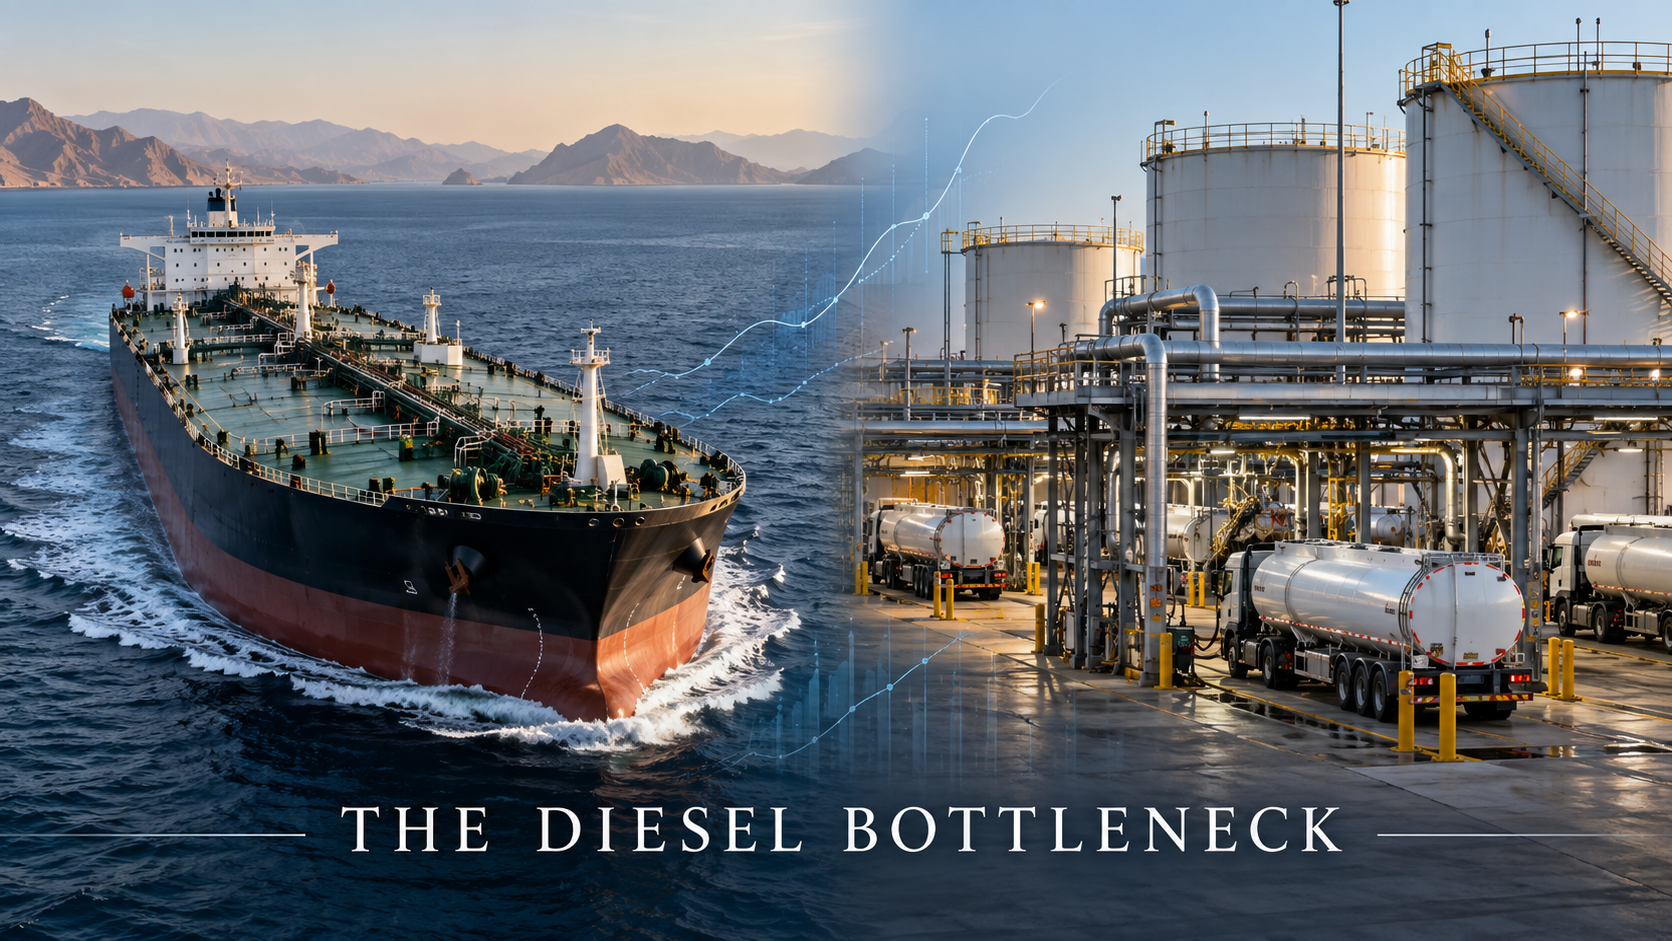
A recovery in crude oil exports from the Gulf does not automatically end a diesel shortage. That apparent contradiction is central to understanding the 2026 Strait of Hormuz energy crisis. Crude is a raw material; diesel is a finished product that must be refined, stored, transported and delivered through a more specific chain of infrastructure. Vessels carrying crude can adapt to a disrupted route while refineries, specialized product tankers or fuel-export terminals remain constrained. Recent Wall Street Journal reporting on the gap between crude and diesel shipments and the U.S. Energy Information Administration’s market analysis show why the difference matters.
Key takeaways:
- Crude oil and diesel are not interchangeable: supplying one does not instantly supply the other.
- Refineries, product tankers, storage and shipping risk can keep diesel scarce even when crude exports rebound.
- A higher diesel cost can affect trucking, agriculture, shipping, construction and food distribution.
- Reliable market analysis tracks crude volumes, refined-product volumes and delivered fuel costs separately.
The missing link between crude oil and diesel
An oil field produces crude. A refinery turns crude into a range of fuels and other materials, including diesel, gasoline, jet fuel and chemical feedstocks. The mix depends on refinery equipment, the kind of crude processed and commercial demand. Export terminals, ships and pipelines then move each finished product to customers.
If a crisis disrupts oil production and tankers, buyers may initially struggle to obtain crude. But if transport arrangements later improve while refineries have been damaged, shut down or constrained, more crude can reach a market without increasing diesel supplies in proportion.
Think of crude as wheat and diesel as bread. Delivering more wheat does not immediately solve a bakery shortage if ovens are broken, labor is unavailable or deliveries of finished loaves are blocked. The analogy is imperfect but captures the distinct production stages.
What the Hormuz data tell us—and what they don’t
The EIA’s energy chokepoint analysis provides a useful historical baseline. Estimated flows of all oil through Hormuz averaged 21.6 million barrels a day in Q4 2025, falling to 4.9 million barrels a day in Q2 2026. The table also separates the commodity types:
| EIA measure | Q4 2025 | Q2 2026 | Meaning |
|---|---|---|---|
| Crude oil and condensate | 15.9 million barrels/day | 3.7 million barrels/day | Raw petroleum and condensate shipments |
| Petroleum products | 5.7 million barrels/day | 1.1 million barrels/day | Refined and other petroleum-product shipments |
| Total oil | 21.6 million barrels/day | 4.9 million barrels/day | Blended oil flow estimate, subject to rounding |
These are quarterly EIA estimates, not October 10 live measurements. The table demonstrates that the crisis affects crude and products differently and that both experienced a steep earlier disruption. It cannot by itself prove how many barrels of diesel were shipped yesterday.
Recent reporting points to a subsequent partial rebound in some crude flows, even while commercial shipping remained under attack. On October 8, Reuters reported a renewed fall in vessel passages and changes in cargo movements. Lloyd’s List Intelligence described expensive workarounds supporting some export recovery.
Therefore, a reader needs to ask not merely whether “oil is flowing,” but which oil, in what form, through which route and at what cost.
Why diesel supply can lag behind crude supply
1. Refining capacity is a separate bottleneck
Crude must pass through refineries to become diesel. A refinery may be physically damaged, operating at reduced capacity, short of utilities or constrained by unavailable equipment. Even when crude arrives, production cannot resume instantly if the refinery is not ready.
The EIA’s July 2026 discussion of market disruption noted that interruptions in Middle East crude and product movements changed global sourcing patterns and helped increase refinery margins elsewhere. That is consistent with a market scrambling to replace missing finished fuel, not simply to find alternative crude.
2. Product tankers and terminals are not identical to crude tankers
Refined products have specific storage, cleanliness and segregation requirements. Moving gasoline, jet fuel and diesel may require different terminal access or cargo handling from very large crude carriers. A network reconfigured around crude exports may not bring the same immediate relief to diesel customers.
3. Trade routes cost more during conflict
Vessel owners may face higher insurance premiums, danger to crews, schedule uncertainty and longer journeys. Those costs can be passed along into delivered fuel prices, even if the underlying crude benchmark has stabilized. A fuel-importing country pays for a delivered product, not merely the price of a barrel posted on an international market terminal.
4. Fuel demand can be difficult to reduce quickly
Trucks, tractors, construction equipment, backup generators and some marine transport cannot instantly change their engines or supply chains when diesel becomes scarce. Short-term demand can therefore be relatively inflexible. Prices may rise while businesses struggle to economize without disrupting essential operations.
5. New supply has to travel a long way
Refineries outside the Gulf can increase exports where spare capacity exists, but additional fuel must still be transported. Longer routes tie up vessels and may require suitable loading and unloading capacity. These delays matter especially during a prolonged regional disruption.
Why pump prices don’t always follow crude oil prices
A pump price combines multiple influences: the crude feedstock, refining costs and margins, transport, storage, taxes, retail operating costs and local competition. At a time of refinery disruption, the refining component can rise independently of crude prices.
For example, if a benchmark crude price eases after a hopeful diplomatic announcement but diesel inventories remain tight, the pump price may decline slowly or not at all. The reverse is also possible: a new refinery supply source or a seasonal shift in demand could ease diesel prices even when crude is volatile.
There is also a timing effect. Retailers may be selling fuel procured at earlier wholesale prices, and product deliveries involve lead times. A single day’s crude-price change should not be mistaken for an immediate prediction about every pump or country.
Why the global economy cares about diesel
Diesel is a central input for moving goods. More expensive freight can raise costs for agriculture, manufacturing, construction and retailers. Food supply chains can face higher fuel bills between farms, warehouses and supermarkets. Logistics firms with fixed customer contracts may experience margin pressure before they can renegotiate rates.
That does not mean every retail price automatically rises by the same percentage as diesel. Final price effects depend on the fuel share of total costs, competition, contracts and how long the shock lasts. Economists should distinguish first-round energy costs from broader inflation pass-through.
For developing economies with heavy reliance on imported fuel, exchange rates and limited fiscal space can compound the challenge. Governments may respond with subsidy changes, strategic stocks or temporary tax measures, each with distributional and budget consequences. Such policies must be sourced country by country rather than assumed.
What would real recovery look like?
A credible recovery dashboard would include several measures:
| Indicator | Why it matters | Misreading to avoid |
|---|---|---|
| Crude exports | Shows flow of feedstock | Does not prove diesel is available |
| Refinery utilization | Shows ability to produce fuels | A refinery may run but produce a changing mix |
| Product export volumes | More direct indicator of diesel/gasoline flows | Must distinguish individual products |
| Product inventories | Shows buffer against temporary shortages | Stocks can lag reported shipments |
| Tanker freight and war-risk insurance | Measures delivery friction | A physically open route can still be costly |
| Diesel wholesale and retail spreads | Shows price pressure along the chain | Taxes and currency also affect local prices |
Tracking all six improves the quality of market explanations. A single Brent-price chart does not establish whether diesel supply has recovered.
Three possible paths ahead
Stabilization: Security improves, more routes become commercially viable, refineries return to normal operations and diesel supply gradually responds. Retail prices could ease, with a lag.
Uneven recovery: Crude volumes recover more quickly than finished fuel shipments. Diesel remains expensive even though some oil-market headlines turn more positive. This is the central risk highlighted by the current crisis.
Renewed escalation: More attacks, terminal damage, port closures or insurance restrictions interrupt both feedstocks and finished products. In that scenario, delivered fuel costs and supply uncertainty could intensify.
These are scenarios, not probability estimates or investment advice. Assigning numerical odds without a transparent model would be misleading.
Frequently asked questions
Why is diesel expensive when crude oil prices fall?
Refinery availability, finished-product inventories, transport and insurance costs can remain strained independently of crude-price movements.
Does the Strait of Hormuz carry diesel?
Yes. Petroleum products as well as crude and gas transit the route, as shown in EIA’s chokepoint analysis.
Can refineries outside the Middle East replace missing diesel?
Some can contribute extra supply when capacity and demand allow, but production, loading, vessels and voyage time limit how quickly shortages can be addressed.
Will a ceasefire immediately lower diesel prices?
Not necessarily. Security improvement may lower risk costs, but refineries, inventories and transport arrangements require time to normalize.
Are gasoline and jet fuel affected in the same way?
They share parts of the refining and shipping chain, but different supply-demand balances can lead to different price outcomes.
Does a lower tanker count mean less diesel for sure?
No. Vessel numbers alone do not tell you the cargo mix, shipment size, load factor or use of alternate routes.
What should transport businesses monitor?
Wholesale diesel prices, reliable supplier availability, inventory conditions, freight and insurance charges, and verified refinery and shipping updates.
Bottom line
The core lesson of the Hormuz crisis is that crude oil supply and finished fuel availability are separate parts of the same system. A headline about recovered barrels can be accurate and still fail to capture the diesel problem. For drivers, freight operators and policymakers, the relevant test is whether usable fuel is reaching the right markets at a sustainable delivered cost.
Discover more from The Economy
Subscribe to get the latest posts sent to your email.
Markets & Finance
Oil Price Outlook 2026: How Supply Risks Reach Fuel Bills, Inflation and Business Costs

Oil prices matter because their effects spread well beyond the energy market. A change in crude costs can alter airline economics, freight charges, farm expenses and household budgets. Yet the route from an oil headline to a local petrol price is neither immediate nor uniform.
The US Energy Information Administration’s October 2026 Short-Term Energy Outlook forecasts Brent crude averaging $105 per barrel in the fourth quarter, $14 above its previous projection. Published on 6 October, the forecast assumes continuing constraints on Middle Eastern flows alongside gradual improvements in production and exports.
The revision shows why a single price target needs context. Oil forecasts depend on physical supply, transport access, inventories and demand. Change one of those assumptions materially, and a forecast that looked reasonable a month earlier may need substantial revision.
A forecast average is not today’s oil price
The most common comparison error is treating a quarterly average forecast as a live market quotation. A quarter can contain sharp rises and falls while still producing an average near the forecast. A year-end target answers a different question again.
Benchmark differences matter too. Brent and West Texas Intermediate represent different crude markets and delivery arrangements. Their prices are related but not identical. An article using one benchmark in the headline and another in the comparison can confuse readers about the size of a move.
Always check the unit, benchmark, time period and publication date. A forecast completed before a major disruption should not be presented as though it incorporates that disruption. The EIA identifies both the release date and forecast completion date, a useful practice for interpreting any time-sensitive energy projection.
Physical supply is more than production capacity
Having oil underground or even at a producing facility is not the same as delivering it to a refinery. Pipelines, ports, tankers, insurance and navigation routes all form part of effective supply.
A disruption at a narrow transport point can therefore matter disproportionately. Alternative routes may exist but lack enough capacity, require longer journeys or introduce additional costs. Longer voyages also tie up vessels, affecting the amount of transport available for other cargoes.
The International Energy Agency’s August 2026 Oil Market Report highlights the importance of disrupted flows in its supply assessment. That report is a dated analysis rather than an October update. Its broader relevance is the distinction between nominal production potential and oil that can actually reach buyers when needed.
Inventories provide a buffer, not an unlimited solution
Stored oil can help bridge a temporary gap between supply and demand. Commercial inventories support normal operations, while government-held reserves may be used under specific policy decisions. Neither should be treated as a permanent substitute for reliable production and transport.
The rate of inventory change can matter as much as the absolute level. Repeated withdrawals suggest that the market is meeting demand partly by using previously accumulated supply. If that continues, the capacity to absorb another disruption may diminish.
Inventory data also require interpretation. Stocks in one location or product category may not solve a shortage elsewhere. Crude oil cannot instantly substitute for unavailable diesel, and transport constraints can prevent stocks from reaching the region where they are most valuable. The practical question is usable supply in the right place and form.
Refining explains why diesel and petrol can behave differently
Crude must be processed into usable products, and refineries have different capabilities. Maintenance, unexpected outages and the composition of demand can affect the supply of individual fuels.
Consequently, petrol and diesel prices do not have to move by the same amount as crude or as each other. A shortage of a particular product can widen its price relative to the underlying oil benchmark. Seasonal changes in transport and heating demand can add further variation.
For businesses, this means a crude forecast may be an incomplete budgeting tool. A logistics operator cares about delivered diesel costs, while an airline is exposed to jet fuel. Their relevant prices include refining, transport and contractual factors that an international crude quotation does not fully capture.
Currency movements change the local result
Oil is widely priced in dollars, but most households and many businesses pay fuel bills in another currency. A weaker local currency can amplify an international price rise or erase the benefit of a decline.
Consider a hypothetical 10% fall in the dollar oil price combined with a 10% increase in the local-currency price of dollars. The combined effect is approximately a 1% decline before other costs, rather than the full 10% saving suggested by the commodity headline.
Taxes, administered prices, subsidies and distribution charges create additional differences between countries. Readers should therefore be cautious about explanations that attribute every pump-price movement to crude alone. In markets such as Pakistan, the exchange rate and domestic pricing decisions can materially influence the final bill.
The inflation effect arrives through several channels
Fuel has a direct place in household expenditure, but energy also enters the cost of producing and delivering other goods. A business facing higher transport bills may raise prices, reduce its margin, alter routes or renegotiate contracts.
How much reaches consumers depends on competition and demand. Companies may find it difficult to pass through costs when customers are already reducing purchases. In that case, the pressure can appear in profitability, hiring or investment instead.
This is why an energy shock can create a difficult economic combination: upward pressure on prices and downward pressure on activity. The size and persistence of each effect depend on the shock’s duration, the structure of the economy and the response of businesses, households and policymakers.
What could pull oil prices lower?
A more reliable flow of supply could reduce the premium associated with disruption. Better transport access, recovering output or additional deliveries from other producers might ease pressure, depending on their scale and timing.
Demand can also weaken. Slower industrial activity, reduced travel or greater efficiency can lower consumption relative to expectations. A falling oil price is therefore not automatically positive news about the global economy; it may reflect improving supply, deteriorating demand or both.
These possibilities should be treated as scenarios. A price decline caused by restored supply would have different implications from one caused by a sharp economic downturn. Readers assessing a market move should ask which side of the supply-demand balance changed and what evidence supports that interpretation.
What could keep prices elevated?
Persistent transport restrictions, damage to infrastructure or uncertainty over reliable deliveries could sustain pressure even if some production recovers. A market with limited spare buffers may react strongly to relatively small additional problems.
Demand can also prove more resilient than expected. Businesses may have limited short-term substitutes for certain fuels, while households still need to commute and transport essential goods. Adjustment often takes time because vehicles, industrial equipment and logistics networks cannot be replaced overnight.
The bullish scenario is therefore not simply that something bad happens. It is that available supply fails to keep pace with consumption for long enough to draw down buffers and change expectations. The strength of that argument depends on measurable flows and inventories, rather than dramatic language alone.
How businesses can plan without predicting perfectly
A useful budget tests several fuel-cost assumptions. The aim is to identify when margins become uncomfortable, which contracts allow adjustments and which operations are most exposed. Scenario planning can reveal vulnerabilities without requiring a precise forecast of the next price peak.
Operational measures may include consolidating deliveries, reducing avoidable mileage and reviewing energy-intensive processes. Their usefulness depends on the business; they are not substitutes for understanding contractual obligations or customer-service requirements. Financial hedging involves separate risks and requires expertise appropriate to the organisation.
The oil outlook in 2026 is best read as a changing assessment of physical flows and economic responses. Forecasts help organise the evidence, but the final effect on a household or company depends on the fuel it buys, the currency it uses and the flexibility it has to adapt.
Discover more from The Economy
Subscribe to get the latest posts sent to your email.

High-Yield Savings Accounts in 2026: How to Compare APY Without Chasing a Headline

EU-China Trade Deal 2026: How Beijing and Brussels Avoided a Trade War—and Who Wins

Social Security 2027 COLA Announcement: Date, Formula and What Retirees Should Check

China’s AI Microdrama Boom: How Beijing Is Reshaping Global Media

Q3 2026 Earnings Preview: Can Record Profit Expectations Keep Wall Street’s Rally Alive?

Russia Diesel Deal 2026: Oil Prices and Inflation Risks

Fed Rates 2026: Treasury Yields, Bonds and SGOV Explained

S&P 500 Market Breadth 2026: Weak Rally or Rotation?

The AI Capex Boom: Data Centers Reshaping Growth

Palantir Stock in 2026: Extraordinary AI Growth

Tesla Physical AI 2026: Robotaxis, Optimus and TSLA Risks

NVIDIA’s AI Grip in 2026: Record Revenue Is Only Half the Investment Story

Hormuz Diesel Shortage: Why Crude Oil Recovery Isn’t Enough

Social Security Extra $90 Deposit: Who Qualifies for the October 2026 Medicare Rebate?

PSX Forecast 2026: KSE-100, IMF Reviews & Geopolitics

Middle East War Economics 2026: Oil Prices & Energy Markets

China Stocks Today: Are Big Economies in Asia Nearing a Market Bottom?

Crypto Daily Outlook: Bitcoin, Altcoins, and the Future of Decentralized Finance

Global Pension Systems Ranked: The World’s Best and Worst Retirement Frameworks

World’s Largest Economies: Ranking the Top Global Powers

Elon Musk’s Next Moves: Disrupting the 2026 Global Economy

Pakistan Economy 2026: Inside the SBP’s Balancing Act

GasBuddy Market Insights: How Crude Price Shifts Impact Local Fuel Cost Averages

World Bank & IMF Reports 2026: Why the “3% Growth” Consensus Is Actually a Debate

Global Equity Market Divergence: US Tech vs. European Dividend Stocks vs. Asian Growth

IMF & World Bank Global Economic Outlook: Growth Forecasts Across Europe and Asia

Silver Price Today: Why the Xi-Trump AI Standoff Is Fueling a Safe-Haven Rally

Crude Oil & Petroleum Market Analysis: OPEC+ Decisions and Price Forecasts
-

 Markets & Finance9 months ago
Top 15 Stocks for Investment in 2026 in PSX: Your Complete Guide to Pakistan’s Best Investment Opportunities
-

 Analysis8 months ago
Johor’s Investment Boom: The Hidden Costs Behind Malaysia’s Most Ambitious Economic Surge
-

 Analysis8 months ago
Top 10 Stocks for Investment in PSX for Quick Returns in 2026
-

 Banks9 months ago
Best Investments in Pakistan 2026: Top 10 Low-Price Shares and Long-Term Picks for the PSX
-

 Analysis8 months ago
Brazil’s Rare Earth Race: US, EU, and China Compete for Critical Minerals as Tensions Rise
-

 Investment9 months ago
Top 10 Mutual Fund Managers in Pakistan for Investment in 2026: A Comprehensive Guide for Optimal Returns
-

 Global Economy10 months ago
15 Most Lucrative Sectors for Investment in Pakistan: A 2025 Data-Driven Analysis
-

 Global Economy10 months ago
Pakistan’s Export Goldmine: 10 Game-Changing Markets Where Pakistani Businesses Are Winning Big in 2025